IN BRIEF: Cutting the Safety Net Is Not an Effective Way to Reduce Government Spending

BRIEFLY…

High-stakes negotiations over the debt limit center on ways to bring government spending more in line with government revenues. The political contours of the debate have excluded cuts to Social Security and Medicare from consideration, as well as the possibility of raising taxes. With these options off the table, much of what is left to consider for budget cuts is a series of programs that provide services and supports to low-income individuals and families. Some congressional policy makers are suggesting that federal spending cuts should come from tightened eligibility and reduced spending on programs whose primary function is to provide health insurance, food purchasing support, and conditional cash assistance to low-income individuals and families with children. Among the three programs at the center of the discussion — the Supplemental Nutrition Assistance Program (SNAP), Temporary Assistance for Needy Families (TANF), and Medicaid – spending on SNAP and TANF amounts to less than 3% of total federal outlays in 2022 and Medicaid spending on children and adults (as opposed to the aged, blind, or disabled) amounts to less than 5% of the $6.2 trillion in 2022 federal government outlays. Since all three programs have been documented to provide large public benefits to vulnerable populations of Americans, cutting them is neither an effective way to rein in the spending that is driving up US debt, nor is it in the nation’s long-term interests.


WHAT TO KNOW

  • The federal government’s two main cash or near-cash assistance programs that provide support to non-elderly, able-bodied low-income individuals and families with children made up a combined 2.7% of federal outlays in 2022 (see chart). The largest of these, the Supplemental Nutrition Assistance Program (SNAP, formerly known as Food Stamps) provides low-income families and individuals with funds to purchase food. In 2022, the federal government spent $149 billion on SNAP across an average of 41 million individuals each month. The Temporary Assistance for Needy Families (TANF) program is much smaller and provides time-limited cash assistance to adults with child dependents. Federal TANF spending totaled $20 billion in 2022, reaching an average of 1.9 million beneficiaries each month. TANF is administered as a grant to states, and in FY21 only 22.6% of all TANF spending was paid out in terms of cash benefits, with the remainder spent on services.
  • In addition to the fact that they make up a relatively small share of Federal spending, budget savings from restricted eligibility coming from enhanced work requirements for these programs are likely to be even smaller. The programs already include some degree of work requirements and time limits. Since the creation of the program in 1996, TANF cash assistance has been tied to work requirements. The SNAP program offers limited assistance to able-bodied adults without child dependents, thereby effectively imposing work requirements for sustained assistance. Specifically, able-bodied adults without dependents are only eligible for benefits for 3 months in any 26-month period, unless they fulfill certain work requirements.
  • Medicaid spending on children and adults (as opposed to the aged, blind, or disabled) amounts to 4.4% of the $6.2 trillion in 2022 federal government outlays. Medicaid provides public health insurance to adults and children whose family income falls below specified income thresholds, as well as to adults with qualifying disabilities and those in long-term care facilities. The program had total outlays of $592 billion in 2022, comprising 9.4% all federal outlays that year. However, payments for children and non-disabled adults accounted for just under half of (46%) of Medicaid spending that year, or a total of 4.4% of all federal outlays. On average in each month of 2022, 37 million children, 39 million non-elderly adults, and 17 million disabled or elderly individuals received Medicaid benefits. On a spending per-enrollee basis, children made up an even lower share of costs: outlays on children averaged $1,720 per child in 2022, compared to $14,520 for each elderly Medicaid enrollee. Tightening eligibility requirements (through work requirements or otherwise) on nonelderly and nondisabled adults – or specifically on parents and children —  would yield only limited cost savings.
  • Funding cuts that reduce spending on children’s health insurance and nutrition come at a social cost. More than 10 million U.S. children — 14.4 percent — lived in poverty in 2019, according to government statistics. Income assistance programs like SNAP and TANF, as well as access to health insurance through Medicaid, are a crucial source of resources for this large share of children  improving their current conditions while also bringing future returns. Evidence from academic research shows that Medicaid spending on children improves their long-term health and economic outcomes, ultimately saving the government money. In other words, this spending constitutes an investment in our nation’s youth and future workforce. Similarly, research has documented that access to SNAP benefits for low-income children leads to long-term improvements in health and economic self-sufficiency, and is a cost-effective investment in young children.
  • The share of government spending on children stands in contrast with the share of resources devoted to older age Americans. Social Security and Medicare, which provide cash benefits and health insurance to the elderly, comprise a large share of federal government spending. Combined, the Social Security Old Age & Survivors Insurance and Medicare programs comprised 31.3% of federal outlays in 2022, providing benefits to 57 million and 65 million recipients, respectively. Spending on these programs is expected to rise further as a larger share of the country’s population enters retirement age. Absent significant reforms or benefit cuts, these two programs are projected to reach a combined 39.3% of outlays by 2028. On the other hand, the share of federal outlays for individuals excluding Social Security and Medicare is estimated to fall by more than half to 16.5% of all spending by 2028. If policymakers intend to address the budget deficit by reining in spending on individuals, these two programs are the place where there is the potential for meaningful reductions in budget outlays, and they could pursue spending cuts on these programs that maintain the distributional goals of progressivity and have negligible effects on human capital development and economic growth.
  • Relatively modest increases in spending on children’s benefits, when compared to the level of spending on older Americans, have been shown to have a powerful effect on reducing child poverty. Spending on children increased temporarily in 2020 and 2021, through expanded SNAP benefits and an enhanced, fully refundable Child Tax Credit (CTC). Spending on SNAP increased modestly from 2.1% of outlays in 2015 to 2.4% in 2022, and the CTC increased from 0.56% of outlays in 2015 to 2.21% in 2022. This spending proved powerful in reducing material hardship among children, with measures of child poverty falling by 50% in 2021. The enhanced CTC itself is estimated to have cut food insufficiency by 25%. Both measures have since expired, however, and federal spending is set to return to shares seen before the pandemic.


THE BOTTOM LINE

The looming issue of the US federal government debt ceiling has focused attention on government spending and the need to bring outlays more in line with revenue. Reining in government deficit spending is ultimately in the nation’s long-term economic interest. However, how the federal government proceeds with spending cuts matters greatly for both the path of government spending and the growth and distributional consequences. Though federal outlays in the form of spending on individuals are concentrated largely on the elderly population through Social Security and Medicare, it is spending on children that yields large social returns in terms of improved health, human capital, economic self-sufficiency, and earnings. Rather than one-time expenditures, these programs are better viewed as initial investments in a healthier, better-skilled future generation. Cutting spending on those programs will have only a small budgetary impact, but potentially large negative long-term effects.

Editor’s Note: The analysis in this memo was jointly produced with EconoFact.

IN BRIEF: The Who, What, and Why of Declining College Enrollment, 2019-2021

BRIEFLY…
College enrollment in the US declined among recent high school graduates in the past couple of years, even as the economic returns to a college degree remain substantial – see this previous IN BREIF. In this post, we show that this drop in college enrollment was concentrated among men, and it was not limited to any particular race or ethnic group of men. Furthermore, labor force participation rates for young men remain depressed. As pandemic-related disruptions abate, it is important to help the young adults whose college plans and entry into the workforce were disrupted to get back on track. It is equally important to ensure that new high school graduates experience higher rates of college enrollment and transitions to the workforce.


WHAT TO KNOW

  • Men have driven the recent decline in college enrollment out of high school. Among all recent high school graduates, college enrollment rates fell from 66.2% in 2019 to 61.8% in 2021. For men, just 54.9% of high school graduates enrolled in college in 2021, down from 62.0% in 2019. Among women, rates of enrollment remained more stable over this time period, falling slightly from 69.8% to 69.5%. Top-line data just released for 2022 indicate that the declines might be tapering off; overall enrollment is holding steady at 62.0% and men’s college enrollment rate was at57.1% in 2022, which is higher than in 2021, but still below pre-pandemic levels.

Figure 1. College Enrollment Rates of New High School Graduates

  • The pandemic-era decline in college enrollment out of high school occurred across men of most major race and ethnic groups. Among White, Non-Hispanic men, enrollment rates fell from 62.7% to 55.3%; the enrollment rate among Non-White, Non-Hispanic men dropped from 59.1% to 52.6%. Hispanic men experienced the largest drop between 2019 and 2021 – from 63.4% to 51.1%.

Table 1. “Immediate” College Enrollment Rates of Recent High School Grads, Men

  • These men and women graduating but not enrolling in college are less likely to be in the labor force than those in previous years who graduated but did not enroll in college. Despite anecdotal evidence that high schoolers are foregoing college to take advantage of the tight labor market, On the other hand now, the rate of male graduates who are neither in college nor in the labor force rose 6 percentage points and the share of women not in college and not in labor force rose 3 percentage points.

Table 2. Labor Force Status of Recent High School Graduates Not Enrolled in College

  • House or family care was a large factor keeping younger men and out of the labor force, particularly in 2021. In 2021, 10.3% of men out of high school not in college cited “taking care of house or family” as the reason they were out of the labor force, compared to 4.5% in 2019. There was also an increase in the share of female non-college enrollees who cited this factor: 13.7% of women cited caregiving responsibilities as the reason they were out of the labor force in 2021, compared to 8.2% in .

Figure 2. Primary Activity of Recent High School Graduates Not in College


THE BOTTOM LINE
The decline in college enrollment rates accelerated sharply during the pandemic and was particularly large among men putting off college right after high school. These graduates did not enter the labor force, but rather many college plans were disrupted by COVID-related caregiving needs. As the individual economic returns to a college degree remain as high as they have ever been and as the business needs for a skilled workforce continue to grow, it is vital to ensure these graduates and future cohorts return to the college pipeline.

IN BRIEF: The College Wage Premium Through the COVID-19 Pandemic

IN BRIEF
COVID-related disruptions coupled with a tight labor market have led to a historic decline in college enrollment of recent high school graduates over the past three years. This drop, however, comes as the earnings premium for a college degree remains substantial and near decades-long highs. As globalization and technological advances fuel business demands for highly-skilled workers, improving college enrollment and completion rates is key to improving the American workforce’s competitiveness and families’ economic security. 

WHAT TO KNOW

  • In the Fall of 2022, there were 1.23 million fewer undergraduate students enrolled in college than there were just before the pandemic, according to estimates released in February 2023 by the National Student Clearinghouse Research Center. Although enrollment had been declining modestly before the pandemic, this most recent figure represents an 8% drop since the Fall of 2019.
  • Research indicates that recent high school graduates have been delaying or foregoing college due to COVID-related disruptions to household finances and a strong labor market for workers without a college degree. Indeed, as shown in the figure below, the rate of recent high school graduates enrolling into college in the same year has declined from 66.1% in 2019 to 61.8% in 2022 – the lowest level since 2001. This decline in immediate enrollment was particularly large for men, reaching its lowest level (54.9%) since 1983. The enrollment report did find a 4.3% increase in the number of freshmen entering college, a sign that some students who delayed enrollment by a year or two are beginning to find their way back to college.

Figure 1. College Enrollment Rates of New High School Graduates

  • Despite those initial encouraging signs, the large drop in college enrollment seen over the past three years is troubling because the return to a college degree remains near historic highs. Figure 2 extends previous estimates of college wage premia – that is, the difference in log annual earnings between those who have received a bachelor’s degree (or associate’s degree) and those who have not – through 2021. The BA/high school wage premium stood at 88% in 2021 and the AA/high school wage premium at 19%.

Figure 2. College Wage Premia, 1980-2021

  • As argued in a recent AESG policy volume by Austan Goolsbee, Glenn Hubbard, Amy Ganz and Melissa Kearney, increasing educational attainment is key to both maintaining the competitiveness of the US economy and to improving households’ economic security. As globalization and advances in technology increase businesses’ demand for highly-skilled workers, adults with college degrees have an unemployment rate roughly half that of adults with a high school degree or less. Simulation exercises in Hershbein, Kearney, and Pardue (2020), find that a modest increase in educational attainment of 4 million BA holders and 4 million AA recipients would reduce the share of low income families by 15%.

THE BOTTOM LINE
Currently the earnings premium for workers with a BA stands at 90% and the premium for workers with an AA at 19%. Further increasing educational attainment will meet business demands for highly-skilled workers, fostering faster economic growth, while also reducing poverty. Yet, over the past three years, there has been a historic decline in college enrollment. Reversing this decline – and indeed increasing postsecondary enrollment and completion – will improve America’s long-term economic competitiveness and households’ economic security.

A Proposal for an Enhanced Partially Refundable Child Tax Credit

This proposal was produced in collaboration with The Hamilton Project. The proposal will be presented by Wendy Edelberg at a Hamilton Project event on March 1st and can be viewed here.

Download (PDF)

INTRODUCTION

The economic case for expanded income assistance to low-income families with children in this country is exceptionally strong. We have ample evidence showing that increased income assistance to low-income families with children yields improvements in educational outcomes and earnings in adulthood.1 This is in addition to evidence showing that expansions in programs that provide low-income children with other forms of support such as food benefits, public health insurance, and early childhood education lead to improvement in immediate childhood outcomes as well as outcomes as adults.2

Against this backdrop of evidence, our country recently experimented with providing more income assistance to families with children in the form of an expanded Child Tax Credit (CTC) that was in place for the 2021 tax year. The expanded CTC featured a full credit amount of $3,600 for children under age 6 and $3,000 for children ages 6 to 17, as compared to a full amount of $2,000 for all ages to age 16 in effect before the expansion. In addition, the 2021 CTC was fully refundable, meaning that even families with no earnings (and hence no income tax liability) were eligible to receive the full credit amount. That full refundability delivered the maximum credit to roughly 2 million children (ages 0 through 16) who would otherwise be ineligible for any credit on the basis of low or no parental earnings.3

Our nation’s experiment with an expanded CTC in 2021 revealed the possibilities, promises, and political pitfalls of expanded income assistance to low-income families delivered in the form of a tax credit. The 2021 CTC expansion increased the economic security of millions of children. There was a large decrease in child poverty and food insecurity, with some estimates suggesting that child poverty was reduced by one third as a result of the expansion.4 However, it was very costly, with the Joint Committee on Taxation estimating that the one-year expansion cost the federal government $109.5 billion, in addition to the extant cost of the existing credit (Joint Committee on Taxation, 2021). There have been many calls to build on the success of this policy experiment, but the failure of Congress to renew the 2021 expansions makes it clear that doing so requires political will and policy compromise.

In this essay, we propose a compromise enhanced CTC design that is distinct from both the 2021 expansion design and current law. In the absence of political constraints, we would propose a design that awards the full credit amount to those with no earnings to advance the goal of delivering income assistance to the most economically vulnerable families. However, the design we propose here, with a partial award to nonearners and a sharp phase-in, helps address the three main concerns that various policymakers and commentators have expressed about reintroducing the 2021 expansions. First, there is a concern about the labor supply reduction that would result from a fully refundable expanded tax credit—that is, one that would award $3,000 or $3,600 per child to parents with no earnings. Second, there is a concern that sending that much income to out-of-work parents could be counterproductive if out-of-work parents struggle with substance abuse and would not spend the additional cash in ways that are beneficial to children; this concern takes on heightened salience amidst the ongoing opioid crisis in the U.S.5 Finally, some find the fiscal cost associated with the 2021 expanded design unjustifiably high.

Our design recommends a full credit amount of $3,000 for children between the ages of 6 and 17 and $3,600 for children under 6, consistent with the 2021 CTC expansion. Other features of our proposed design differ from both the 2021 expansion and current law. Under our proposed design, families with no earnings are eligible for half the full credit amount for each child and there is a steep phase-in of the full credit. Those specifications help address concerns about the negative effects on labor force participation of a fully refundable credit and indeed significantly increase the after-tax and transfer return to working additional hours for low-income parents. The partial award to non-earners also mitigates concerns about sending amounts as high as $3,600 per child in unrestricted cash to out-of-work parents who might not use such substantial financial resources in ways that benefit children but still delivers critical income assistance to children living in economically-disadvantaged households.6 In addition, our design features a slow phase-out of the full credit beginning at $75,000 for single filers and $110,000 for married joint filers;7 these are lower threshold amounts than the 2021 CTC and current law, and thus lower the fiscal costs.

[Keep reading…]

Download (PDF)


1 See, for instance, studies documenting such effects from  expansions to the Earned Income Tax Credit and casino  dividend payouts to tribal families, including Akee et al. (2010),  Barr, Eggleston, and Smith (2022), Bastian and Michelmore  (2018), and Dahl and Lochner (2011).

2 See, for instance, Bailey et al. (2020), Brown, Kowalski, and  Lurie (2020), Hoynes et al. (2016), Miller and Wherry (2019),  and Thompson (2018).

3 Tax Policy Center (2022).

4 See Greenstein (2022a) for a review of this evidence.

5 See, e.g., Hammond (2022).

6 We note below that ideally a well-functioning, well-resourced  child welfare system could be relied upon to make sure that  children in vulnerable family settings benefit from government  benefits for which they might qualify.

7 Those thresholds and all dollar-level specifications would be  indexed to inflation going forward.

IN BRIEF: Entrepreneurship Since the COVID-19 Pandemic

Editor’s note: The Aspen Economic Strategy Group is pleased to welcome Luke Pardue, an economist at the payroll and HR platform Gusto, as an AESG Fellow. Luke obtained his PhD in economics from the University of Maryland and previously worked at the Federal Reserve Board and the US Census Bureau. As an AESG Fellow, Pardue will highlight trends shaping the US economy and discuss their relevance to economic policy in a monthly series called IN BRIEF.

IN BRIEF
For nearly four decades, the US economy has experienced a decline in business dynamism, as measured by business startup rates, closure rates, and the movement of workers between firms. In the early stages of the COVID-19 pandemic, however, there was a sharp uptick in new business formation. This measure of entrepreneurial activity remains elevated today, suggesting that pandemic-induced disruptions have sparked a longer-lasting surge in business dynamism. Such a reversal of decades-long trends could lead to increased innovation, faster growth, and a more resilient economy.

WHAT TO KNOW

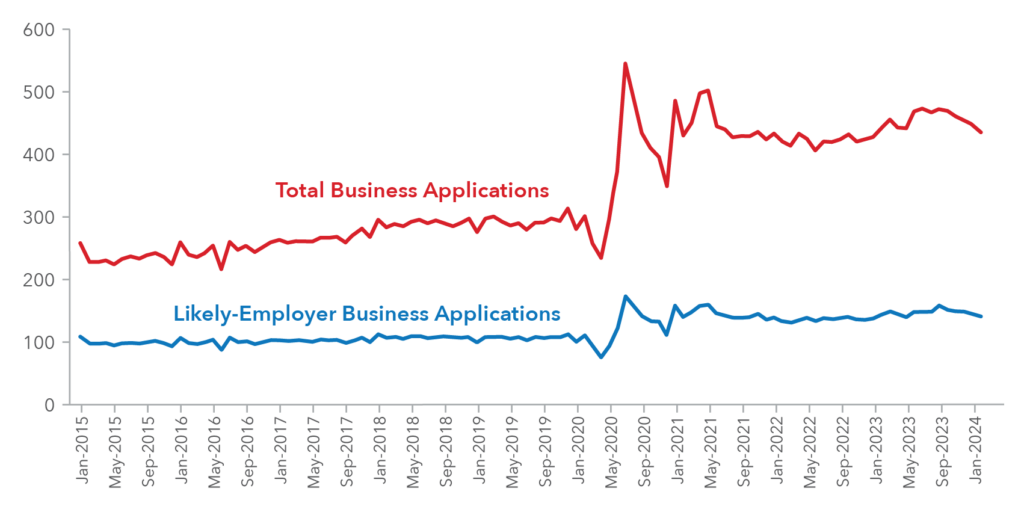
  • In 2020, there were 4.4 million applications for new businesses in the United States, nearly one million more than the 3.5 million applications in 2019. The pace of entrepreneurship accelerated further in 2021, when 5.4 million new businesses were formed, and remained elevated last year, with 5.0 million business applications, according to data released by the US Census Bureau this week.
  • This jump has occurred not only among businesses without employees (“Sole Proprietorships”), but also among firms with a high propensity to hire additional employees (“Likely Employers”). The growth in applications among likely employers represents a shift in economic activity away from older, larger firms towards younger, smaller businesses – reversing a decades-long decline in the prevalence of such startups.

  • New employer businesses have been forming most quickly in industries severely disrupted by the COVID-19 pandemic. Looking at the five fastest-growing industries compared to their February 2020 levels, applications have risen most quickly in Accommodations and Food Services (+41% in that time), Retail Trade (+30%), Transportation & Warehousing (+24%), Health Care and Social Assistance (+28%), and Construction (+17%). The growth in these industries indicates that entrepreneurs are responding to these disruptions with new innovations — meeting consumers’ needs while creating additional jobs at the same time.

  • There are also early signs that this sharp rise in entrepreneurship will continue beyond the short term. In 2020, 35% of new business owners started a firm because they were laid off from their job; in 2021, the top reason shifted to these owners were seizing new pandemic-related opportunities. This change represents a movement from what scholars call “subsistence entrepreneurship” to the much more sustainable, longer-lasting “transformational entrepreneurship.”
  • This surge in new business formation has long-term implications for the US economy. As Ufuk Ackigit and Sina T. Ates point out in their chapter of AESG’s latest policy volume, the long-term decline in the prevalence of younger, smaller firms in the US has been accompanied by reduced innovation and slower economic growth. This return of dynamism we are seeing in the growth of startups could signal the return of a more competitive economy, leading to greater innovation, higher productivity, and faster economic growth.

THE BOTTOM LINE
Prior to the pandemic, entrepreneurship had been on the decline in the US for decades, and the economy was increasingly dominated by older, larger firms. Today, levels of new business creation remain nearly 50% above their pre-pandemic levels, as entrepreneurs respond to COVID-induced disruptions. Creating an economic environment that continues to foster entrepreneurship well after the pandemic is key to building a more competitive, faster-growing economy.


Local Labor Market Impacts of the Energy Transition: Prospects and Policies

Society’s transition toward more sustainable energy sources is well underway. But substantially reducing the use of fossil fuels to generate electricity, to power vehicles, and to manufacture the stuff of everyday life will profoundly disrupt the communities that currently dedicate themselves to carbon-intensive industries. In this paper, I consider the potential for adverse labor market consequences from the energy transition and the suitability of existing policies to counteract them. Top of mind in this discussion is to avoid repeating the painful adjustment to globalization and automation, which in recent decades brought concentrated job loss and long-lasting economic distress to local labor markets that had been specialized in manufacturing. I begin by mapping the spatial distribution of employment in fossil-fuel-intensive activities across US commuting zones from 2000 forward. Then, using the labor market consequences of the post-1980 decline of coal as a backdrop, I discuss policy options for easing adjustment to the energy transition, including letting market forces work, reinforcing the social safety net, and expanding place-based policies.
Download (PDF)

Executive Summary

Lessons from COVID-19 Aid to State and Local Governments for the Design of Federal Automatic Stabilizers

In this paper Clemens and Veuger analyze pandemic-era federal fiscal assistance to state and local governments and draw lessons for the design of stabilization policy. They start by explaining why the federal government plays a key role in stabilizing state and local government budgets across the business cycle, before describing the shape this role currently takes. Then, they provide an overview of how the COVID-19 crisis was expected to affect state and local budgets, and how those expectations affected the amount of fiscal relief the federal government provided. They next assess the design of the federal response and evaluate its effectiveness. They conclude by drawing lessons for the design of future countercyclical federal aid to state and local governments. The authors argue for tying the quantity of aid provided to national measures of tax bases and propose three delivery mechanisms: rule-based grants, loans, and an insurance program.

Download (PDF)

Executive Summary

Will Population Aging Push Us over a Fiscal Cliff?

The share of the US population age 65 and older is rising dramatically. In the year 2000, 12 percent of the population was over age 65; by 2050 that share will be 22 percent. Much of that aging has already occurred: in 2022, just over 17 percent of Americans are retirement age. Population aging is applying upward pressure on government deficits as a result of increased public spending on programs, including Social Security and Medicare, that are designed to support older Americans. I argue that broader distributional measures assessing who pays for and who benefits from age-related government programs, both across and within generations, are necessary to inform policy decisions. However, in addition to direct aging-related government expenditures, I argue that unfunded spending in other, non-aging parts of the budget along with recent tax policy changes portend significant intergenerational redistribution. These distributional impacts should be measured and taken into account by lawmakers who seek to address looming fiscal challenges in a more equitable way.

Download (PDF)

Executive Summary

Seven Recent Developments in US Science Funding

DOWNLOAD

Over the past century, scientific research and development (R&D) has fueled US economic and military might and propelled the country’s status as a global superpower. These investments have helped to launch not only the technologies that define modern life, including the internet, mobile and personal computing, and artificial intelligence, but also the healthcare advances that have extended US life expectancy by nearly 20 years, including vaccines, diagnostic technologies, and novel drug therapies. As Ben Jones described in a 2021 AESG paper, the returns on publicly funded scientific investment are substantial: “effectively, the science and innovation system is akin to having a machine where society can put in $1 and get back $5 or more.”

Vannevar Bush’s influential 1945 report Science: The Endless Frontier laid the original groundwork for a national science strategy premised on the idea of a triangular partnership among government, academia, and the private sector—rather than a strategy that concentrates research activity within the federal government (Isaacson, 2019). That informal partnership largely remains intact today and is reflected in the billions of dollars the National Institutes of Health (NIH) grants each year to academic institutions for medical research; in organizations such as the Defense Advanced Research Projects Agency (DARPA), which produces breakthrough technologies in partnership with industry and academia; and in the National Science Foundation (NSF), which funds roughly a quarter of the basic research conducted at US colleges and universities. But much about the national strategy has also changed—as have its results.

The landscape for scientific funding has evolved since its early days and now comprises a complicated array of government agencies, private ventures, and partnerships between the two. This report casts light on the current state of US science funding and the institutions that support that funding, highlighting seven ways in which the size, composition and structure of US scientific research and development have developed since Vannevar Bush’s seminal report. What emerges is a portrait of the complicated arrangements that extend across the federal government, the business sector, higher education, and nonprofits.


1.   The United States leads the world in gross R&D domestic investment, but China is quickly narrowing that gap.

US national R&D investment is the highest in the world. At over $700 billion in 2020, US R&D expenditures exceed those of Japan, Germany, South Korea, France, India, the United Kingdom, and Russia, combined. But China is closing the gap. As demonstrated in Figure 1A, which charts gross domestic expenditures on R&D by country in billions of PPP dollars (left axis) and as a share of GDP (right axis), total Chinese annual R&D investment exceeded $500 billion as of 2019—the latest year for which comparable data are available. China’s R&D investment has accelerated over the past decade, growing at an average annual rate of 10.6 percent, roughly twice that of the United States over the same period (see Figure 1B). Meanwhile, South Korea and Taiwan, both small, technologically advanced countries, lead the world in R&D investment when measured as a share of GDP.

Figure 1a. Gross Expenditures on R&D (GERD) and R&D Intensity,
Top 17 Countries, 2019 or Most Recent Data Year

Source: National Science Board, National Science Foundation (2022).

Figure 1b. Gross Domestic Expenditures on R&D by Selected Country, 1990–2019

Source: National Center for Science and Engineering Statistics (2022).


2. Over the past 30 years, business R&D investment has accelerated while federal investment has plateaued.

Seventy-three percent of American R&D investment is funded by the business sector, which receives tax benefits designed to incentivize such investments. As demonstrated in Figure 2, business investment in R&D accelerated between 2010 and 2020, growing at a pace of roughly 5.8 percent per year, and reached $517 billion (current dollars) in 2020, nearly four times the amount of federal R&D funding, which has remained relatively flat over the past decade. As a result, federal R&D funding has not kept pace with economic growth and stands near a 60-year low when measured as a share of the overall economy (see Ganz and Vincent, 2021). These trends are noteworthy since business-funded investment tends to favor later-stage R&D while federal investment is more likely to support early-stage, exploratory research. However, direct federal expenditures represent only a portion of total federal support for R&D. Tax subsidies for research expenditures, most notably the R&D tax credit, are expected to total more than $80 billion over 2020-2024 (Joint Committee on Taxation, 2020). The non-profit and higher education sectors meanwhile fund a relatively small share of total R&D expenditures, accounting for $53 billion (current dollars) in 2020.

Figure 2. US R&D Expenditures by Funding Source, 1990–2020

Source: National Center for Science and Engineering Statistics (2022).


3. The federal government is the largest source of funding for basic science R&D, but the business sector is the largest source for applied R&D.

Figure 3. R&D Funding by Type of Funding and Sector, 2019

Source: National Center for Science and Engineering Statistics (2022); authors’ calculations.

Figure 3 disaggregates R&D by type of research—applied, basic, or experimental development. Each type of research entails a different risk profile in search of different goals. While applied research is directed toward a specific objective or application, basic research is more flexible: results are not committed toward any particular application. Experimental development meanwhile applies existing research, knowledge, and experience to new products, processes, or improvements (NCSES, 2022).

Figure 3 also disaggregates R&D by sector—business, the federal government, higher education, and nonprofits—and demonstrates that the three types of research draw their funding from the various sectors in significantly different proportions. For instance, the federal government is the largest source of funding for basic research (41 percent of the total), followed by the business sector (33 percent), while higher education and nonprofits each contribute around 13 percent of the total. In contrast, business funds the majority of applied research (55 percent), followed by the federal government (32 percent), with the remaining share (13 percent) coming from higher education and nonprofits combined. Finally, the business sector funds 87 percent of all experimental development while the government funds just 11 percent of the total.

The changing composition of the funding landscape in recent decades has shifted the composition of R&D being performed. Increases in the business sector’s contribution to total R&D funding over the past decade has led to a 76 percent increase in applied research, as compared against a 42 percent increase in basic research over the same period.


4. The higher education sector is the largest performer of basic science R&D in the United States.

Figure 4. R&D Performance by Type of Funding and Sector, 2019

Source: National Center for Science and Engineering Statistics (2022) and authors’ calculations.

R&D performance differs from R&D funding. In the triangular partnership between business, government, and higher education, the business sector performs three quarters of total R&D,[1] followed by higher education (12 percent) and the federal government (9 percent).

Among the total R&D performed by businesses in 2019, nearly 60 percent was spent on manufacturing, including pharmaceuticals, computers, and electronics. The information industry (22 percent) represented much of the remaining spending (Wolfe, 2021).[2] In contrast, the federal government spends most of its R&D funding on medicine and life sciences, space, defense, and energy.

The distribution of funding within each source is not consistent across research types. Higher education performs the greatest share of basic research (48 percent), followed by business (32 percent), the federal government (12 percent), and nonprofits (9 percent). Of the basic research performed by higher education, just over half is funded by the federal government.

The majority of R&D performed by the higher education sector is spent on life sciences (56 percent), followed by engineering (15 percent), physical science (6 percent), geosciences (4 percent), social science (3 percent), and computer science (3 percent) (Gibbons, 2021; NCSES, 2022).[3] Within the life sciences investment, health-related R&D comprised 56 percent of the total.


5. The Department of Defense accounts for the largest share of federal R&D investment, followed by the NIH, the Department of Energy, and the National Aeronautics and Space Administration.

Figure 5. Federal R&D Funding by Agency, 2022 ($millions)

Source: Congressional Research Service (2023).

Figure 5 depicts the distribution of federal R&D appropriations across federal agencies. Five agencies receive 95 percent of federal R&D funds.

The Department of Defense (DOD) maintains the largest R&D[4] budget at just under $120 billion,[5] constituting around 55 percent of total federal R&D funding. Fifty-five percent ($65.4 billion) of the DOD’s budget is allocated to experimental development activities, which includes larger-scale experimental hardware development, prototypes, and proof-of-concept designs. Non-experimental development, which supports system improvements in existing operational systems, receives 37 percent ($44.2 billion) of DOD R&D funding. DARPA, which is widely celebrated for its contributions to the creation of the internet, GPS, voice recognition, Moderna’s COVID-19 vaccine, among countless other breakthrough technologies, has an annual budget of $3.9 billion in 2022, which is less than 4 percent of the total spent on R&D by DOD.

The NIH receives just over 20 percent of all federal R&D funding, the most of any government agency. This appropriation is allocated across 24 different research institutes. The largest funding recipients within the NIH are the Institutes for Cancer ($6.9 billion), Allergy and Infectious Diseases ($6.3 billion), and Aging ($4.2 billion).

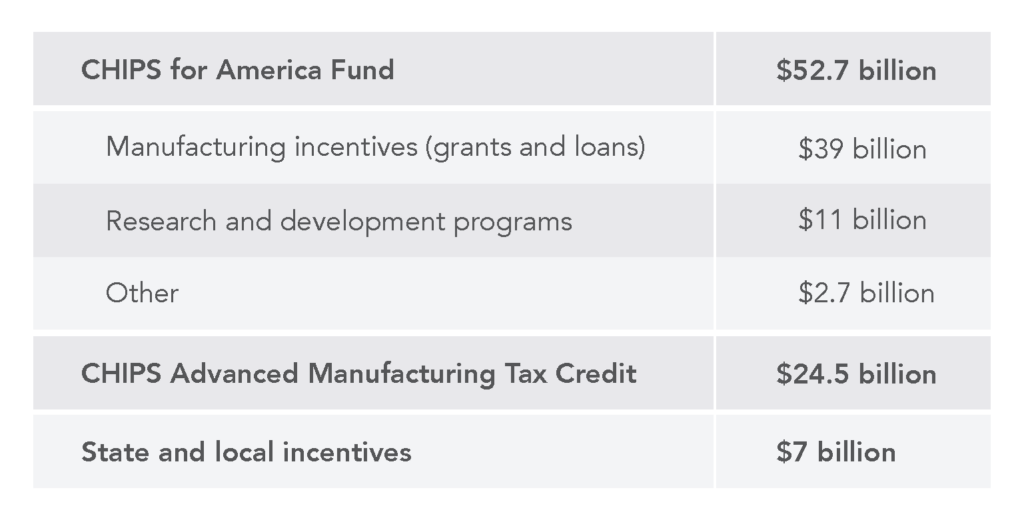
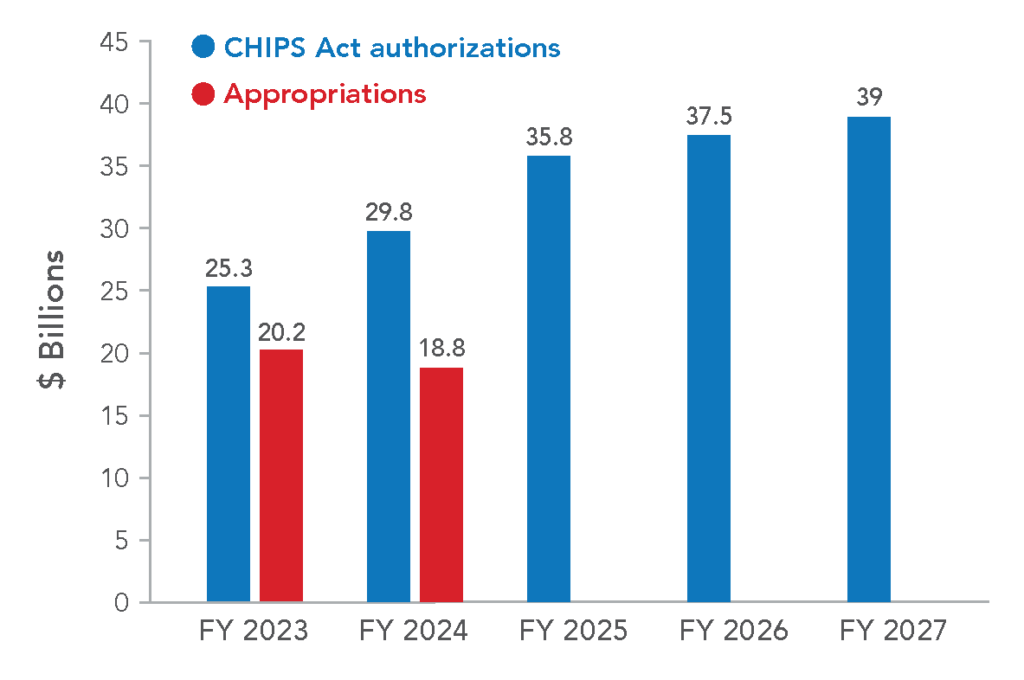
The Department of Energy (DOE) received $19.1 billion for fiscal year 2022, allocated across four offices and administrations and to four additional energy programs. Among those offices, the Office of Science, which funds physical sciences research, and the Office of Energy Efficiency and Renewable Energy (EERE), which focuses on renewable energy, low carbon transportation, manufacturing, and weatherization, received the bulk (71 percent) of DOE’s federal R&D funding. The CHIPS and Science Act appropriated approximately $30.5 billion in new funding to the DOE over the next five years for basic and applied energy research.

The National Aeronautics and Space Administration (NASA) received $12.5 billion for fiscal year 2022, 6 percent of the total federal R&D budget. Over 60 percent ($7.5 billion) is allocated toward “Science,” which includes funding for the recently employed James Webb Space Telescope. Another 23 percent ($2.9 billion) is allocated toward deep space exploration and operation programs.

Of the $7 billion allocated to the NSF, the overwhelming majority (81 percent) is used to fund “Research and Related Activities” (R&RA), which includes early-stage research across all areas of science technology and engineering and mathematics (STEM) (NSF, 2021). The CHIPS and Science Act allocates substantial new resources ($20 billion over baseline over the next five years) to the NSF to establish a new Directorate for Technology, Innovation, and Partnerships (TIP) to accelerate translational research and support STEM-related workforce development. The CHIPS and Science Act also provides an additional $16 billion over baseline over the next five years for basic research and programs to develop the STEM workforce.

The Department of Agriculture allocates most of its $3.7 billion R&D budget to the Agriculture Research Service ($1.8 billion), USDA’s in-house basic and applied research agency, and to the National Institute of Food and Agriculture ($1.6 billion), USDA’s principal extramural research agency that partners with education institutions, private organizations, and individuals to conduct projects and research. The remainder of the agricultural R&D budget is allocated to the National Agricultural Statistics Service and the Economic Research Service.

The Department of Commerce splits its $2.4 billion R&D budget between two of its major agencies: the National Institute of Standards and Technology (NIST) and National Oceanic and Atmospheric Administration (NOAA). NIST research provides measurement, calibration, and quality assurance techniques to support US commerce, while NOAA produces research relating to ecosystems, atmosphere, and global climate change. The CHIPS and Science Act allocates an additional $2.8 billion over the next five years to research conducted by NIST (Department of Commerce, 2022).

The federal government also provides R&D funding to the Department of Veterans Affairs ($1.6 billion), the Department of Transportation ($1.2 billion), and the Department of the Interior ($1.1 billion). Included in the $2.7 billion funding represented in the “Other” category in Figure 5 are allocations for the Environmental Protection Agency ($781 million), the Department of Homeland Security ($664 million), the Department of Education ($405 million), and the Smithsonian Institution ($332 million).


6. Since the late 2000s, federal expenditure on R&D has shifted toward tax incentives and away from direct financing.

The research and development tax credit, first enacted in 1981 under the Economic Recovery Tax Act, was made permanent in 2015. The credit is calculated based on the change in a firm’s R&D expenses over a defined period, rather than on its gross R&D expenses. As Bloom et al. (2019) highlight, this method enshrines the United States among the bottom third least generous of Organisation for Economic Co-operation and Development (OECD) member countries. US tax incentives reduce the cost of R&D spending by an average of 5 percent, as compared to the 30 percent subsidy in countries with the most generous tax regimes.

Nevertheless, the Joint Committee on Taxation estimates the cost of government tax support for R&D rose from $9.5 billion in 2000 to $22.1 billion in 2018, as measured in 2015 constant dollars. According to the OECD (2021), 91 percent of the total tax subsidy credit is awarded to firms with gross receipts in excess of $50 million. Surveying the literature on the effectiveness of R&D credits, Hall (2019) concludes “that they are generally effective at increasing business R&D, with a price elasticity of minus one.” That is, each dollar of tax revenue foregone increases R&D spending by approximately a dollar.

Figure 6. Direct Funding of Business R&D and Tax Incentives for R&D in the United States, 2000–2018

Source: Chart recreated from OECD (2021).


7. Funders now employ a variety of traditional and newer mechanisms to select projects and scientists for funding.

While the federal government funds $160 billion in R&D each year, there remains significant debate over how to maximize that investment’s effectiveness. A substantial share of this funding, including an estimated 95 percent of academic medical research (Guthrie et al., 2018), is allocated through agency-led peer review processes at institutions such as the NIH and NSF. But various institutions have developed alternative models in response to recognized weaknesses in the traditional peer review model. Table 1 highlights the distinguishing features of four prominent project selection models, including the peer review model.

Table 1. Project Selection Models

Sources:  NIH (2021a); National Science Foundation (n.d.); Bonvillian (2020, 2021); Congressional Research Service (2021a, 2021b); GAO (2021); HHMI (2022); ARC (n.d.); MacArthur Foundation (2022).

1. Peer Review

The peer review model is a bureaucratic review process used to solicit and to select proposals for specific projects. After applications for a particular project are opened, submitted proposals are subjected to multiple rounds of expert review. Review teams are supervised by a lead program officer, who receives the team’s recommendations about proposal funding. If a lead program officer or Director recommends the proposal for award, some agencies will then require a review of business, financial, and policy implications. Once the review is completed, a final decision is made to fund or decline the proposal.

The peer review system’s weaknesses are well-known: the process is time-intensive (Publons, 2019); the burden of which falls on applicants who may or may not receive funding (Rockwell, 2009; Guthrie et al., 2018; Herbert et al., 2013); and there is evidence of bias against the most innovative research and in favor of older or previously funded researchers (Luukkonen, 2012; Ayoubi et al., 2021). While the peer review process outperforms random assignment of science funding, it is a weak predictor of future research performance in some research sectors (Guthrie et al., 2018; Fang et al., 2016). And these critiques are not unique to the United States. In Canada, for example, researchers have observed that the cost of peer review is greater than the cost of awarding all qualifying scientists a $40,000 grant (Gordon and Poulin, 2009).

Researchers (Ricón, 2021; Fang and Casadevall, 2016) have proposed modifying the peer review system by instituting a lottery in instances where the supply of qualified applications exceeds the available funding. Proponents of these modified lottery systems emphasize the mixed results of the peer review process at generating innovative research and highlight that a quasi-randomized system could substantially reduce reviewer bias, improve grantee diversity, and expedite the selection process. The idea has gained momentum internationally, with notable institutions such as the Health Research Council of New Zealand and the Swiss National Science Foundation becoming the latest to experiment with the process (Adam, 2019).

2. Portfolio

The portfolio approach, used most notably by DARPA and Operation Warp Speed (OWS), is geared toward generating new ideas to address novel problems. Unlike the peer review process, the portfolio approach simultaneously funds a variety of projects working to solve the same problem. By investing in a wide range of options (a “portfolio”), organizations increase the chance that at least one project will prove successful, while also accepting the risk that more projects will likely fail. Unlike the peer review model, the portfolio approach encourages funding organizations to invest in “risky” proposals that may otherwise be rejected.[6] Organizations that use the portfolio approach often employ a flat, non-hierarchical structure, allowing them to expedite the project selection process.

DARPA is one of the more prominent examples of an organization using the portfolio approach. Established in 1958 as an agency of the DOD, DARPA aims to maintain and to advance US technical superiority (Congressional Research Service, 2021b). The agency is composed of a Director, a Deputy Director, and approximately 100 program managers (PMs), each of whom serve five-year appointments to create and oversee ambitious R&D programs. Programs that are approved by the Director and Deputy Director are then issued budgets, and a PM next solicits, reviews, and selects proposals for the program’s various components. Once funding recipients are selected, the PM then plays a supervisory role throughout the project’s duration. PMs may supervise more than one program at a time, and programs typically last between three and five years. While the PM can often take over a year to research and to design programs, performers typically receive funding around six months after proposals are submitted.

OWS, an interagency partnership between the DOD and the Department of Health and Human Services (HHS) created by the Trump administration in 2020 to facilitate and accelerate the development, manufacture, and distribution of COVID-19 vaccines, also used the portfolio approach. Organizationally, OWS functioned like an accelerated version of the DARPA model, selecting multiple firms to receive funding for vaccine research and development (Bonvillian, 2021). However, unlike DARPA, OWS guaranteed the purchase and distribution of the firms’ final product. These guaranteed purchases were instrumental in accelerating vaccine development, but also required that the government incur substantial financial risk. By March 2021, OWS had issued $18.2 billion in contracts for vaccine development and production, in addition to over $950 million for ancillary COVID-19 supplies (GAO, 2021; Congressional Research Service, 2021a). But OWS ultimately delivered vaccines at scale in unprecedented time—by January 2021, only eight months after the program’s launch, five of the six contracted vaccine manufacturers had begun commercial manufacturing, and by month’s end these companies had released 63.7 million doses of the vaccine.

3. People, Not Projects

The “people, not projects” approach focuses the selection process on scientists, rather than on specific projects. It is currently favored by a variety of non-government agencies. For example, The Arc Institute selects “Core Investigators” for renewable, eight-year appointments to operate fully funded labs. Investigators have complete autonomy over their research agenda and “pursue their very best research ideas in accordance with their own judgment, regardless of short-term risk” (ARC). The Howard Hughes Medical Institute (HHMI) adopts a similar approach: HHMI investigators receive renewable seven-year appointments that confer flexible funding for salary, lab staff, and equipment at their primary research institutions. Likewise, the MacArthur Award is a $650,000, “no strings attached” grant to “talented individuals who have shown extraordinary originality and dedication in their creative pursuits,” and does not require that recipients affiliate with any particular institution during their fellowship (MacArthur, 2022).
The “people, not projects” approach removes short-term pressures for recipients to reach specific goals within limited timeframes, and instead allows them substantial freedom to construct their own research agendas, enabling them to explore ideas that may not be funded by traditional project selection models. However, critics highlight that the approach, much like the peer review model, tends to favor already prominent researchers. It also often leaves them with little or no accountability for the work they produce (Ioannidis, 2011; Ricón, 2020).


Conclusion

The triangular partnership that Vannevar Bush envisioned between government, academia, and the private sector to fund US research and development lives on today in an ever-evolving form and at ever-increasing scale. As Chinese expenditures come to rival American investment, understanding the dynamics of R&D funding will be critical to efficiently allocating resources, and to developing new approaches that address some of the peer review model’s drawbacks, including its potential for sluggishness. Recent successes such as Operation Warp Speed provide cause for continued optimism that US innovation will continue as the preeminent source of scientific breakthroughs and widespread economic prosperity.


[1] Dollar amounts in this section are listed in constant 2012 $millions.

[2] Data from Wolfe (2021) is extracted from the 2019 Business Enterprise Research and Development Survey and dollar amounts carry minor discrepancies with data used in Figures 3 and 4.

[3] Data from Gibbons (2021) is extracted from the 2019 Higher Education Research and Development Survey and dollar amounts carry minor discrepancies with data used in Figures 3 and 4.

[4] The R&D budget for the Department of Defense discussed here refers to funding appropriated in Title IV, “Research, Development, Test, and Evaluation” (RDT&E). For consistency, we refer to “RDT&E” as “R&D” throughout this section.

[5] The DOD’s total R&D budget in Figure 5 includes funding for all budget activities (6.1-6.8) under Title IV. The OMB does not count 6.7 and 6.8 as R&D. For this and other reasons, the total R&D amount discussed in this section does not align with total federal R&D investment figures used elsewhere in this report.

[6] The newest of the NIH’s programs, the Advanced Research Projects Agency-Health, which aims to undertake “agile, risky, transformational biomedical research projects,” is using a DARPA-like portfolio model to fund projects rather than the traditional NIH peer review process in order to better “establish a culture of championing innovative ideas” (AAAS, 2021; NIH, 2021).