This paper evaluates the shift towards increasingly protectionist and nationalist policies carried out by the past two presidential administrations. In this paper, Michael Strain argues that the turn to such economic policies has not only been ineffective by its own standards, failing to raise employment and reduce America’s reliance on China, but also is more fundamentally misguided. Strain makes three central arguments about the efficacy of these increasingly insular economic policies.
1. Protectionism Has Not Met Its Own Goals
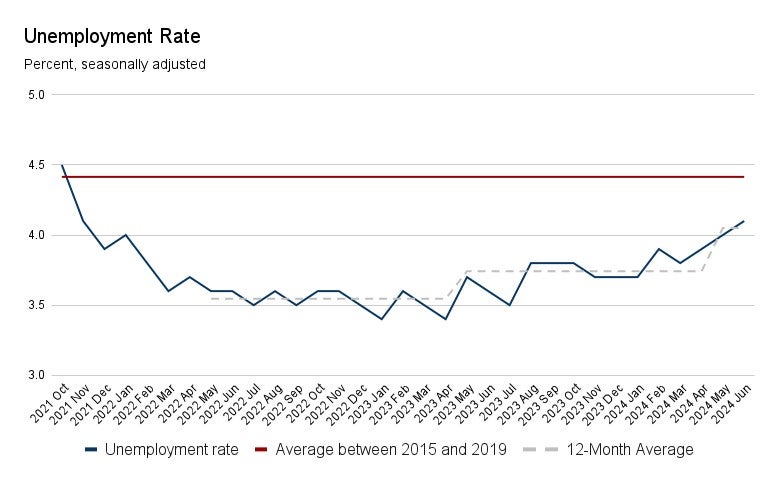
The 2018-2019 tariffs likely reduced manufacturing employment. Increased prices of intermediary goods and retaliatory tariffs outweighed the protection from import competition, leading to net reductions in manufacturing employment. Research shows that industries more exposed to tariff increases experienced greater declines in employment. Beyond the manufacturing sector, counties with higher exposure to tariffs experienced higher unemployment rates.
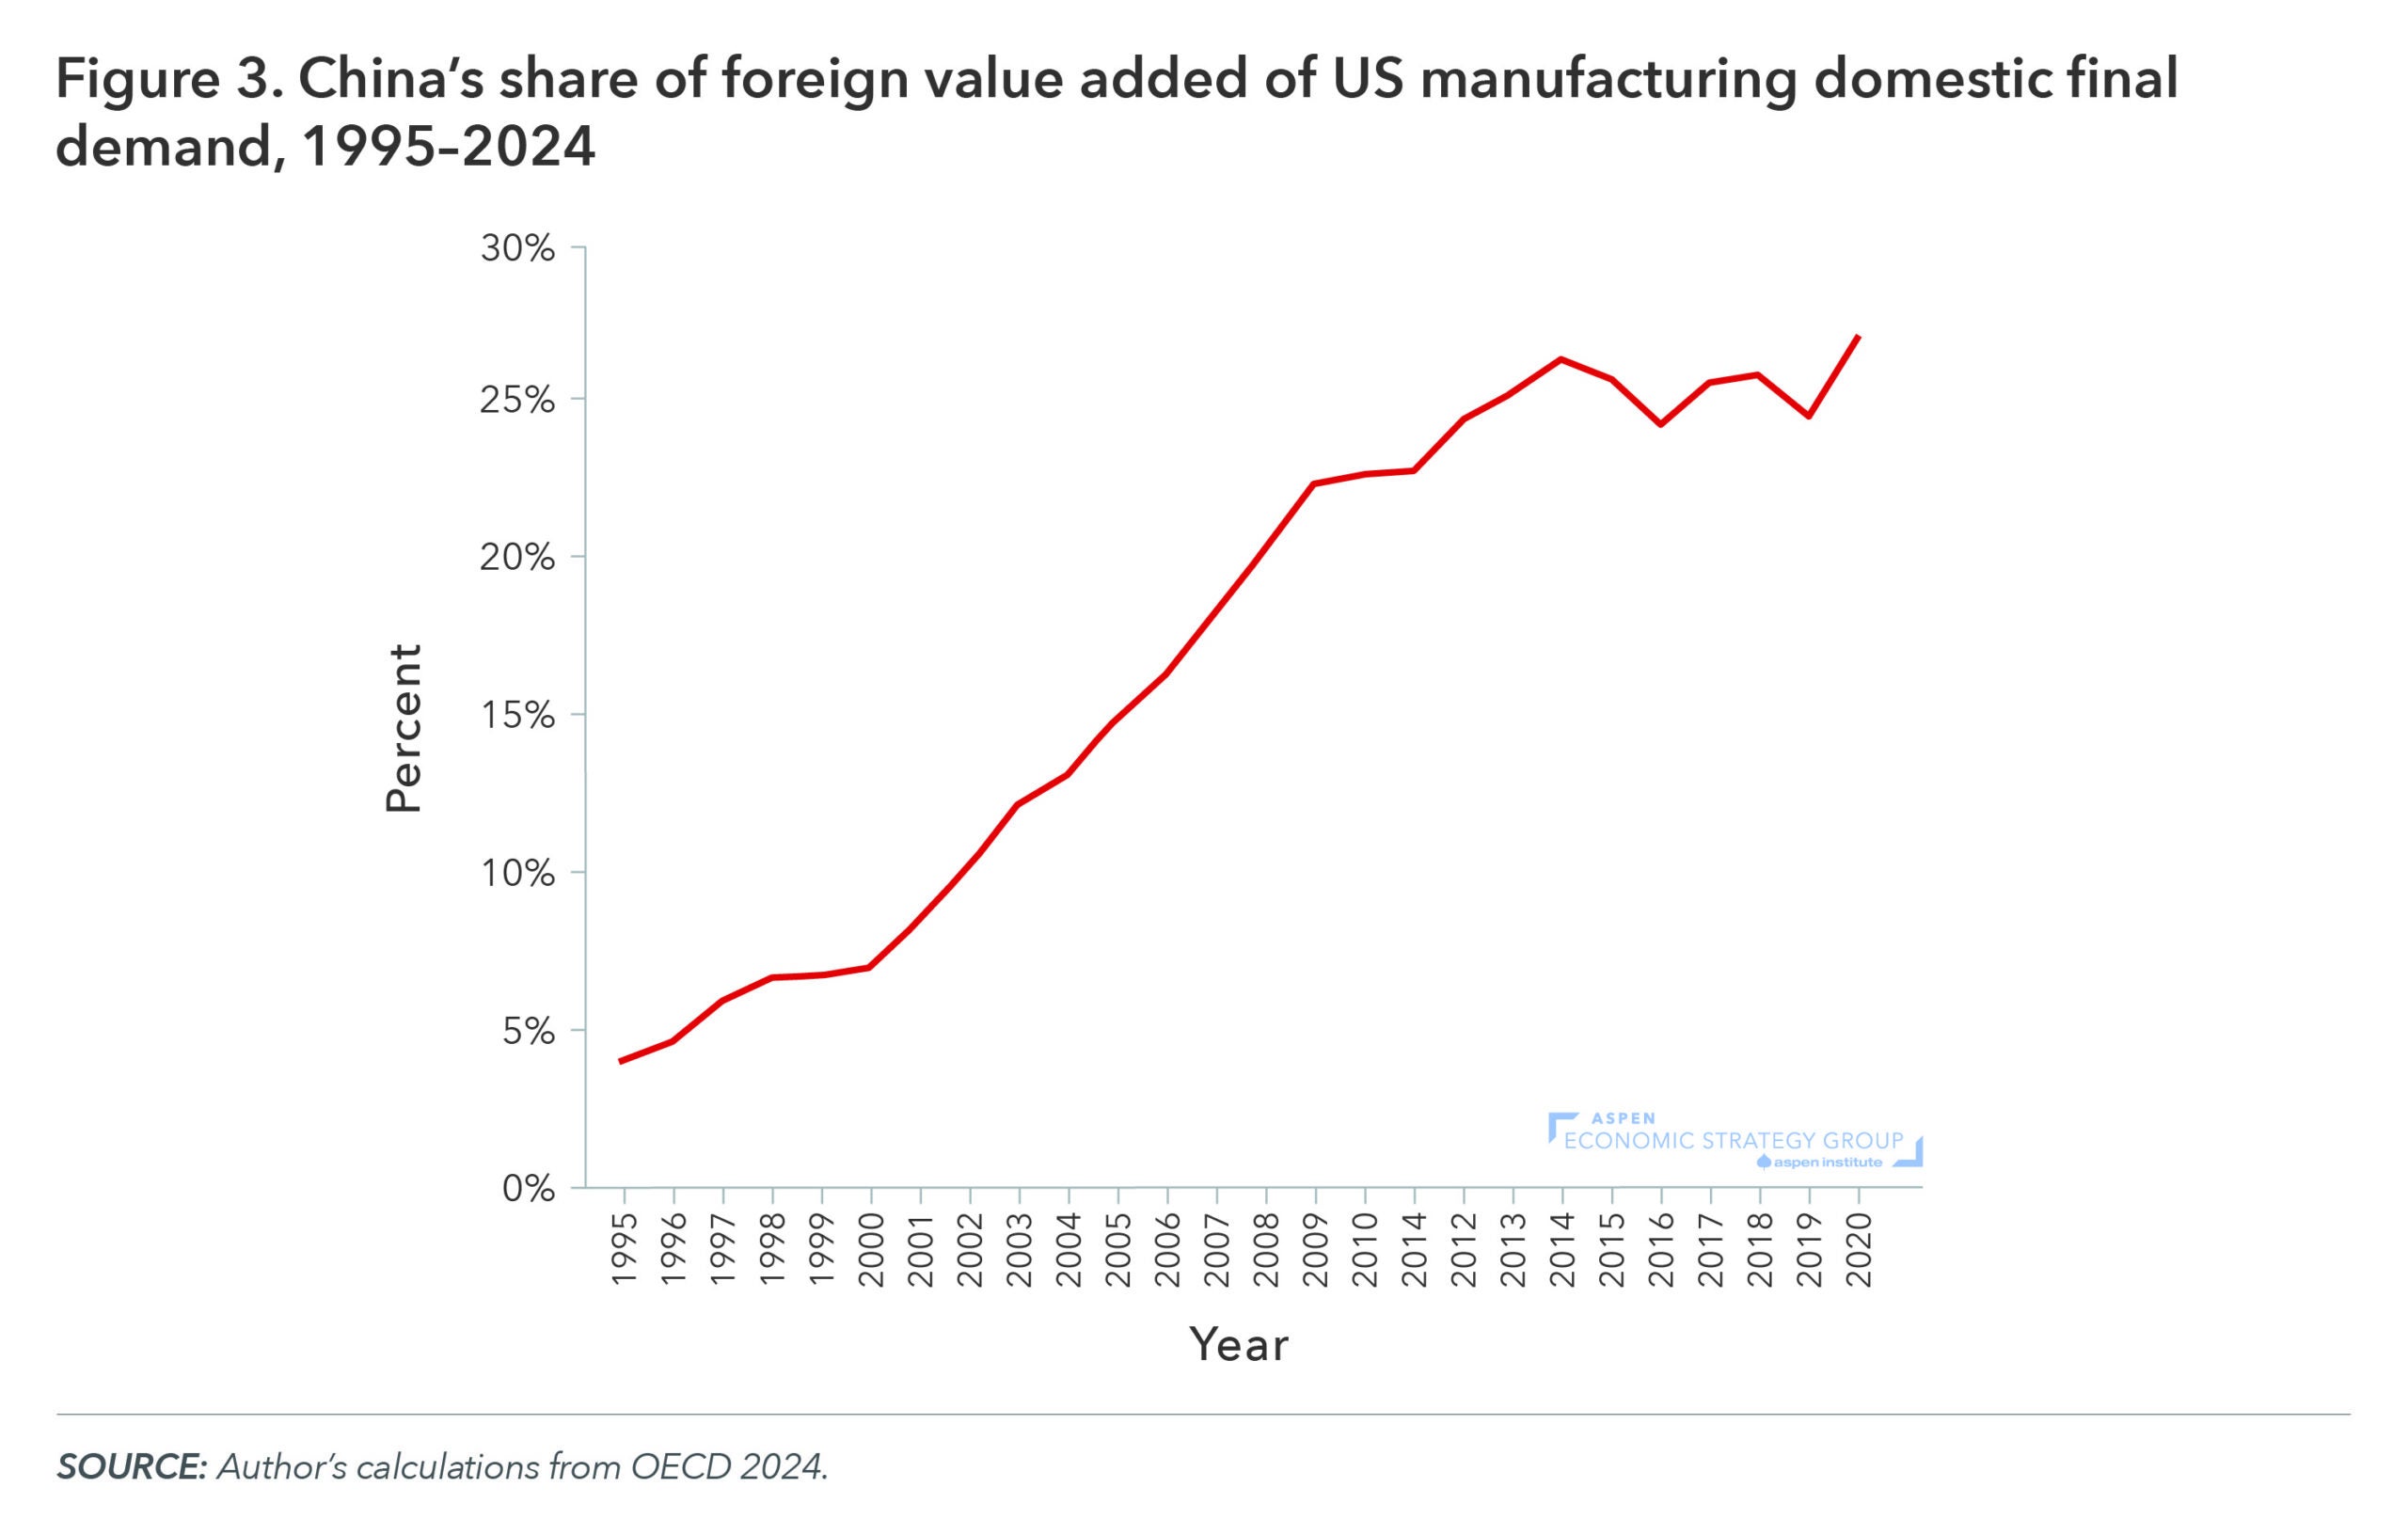
Post-2017 protectionism failed to reduce the US trade deficit, despite it being a primary goal of the Trump administration. The current account deficit rose from $85.5 billion when President Trump took office to $180 billion at the end of his term. Furthermore, many Chinese manufacturers rerouted goods through other nations, such as Mexico and Vietnam, to evade US tariffs. Thus, China’s “value-added” to US domestic final demand rose over the period, making the policy unsuccessful in reducing US reliance on Chinese imports.
2. Protectionism is Wrongheaded
Strain argues that the goal of significantly increasing manufacturing employment is inherently misguided, as the decline in US manufacturing jobs largely reflects a productivity increase. Although these productivity gains have been accompanied by disruptions, they also have created new opportunities. Policymakers should focus on doing more to help affected workers access these new opportunities rather than trying to turn back the clock.
Strain notes that trade creates both winners and losers by affecting the composition of jobs in the labor market, but should not affect the aggregate level of employment. Trade between nations allows a given country to specialize in the production of those goods and services for which that nation has a comparative advantage, and to trade to receive and consume other goods and services. However, trade is not about jobs, per se. Rather, trade is about productivity, wages, and consumption.
3. Industrial Policy is (almost) Always Bad Policy
Strain makes a case against the recent turn to policies that favor specific domestic industries, as most of these policy efforts have multiple, competing objectives and are unlikely to yield public benefits that exceed the public costs. Instead, to advance American innovation, the government should invest public funds in basic research and infrastructure. The goal of this investment should not be to create manufacturing jobs and should not target specific products or sectors, but should instead be focused on increasing innovation and dynamism more broadly, which will in turn increase productivity and wage growth.
Suggested Citation: Strain, Michael R., 2024. “Protectionism is Failing and Wrongheaded: An Evaluation of the Post-2017 Shift toward Trade Wars and Industrial Policy” In Strengthening America’s Economic Dynamism, edited by Melissa S. Kearney and Luke Pardue. Washington, DC: Aspen Institute. https://doi.org/10.5281/zenodo.13974079.