The past year has been one marked by several significant swings in the labor market. It featured strong (possibly, immigration-fueled) growth in the labor market at the start, a sharp rise in the unemployment rate that fueled speculation of an incoming recession over the summer, and Hurricane-affected data to round out the fall. After all these moves, where did the job market end in 2024 compared to where it began – and where might it be headed in 2025?
Looking through November, the job market is rounding out 2024 in a cool – but still healthy – spot. Job growth has slowed, and the unemployment rate has risen, but the US avoided both a more significant slowdown in employment growth and a steeper rise in the unemployment rate that could have brought on a recession. Notwithstanding the enormous policy uncertainty in the coming year, economists generally predict a much calmer year in the labor market data ahead.
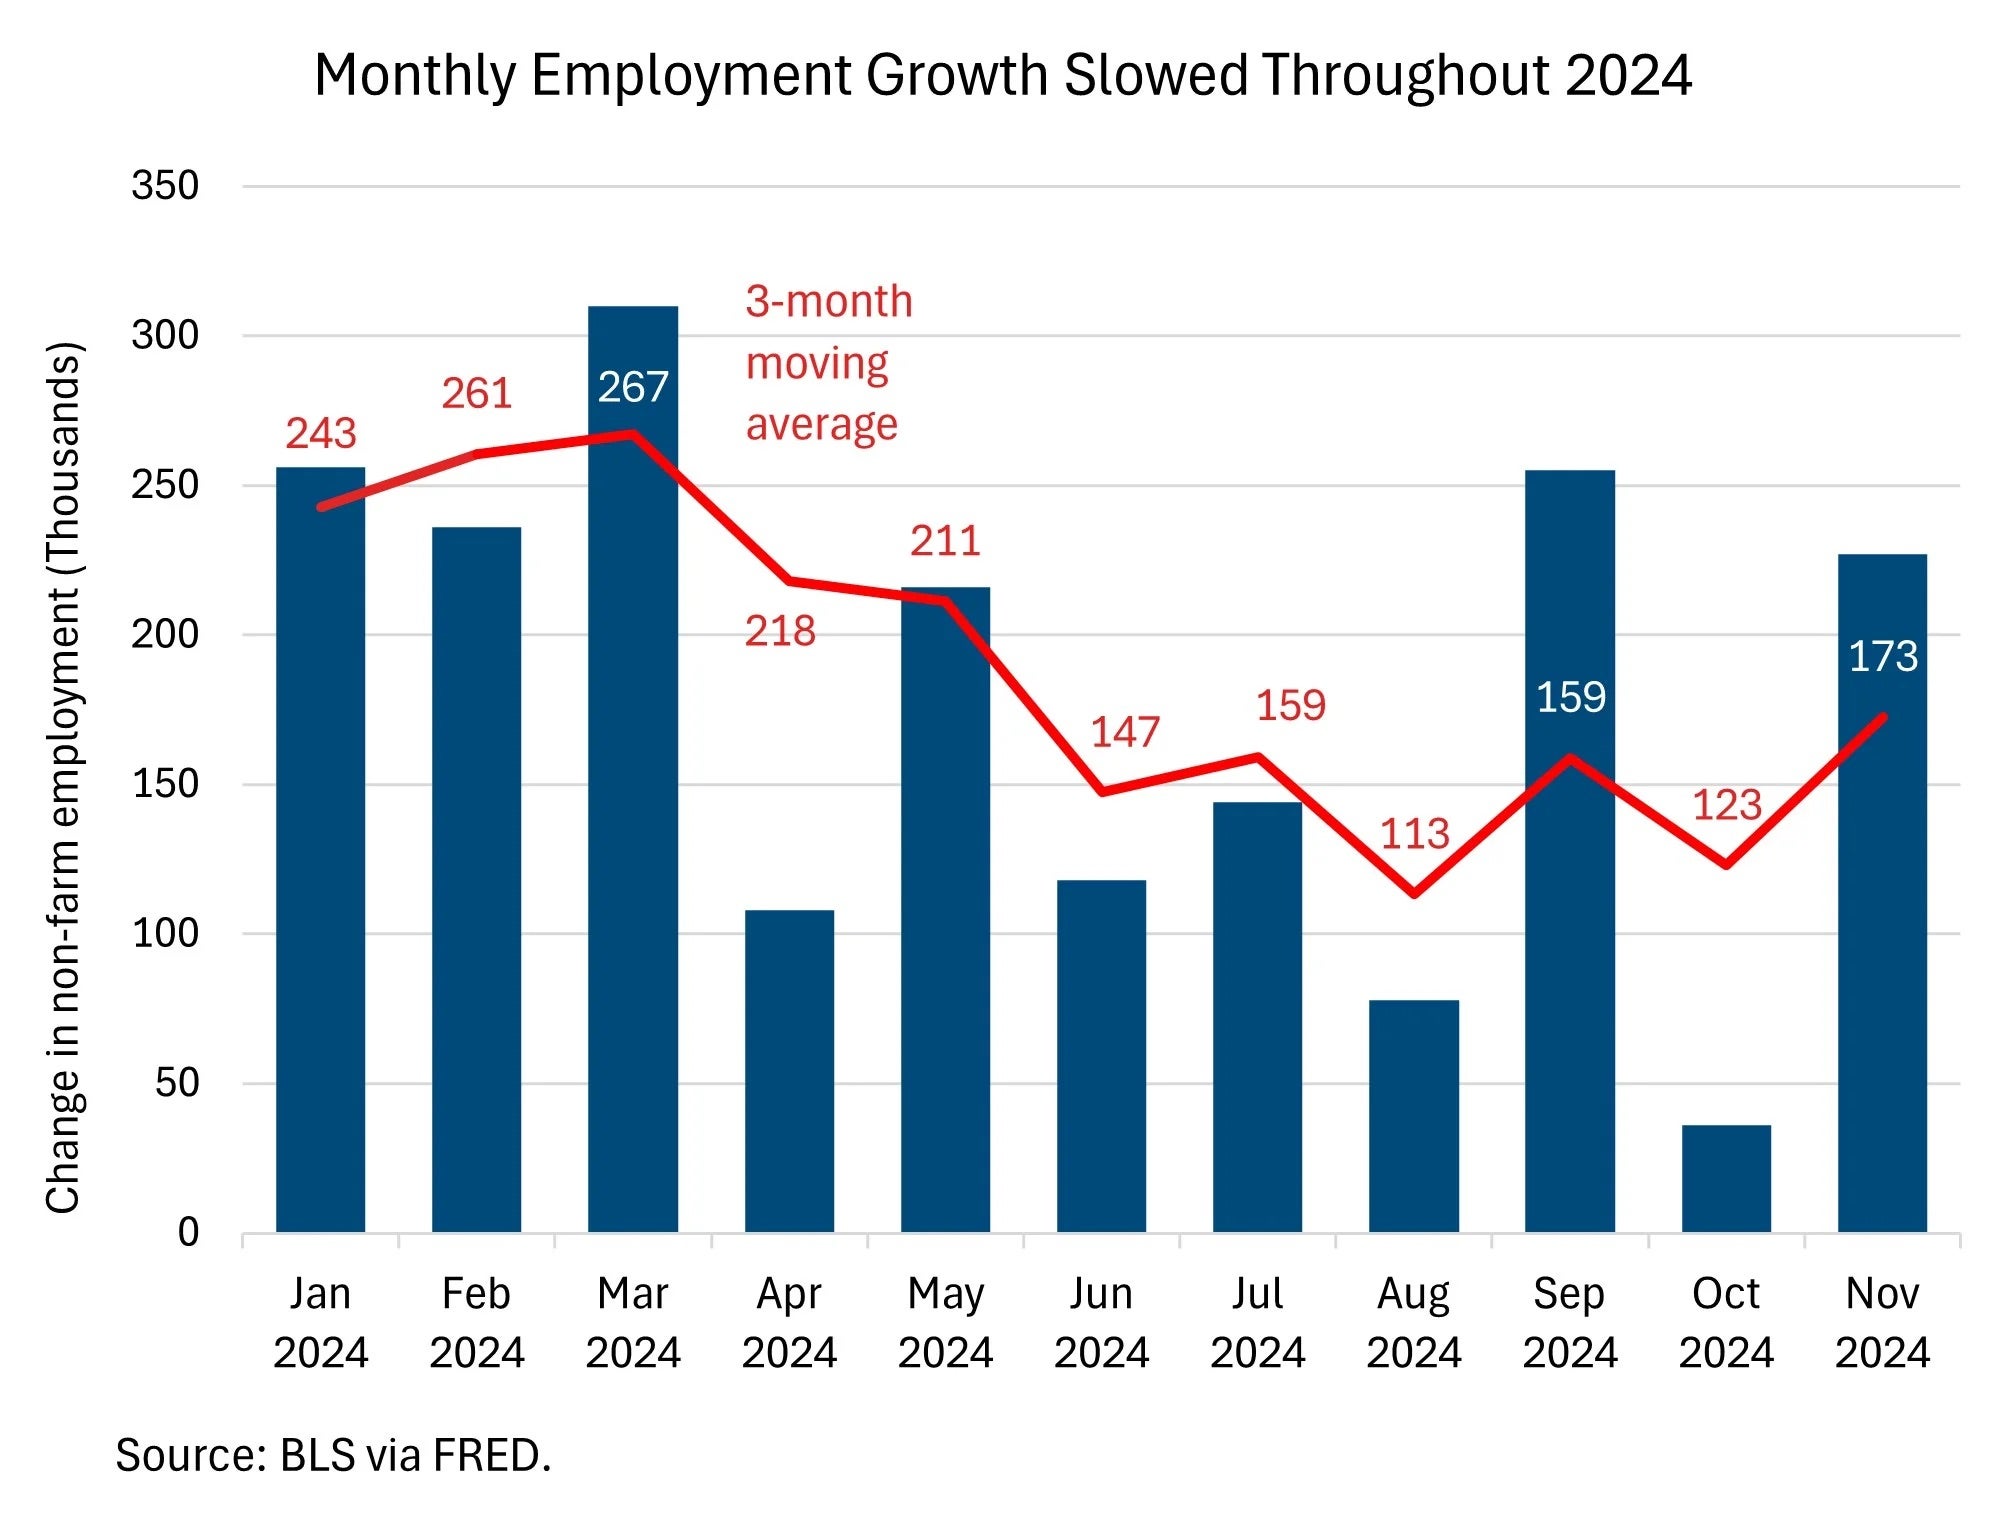
1. Monthly Employment Growth Slowed Throughout 2024
Although the monthly job gains in November returned to levels similar to those seen in January, the three month average of employment growth – which cuts through much of the noise in monthly data – tells the story of a labor market that has slowed considerably throughout the year. In January, the three month average stood at 243,000 jobs added per month, a pace that has fallen to 173,000 in November.
The question for 2025 will be: what pace of job growth can the economy sustain without overheating? That answer depends in part on the rate of labor force growth (which has stalled since the pandemic) but looking historically, the US economy averaged 166,000 jobs added per month across 2019 without generating inflation – just slightly below where we are now.
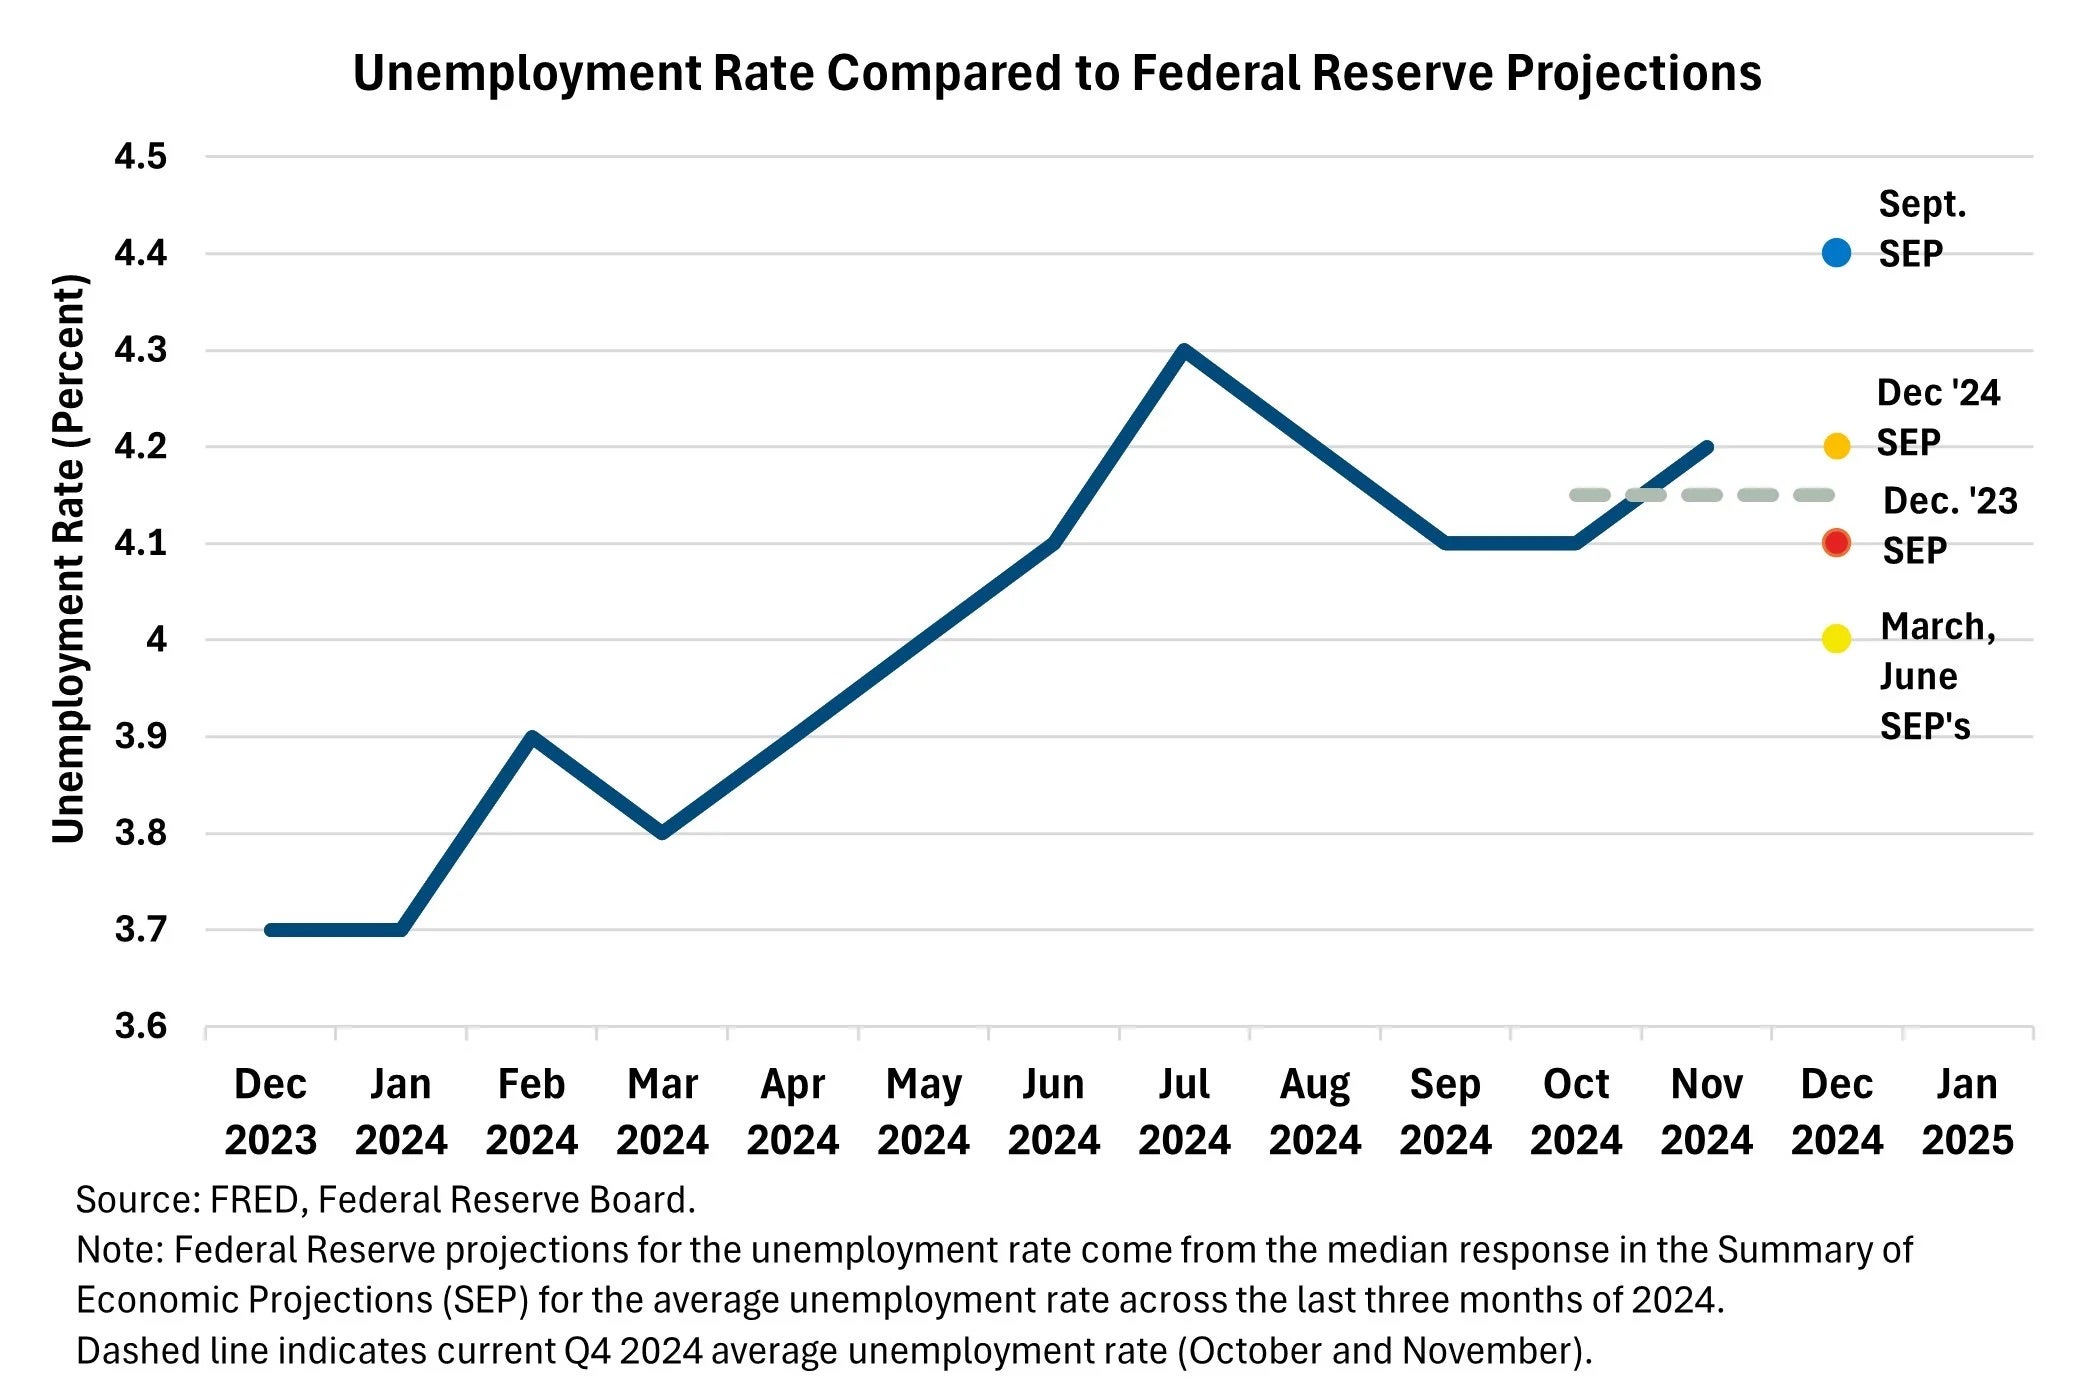
 2. Despite heightened uncertainty, the labor market ended up close to where Fed officials predicted in December 2023.
A second aspect of the labor market slowdown in 2024 was the gradual rise in the unemployment rate across the year, from 3.7% in January to 4.2% in November. The increase in the unemployment rate garnered much attention throughout the year, particularly after it triggered the Sahm Rule recession indicator in July. But, despite all the focus, the unemployment rate in November is about where Federal Reserve officials forecast it would be in their Summary of Economic Projections (SEP) from December of last year. Currently, the unemployment rate is averaging 4.15% in Q4 2024 (excluding December), compared to the median Fed projection last December of 4.1%. This means that, as early as last year, monetary policy officials believed such an increase in the unemployment rate was consistent with a gradually cooling – but not recessionary – economic environment.
A second major question looming in 2025 is how much further the unemployment rate will rise. If Federal Reserve projections from this December can serve as a guide for next year, the answer is “not much.” The median projection for the unemployment rate across Q4 2025 is 4.3%. Of course, that projection comes with the caveats that it assumes each participant’s “appropriate path” of monetary policy and is surrounded by a large degree of uncertainty with respect to policy outside of the Fed’s control, but it seems that Fed officials believe we are currently in a healthy long-run environment with the unemployment rate holding steady.