Archives: Publications
These are AIESG Publications
Figure 2: Federal deficit and surplus, 1963-2053
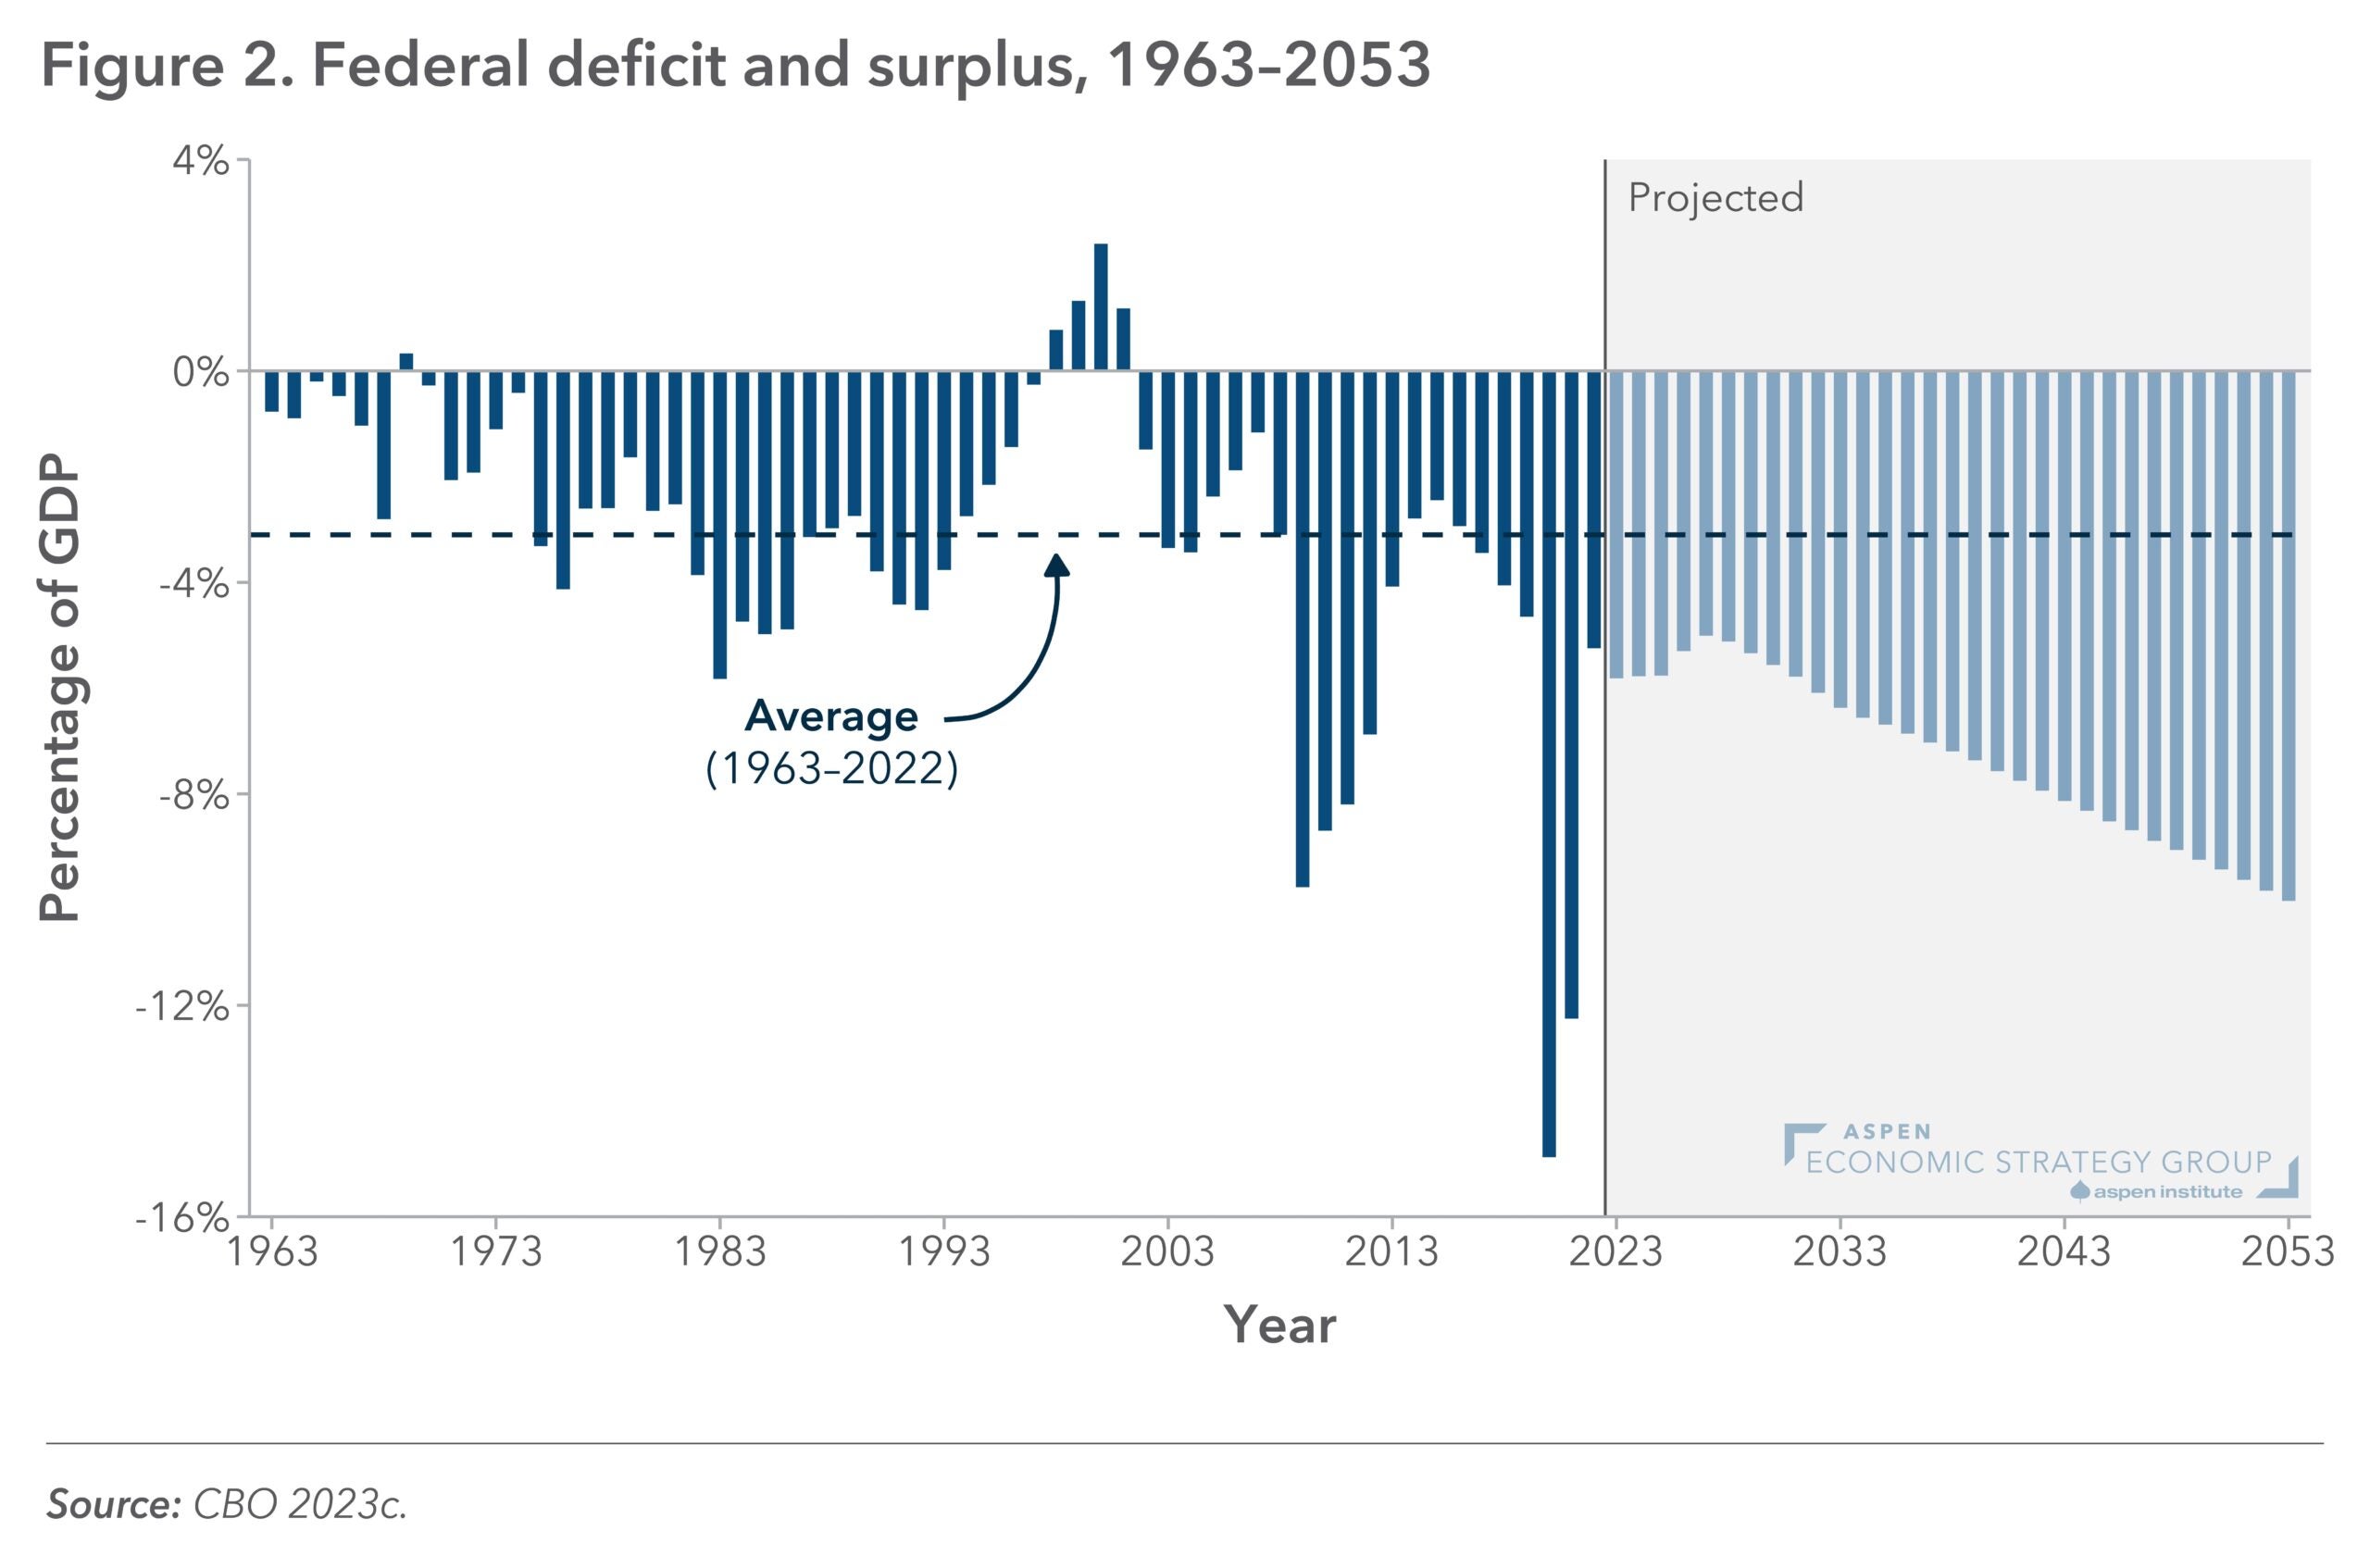
Figure 4: Total US Retail Prescription-Drug Spending, 2017
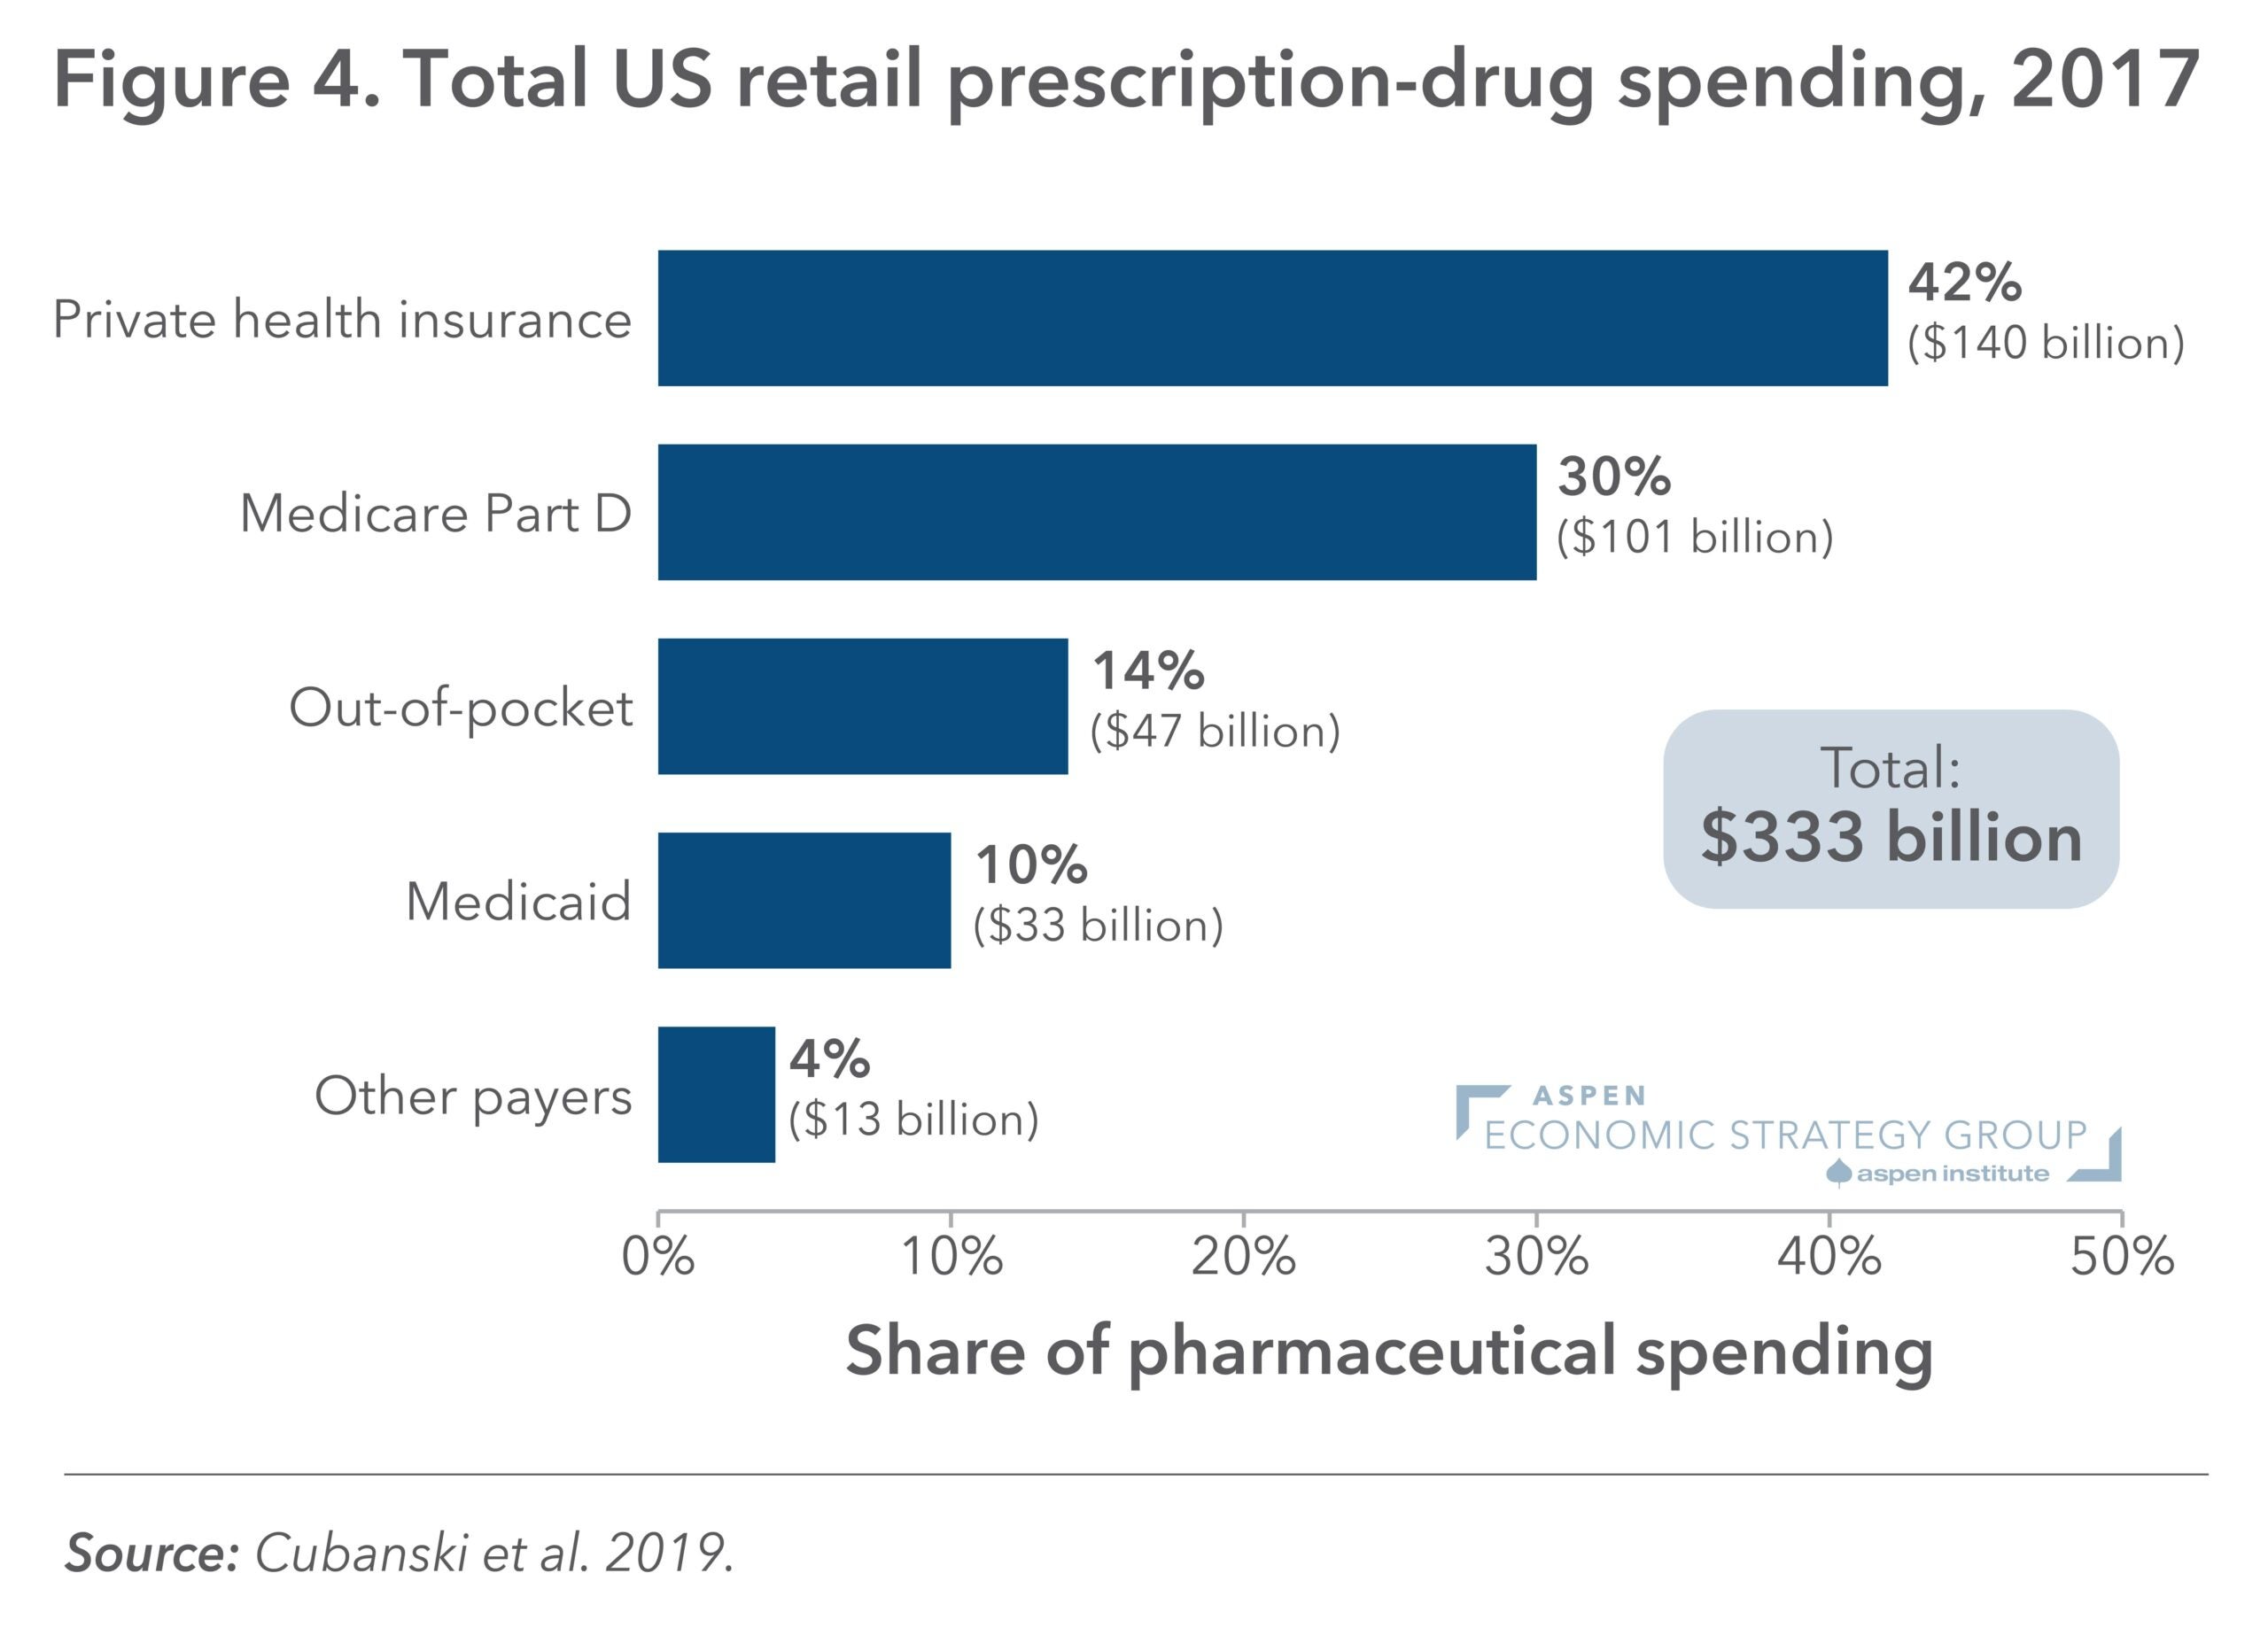
Figure 3: Share of US population 65 and older, 2000-2053
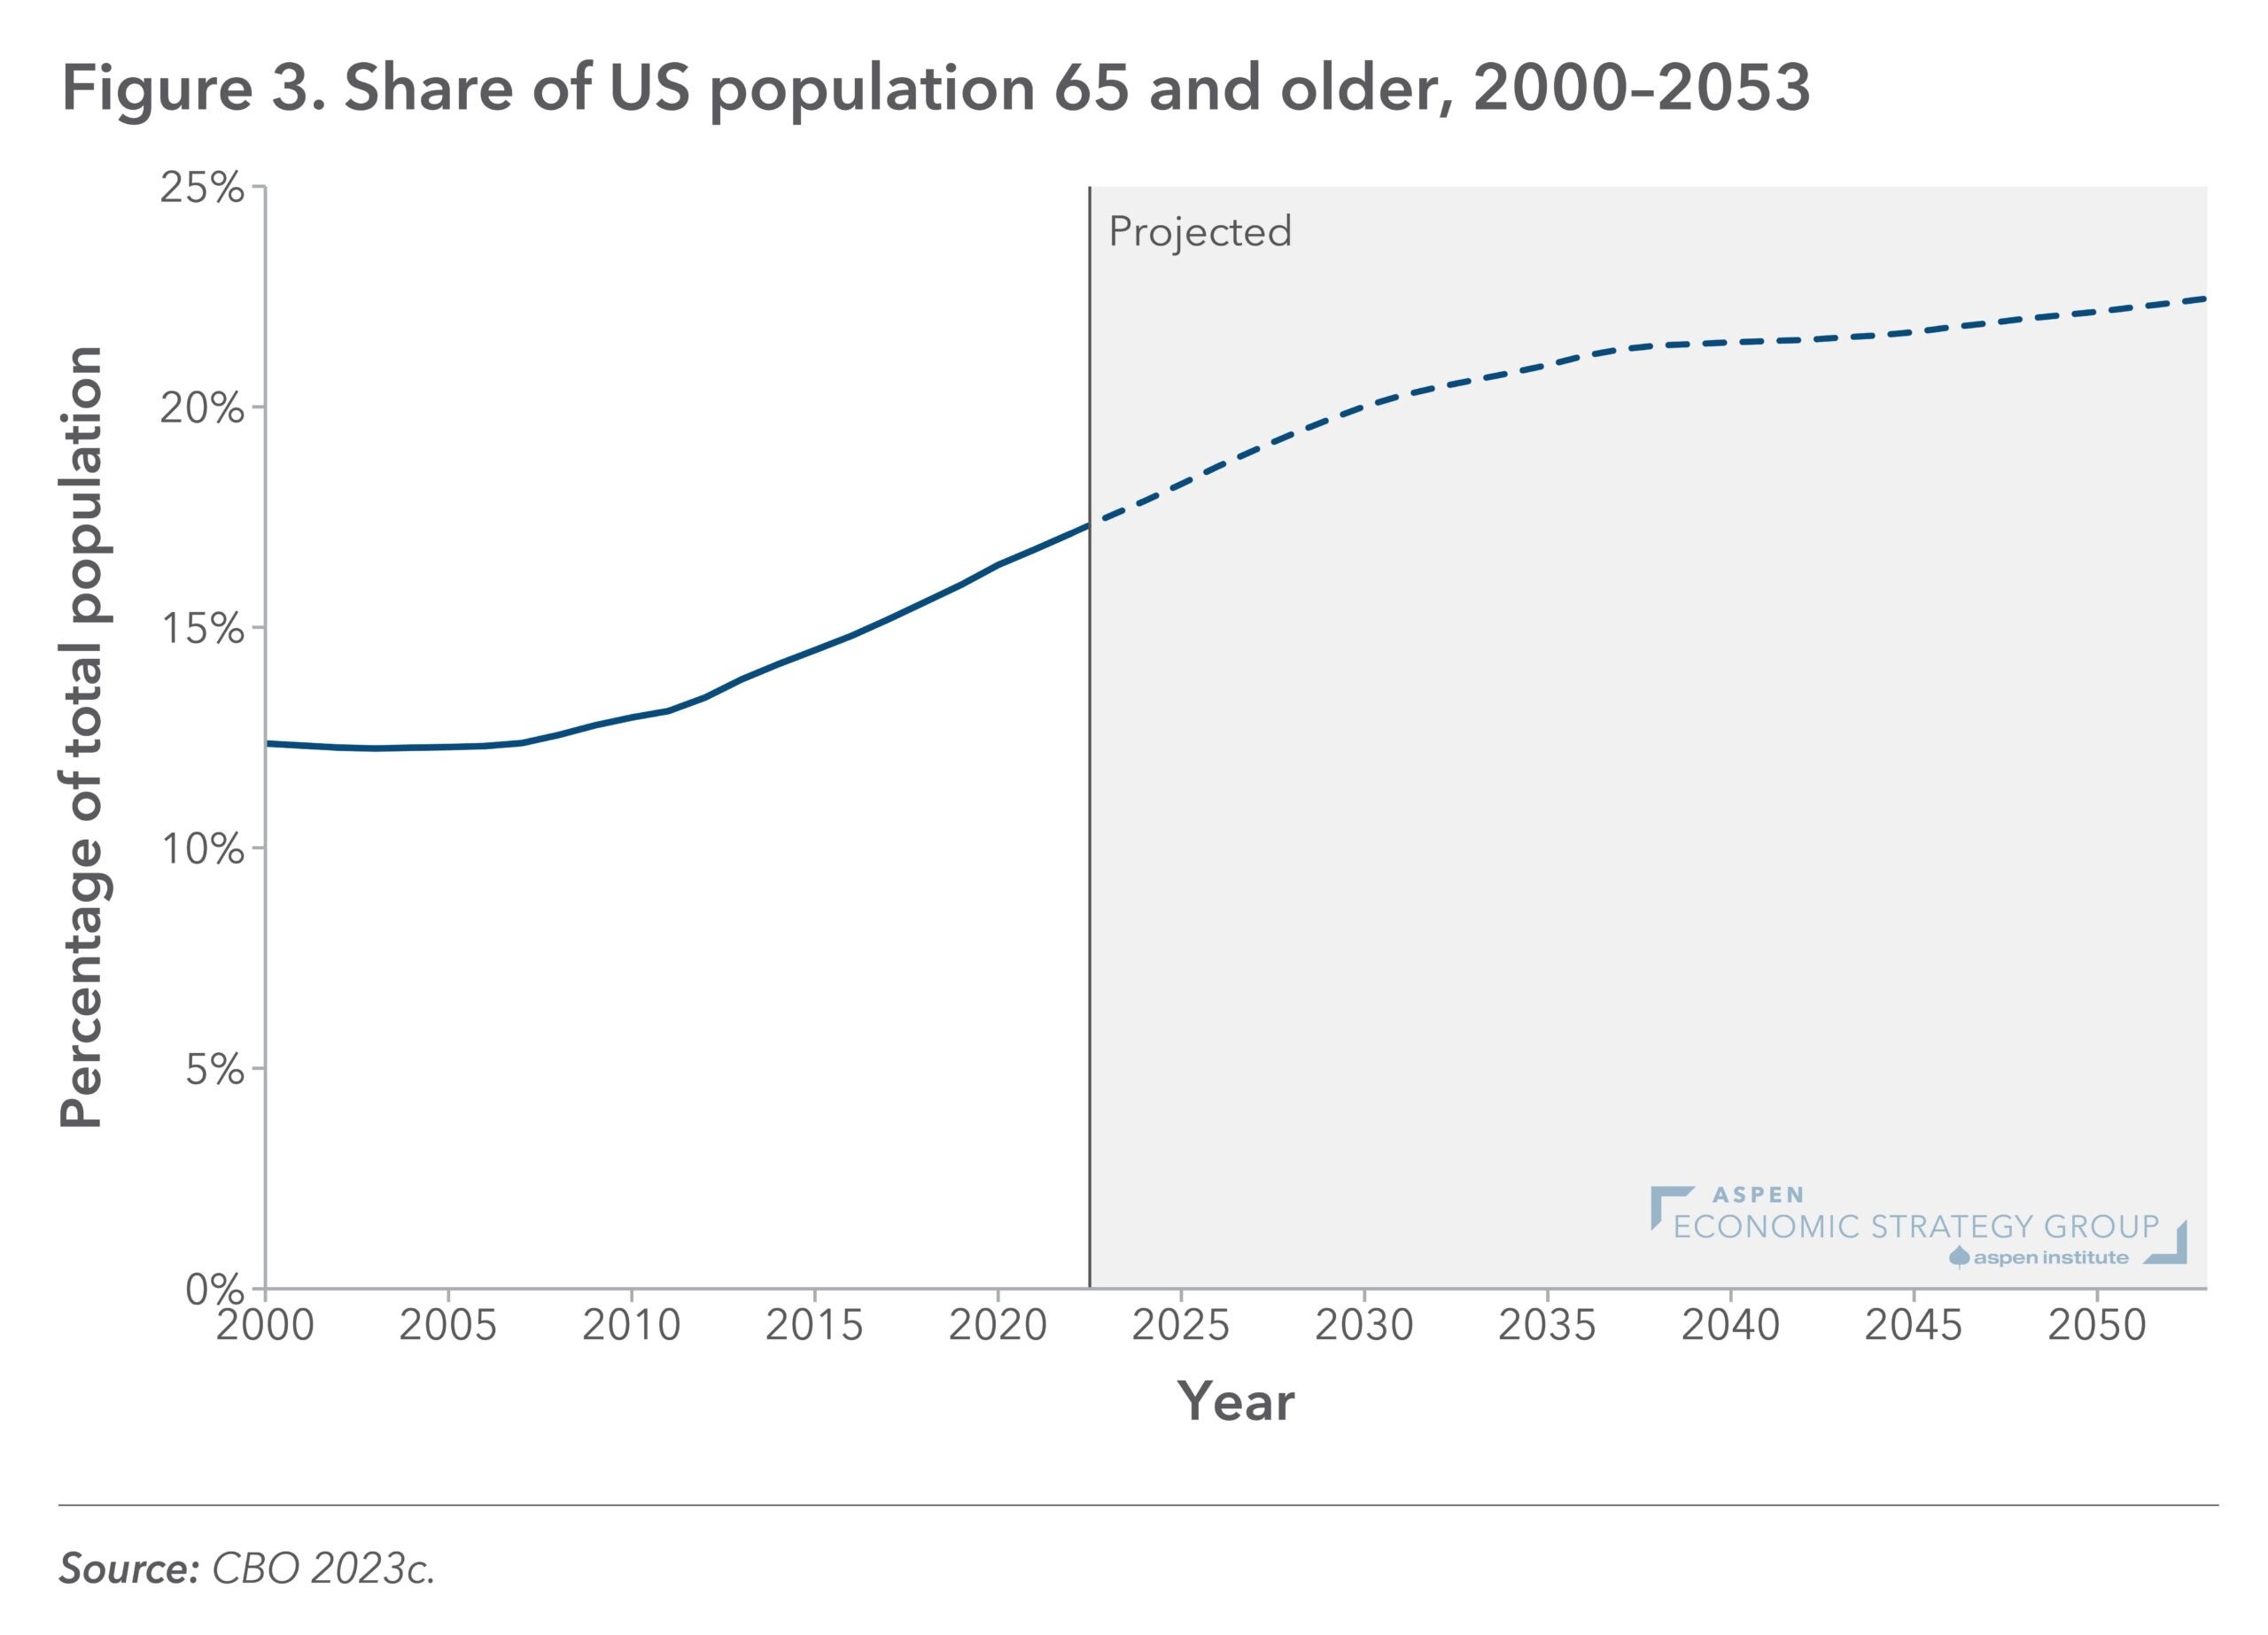
Figure 4: Federal, State/Local, and Private Philanthropic Spending Per Capita, by Age Group, 2019
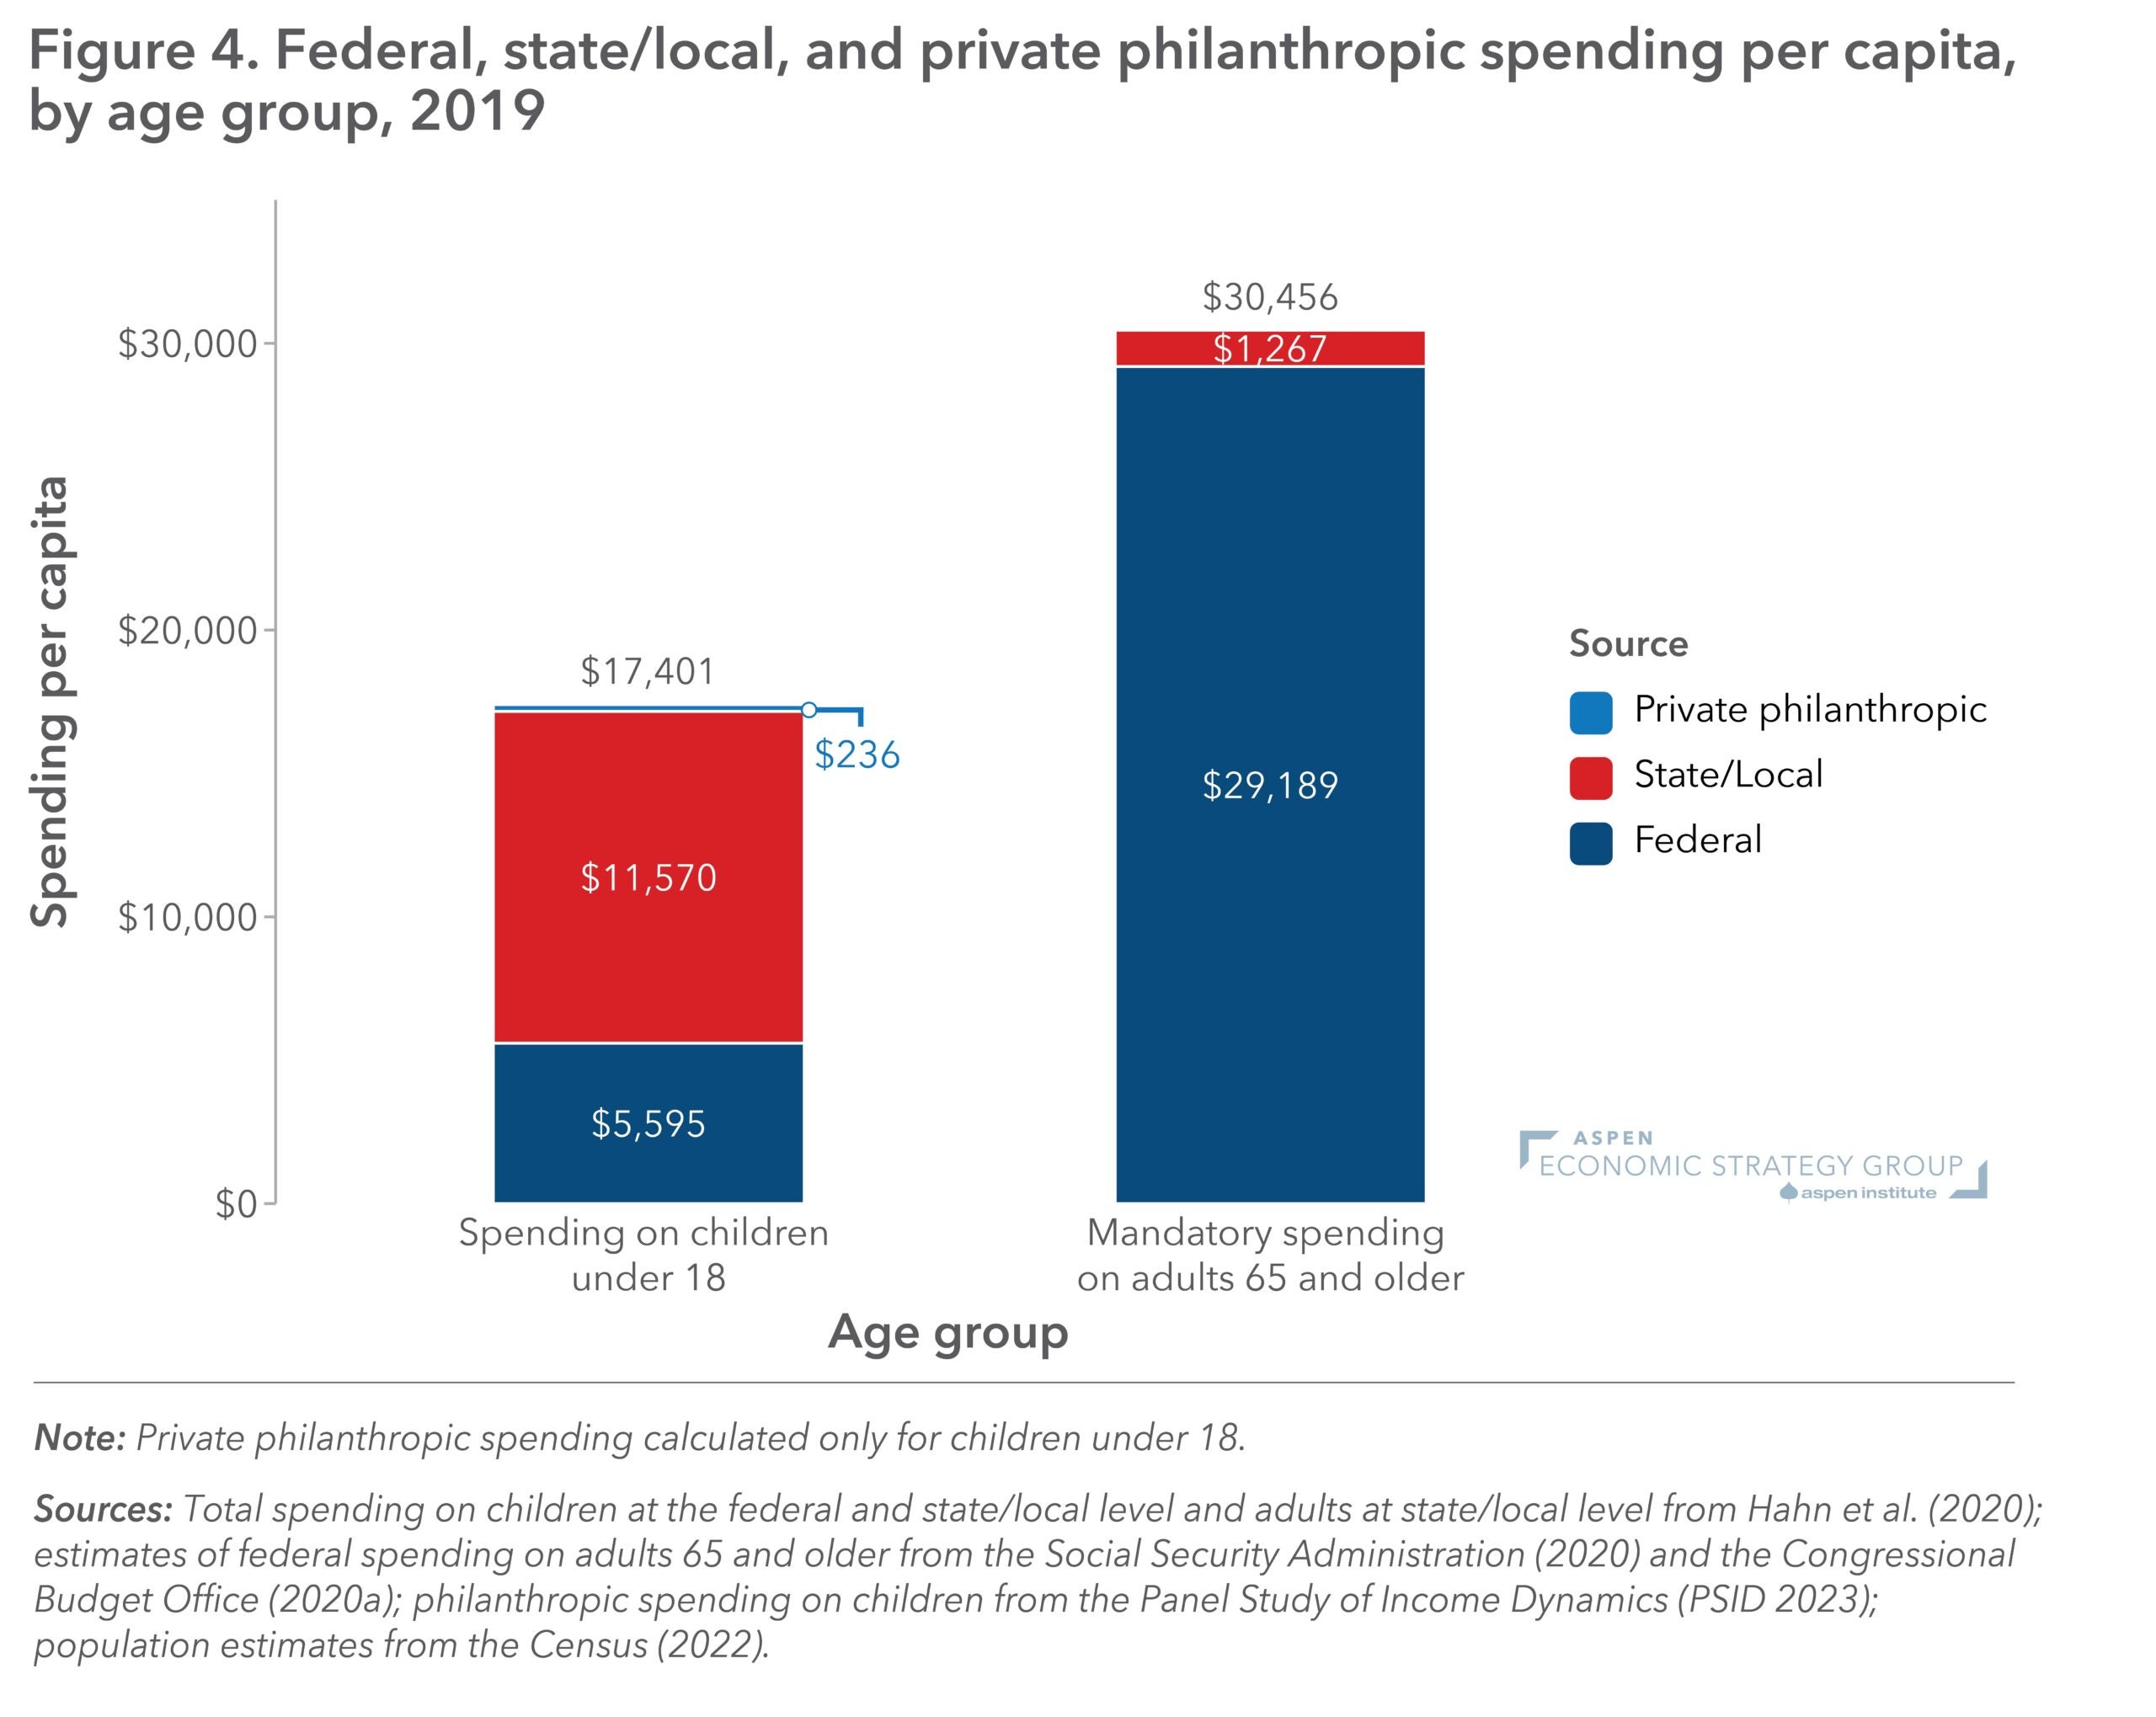
Figure 4: Business Wealth as a Component of Top Wealth Portfolios
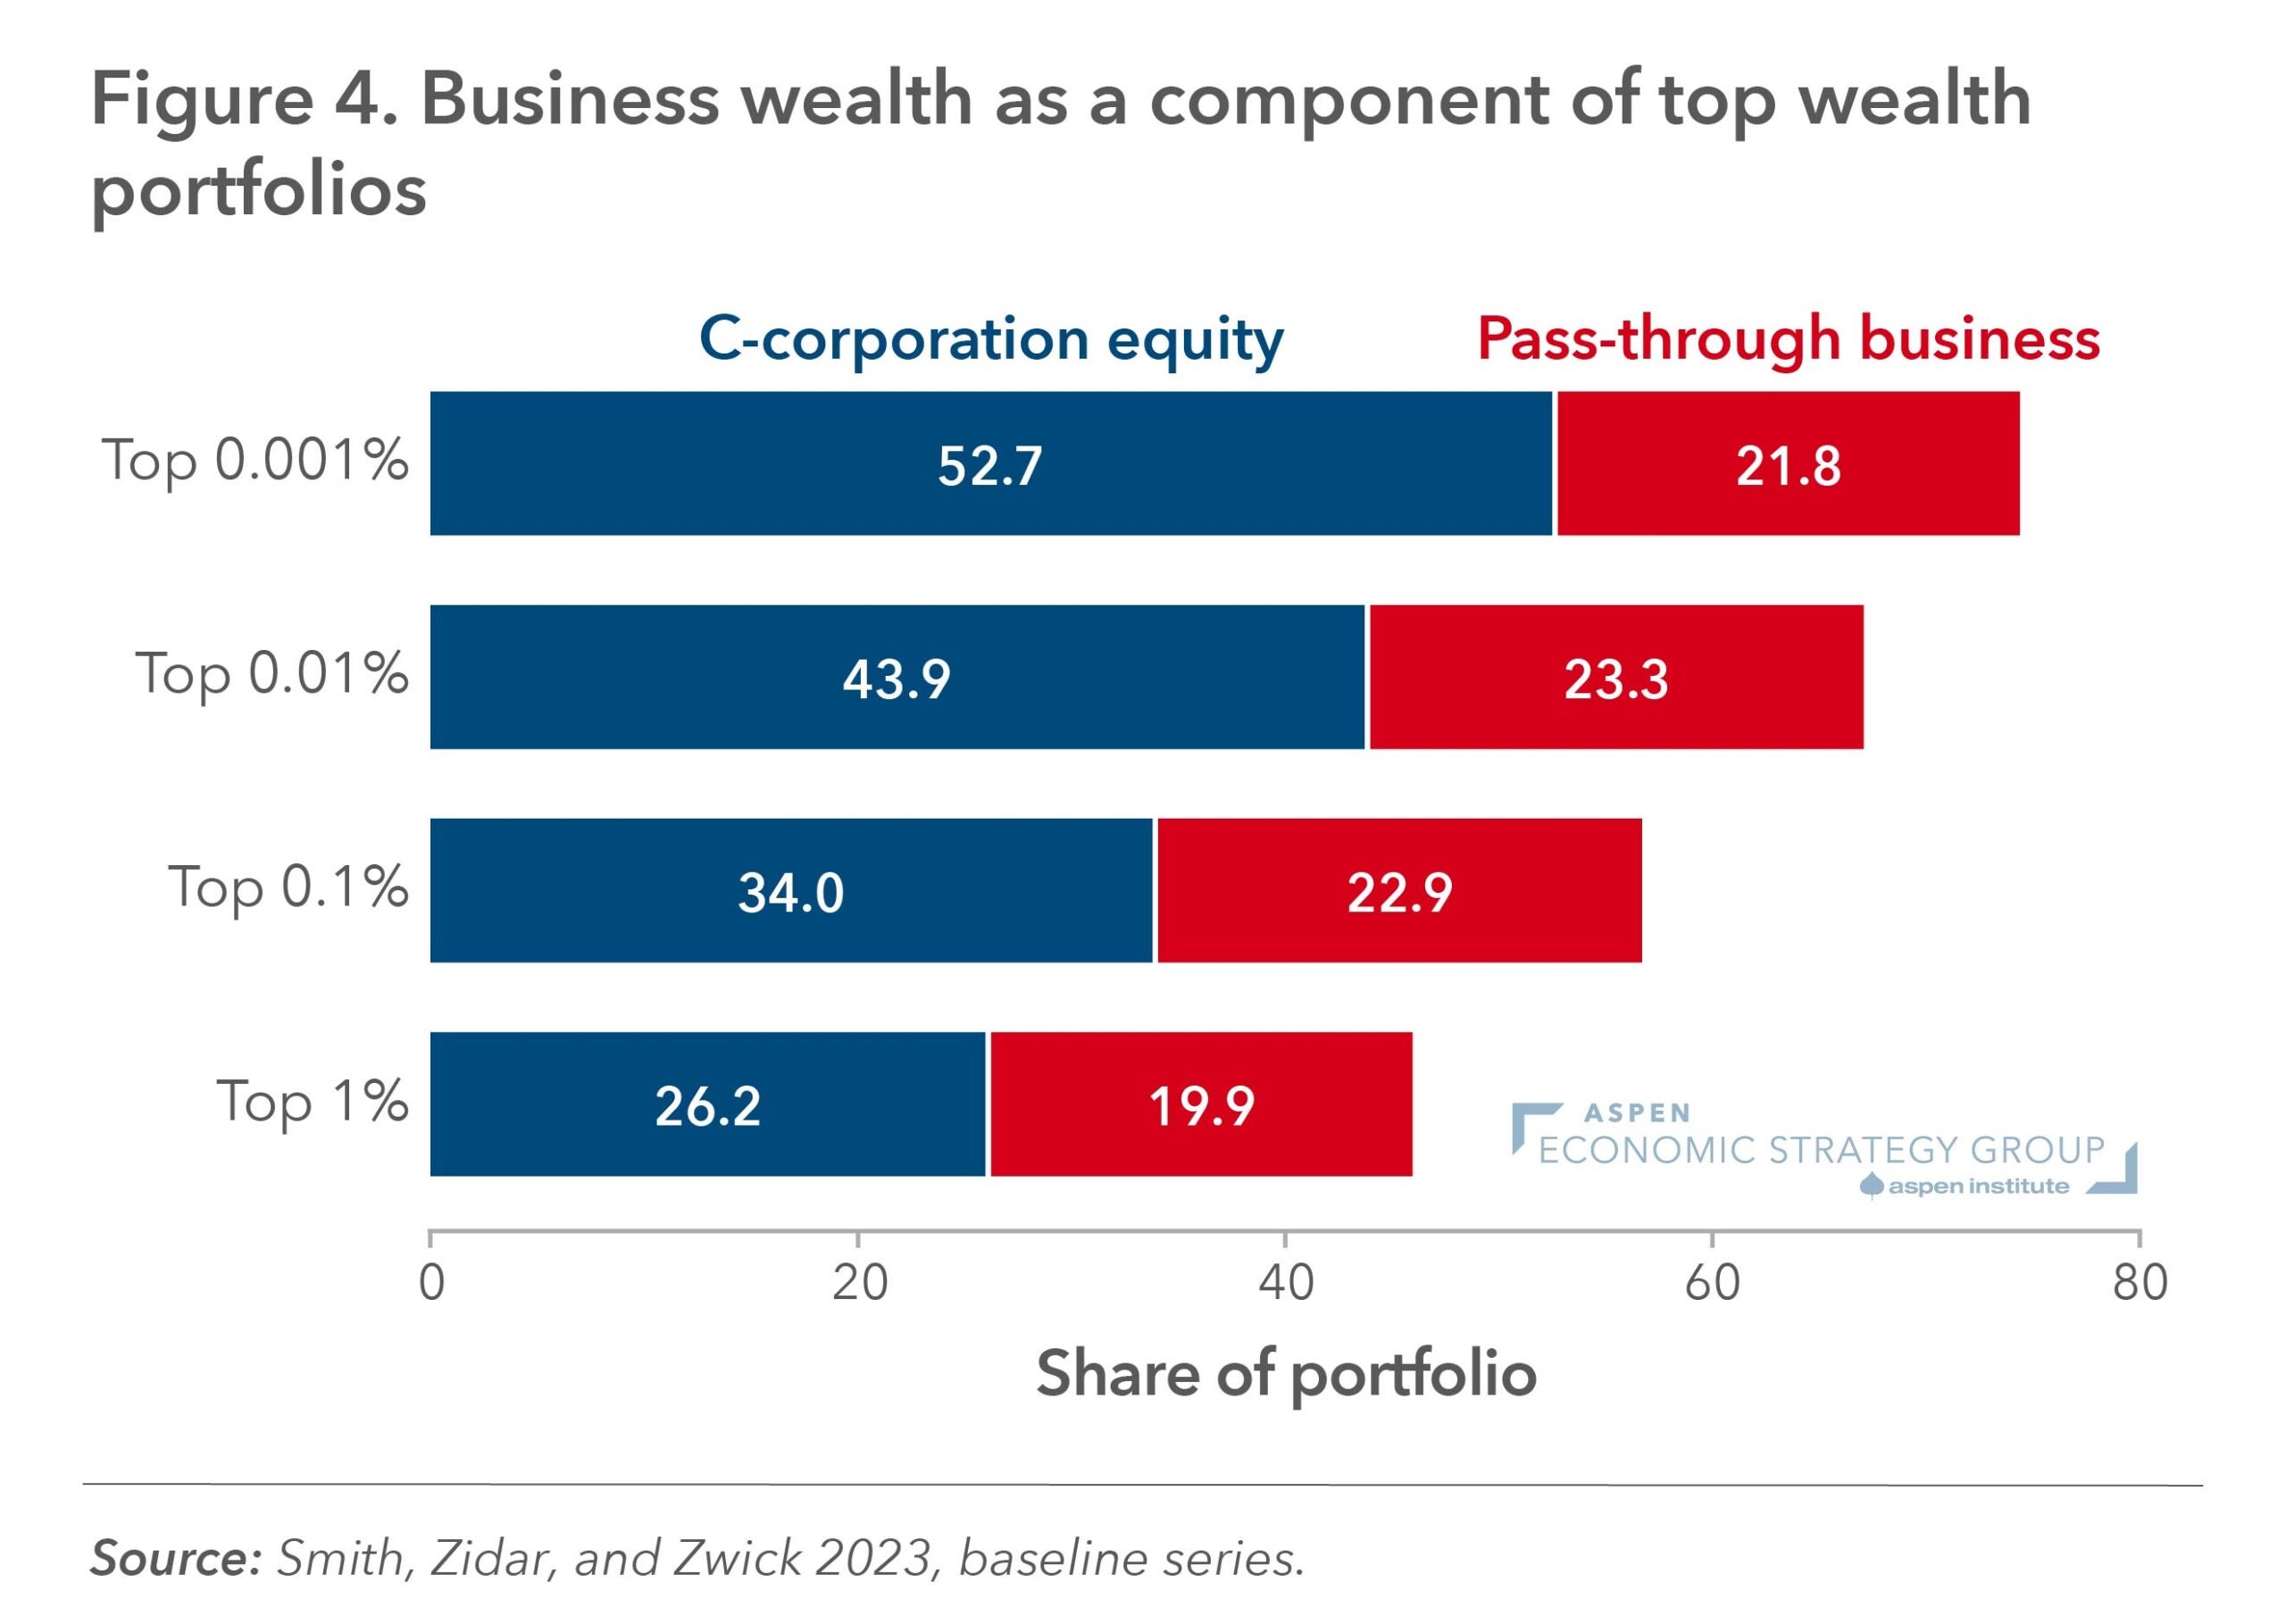
Figure 2: Share of Federal Outlays by Category, 2019
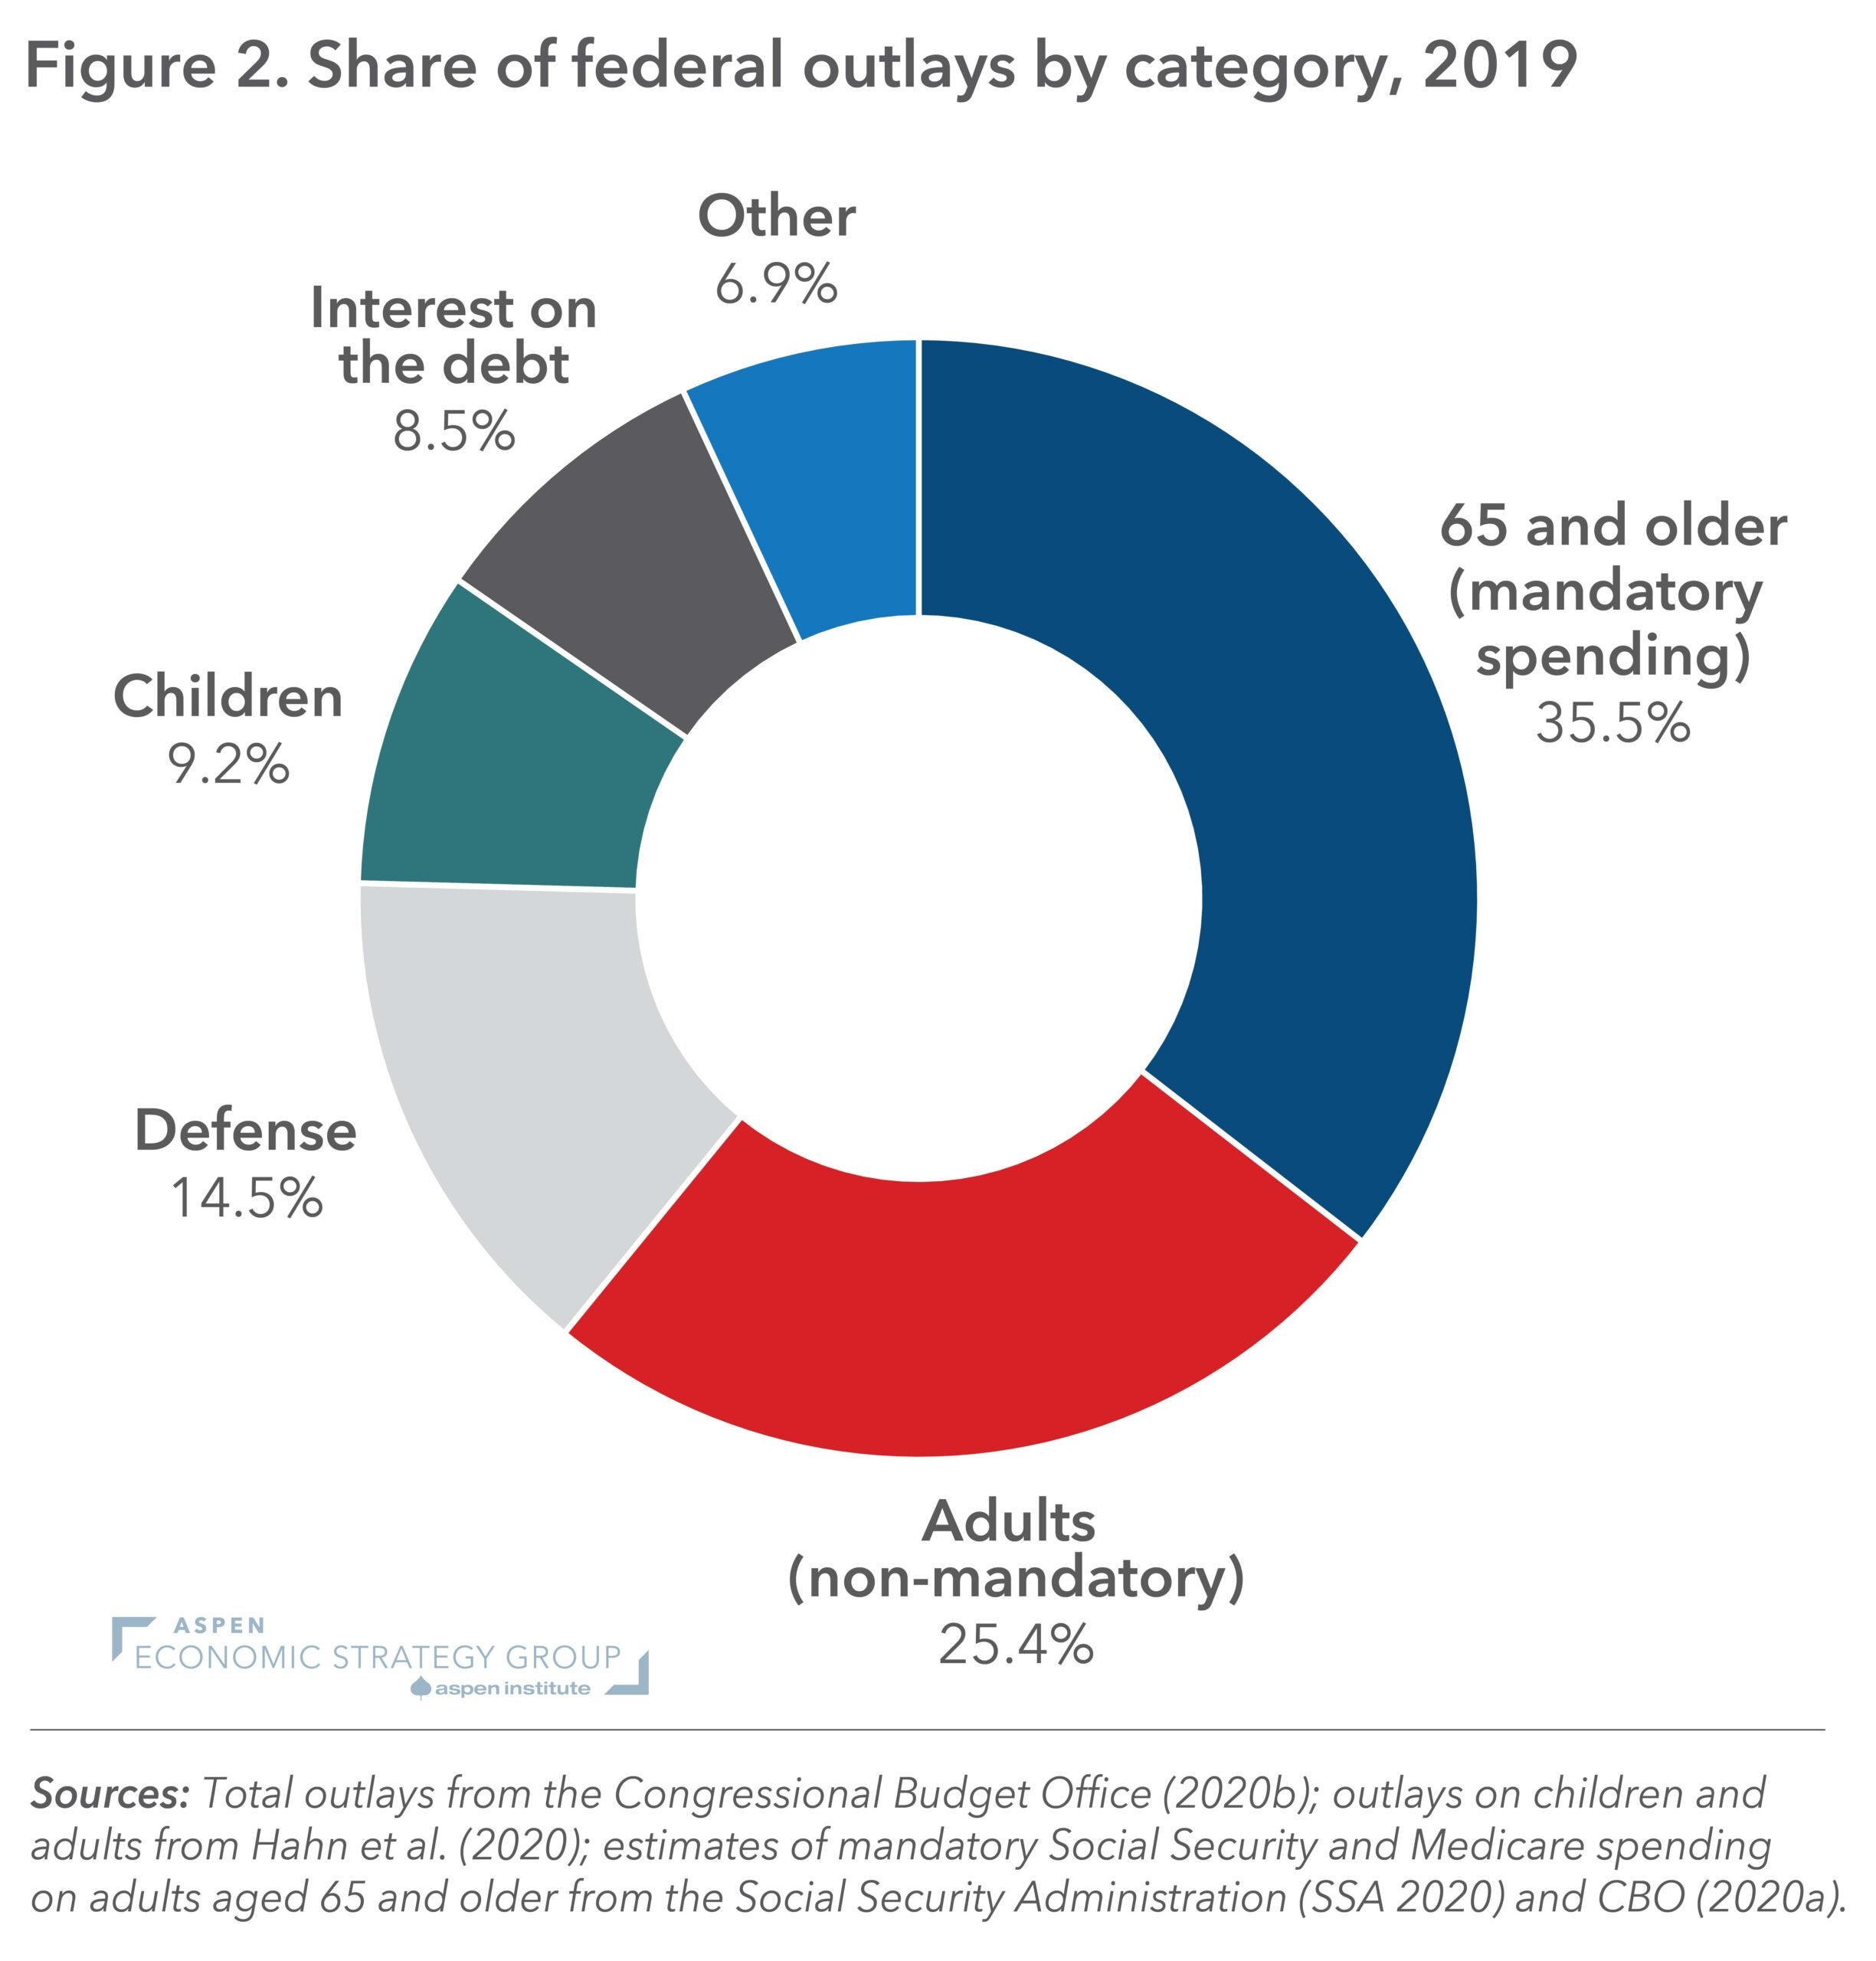
Figure 2: United States vs. China by GDP, 1990-2006
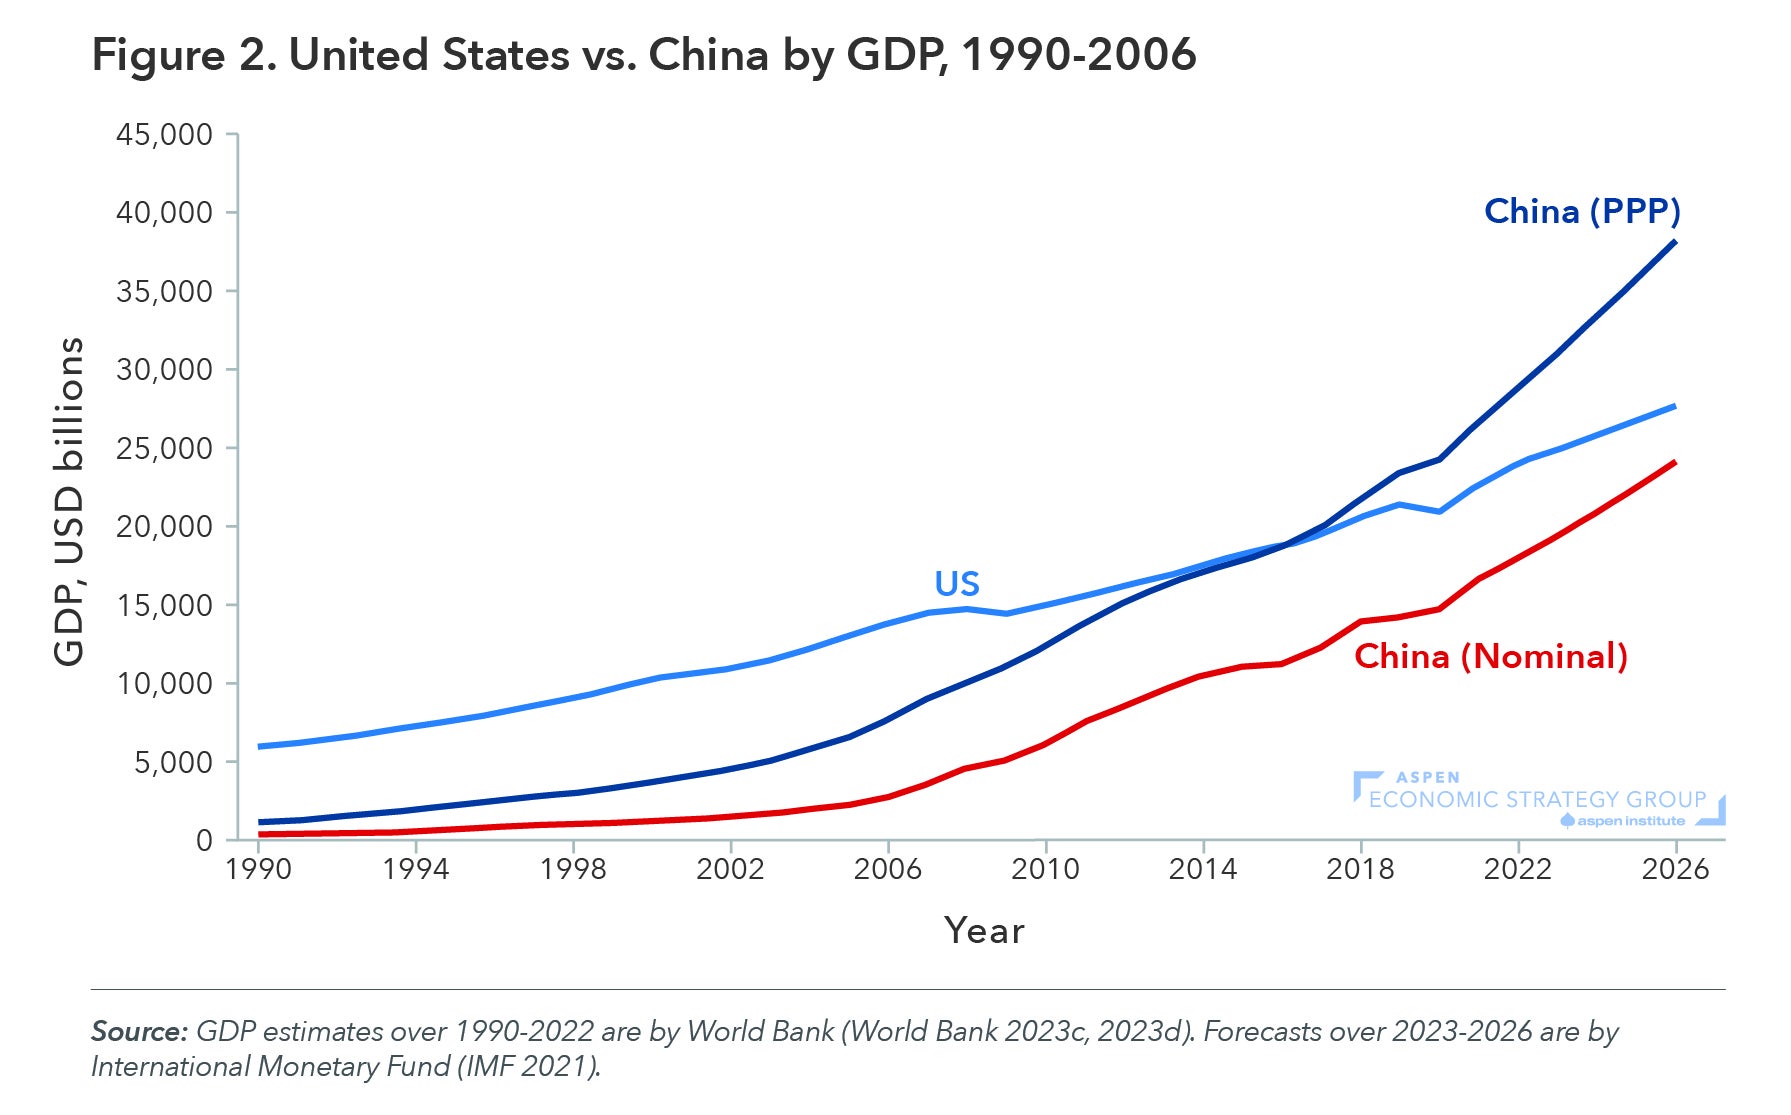
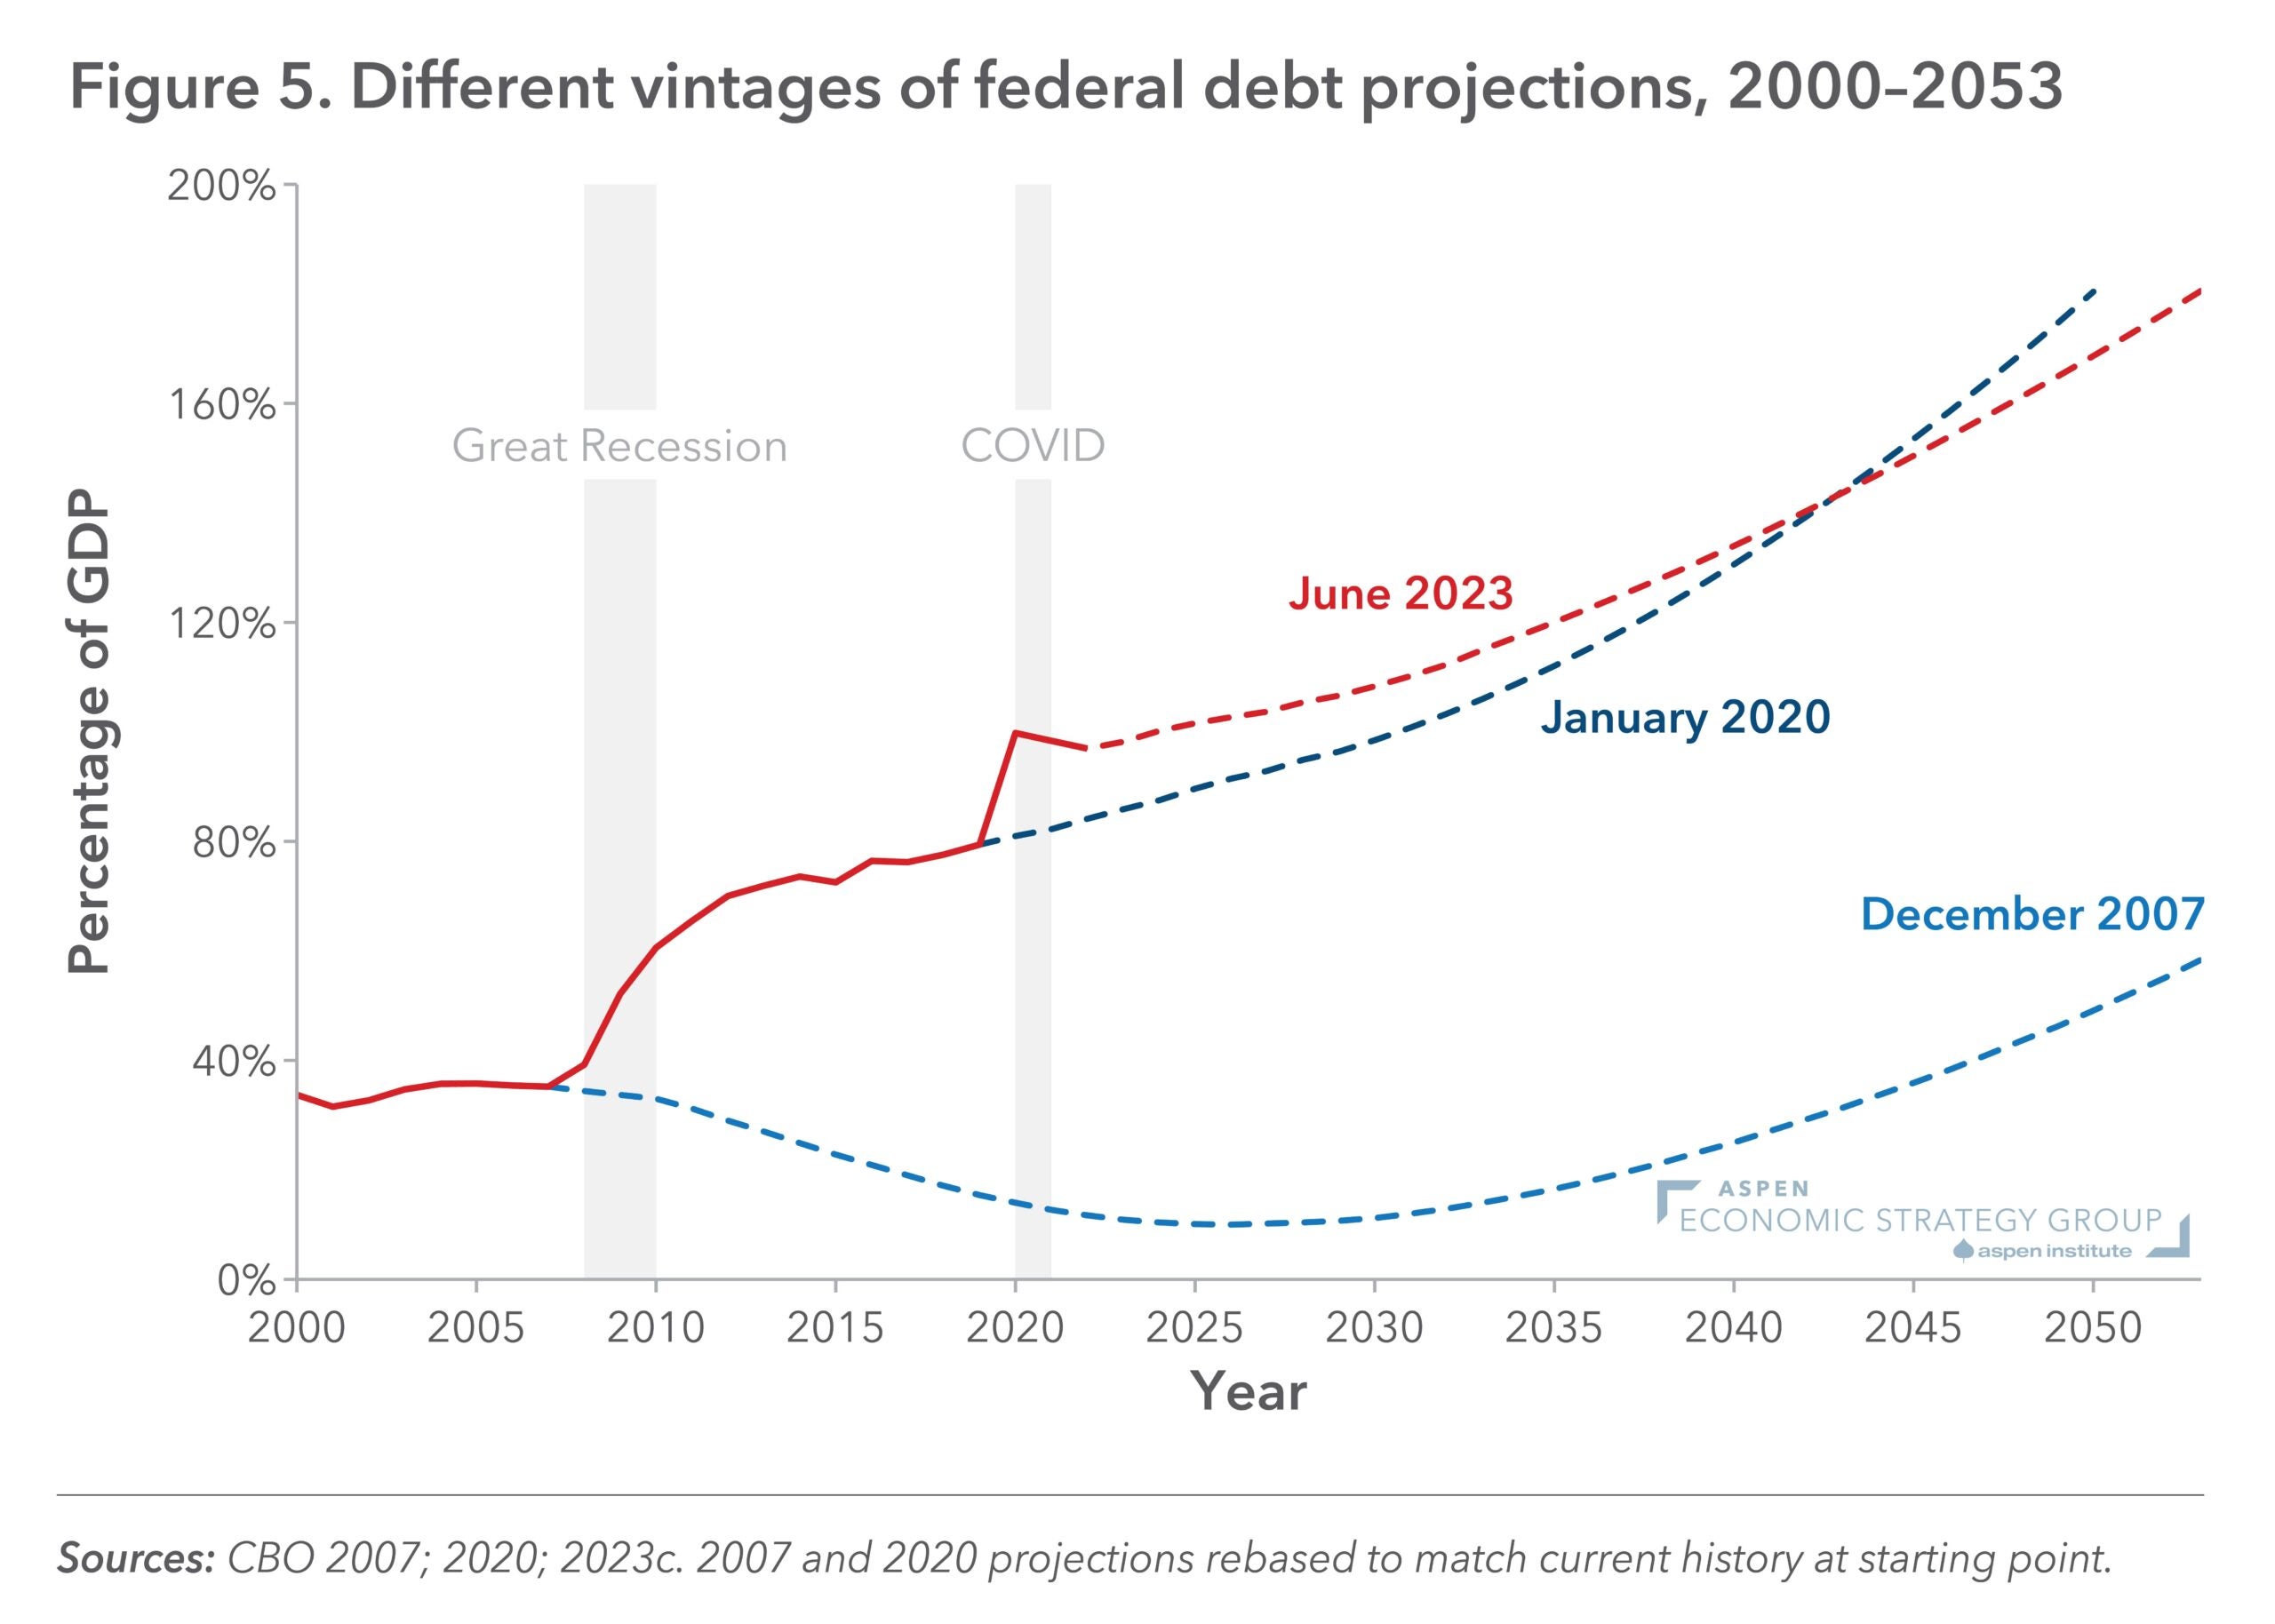
Figure 5: Different vintages of federal debt projections, 2000-2053