Archives: Publications
These are AIESG Publications
Figure 1: 2019-2022 NAEP Math Score Changes vs. Free or Reduced-Price Lunch Rates
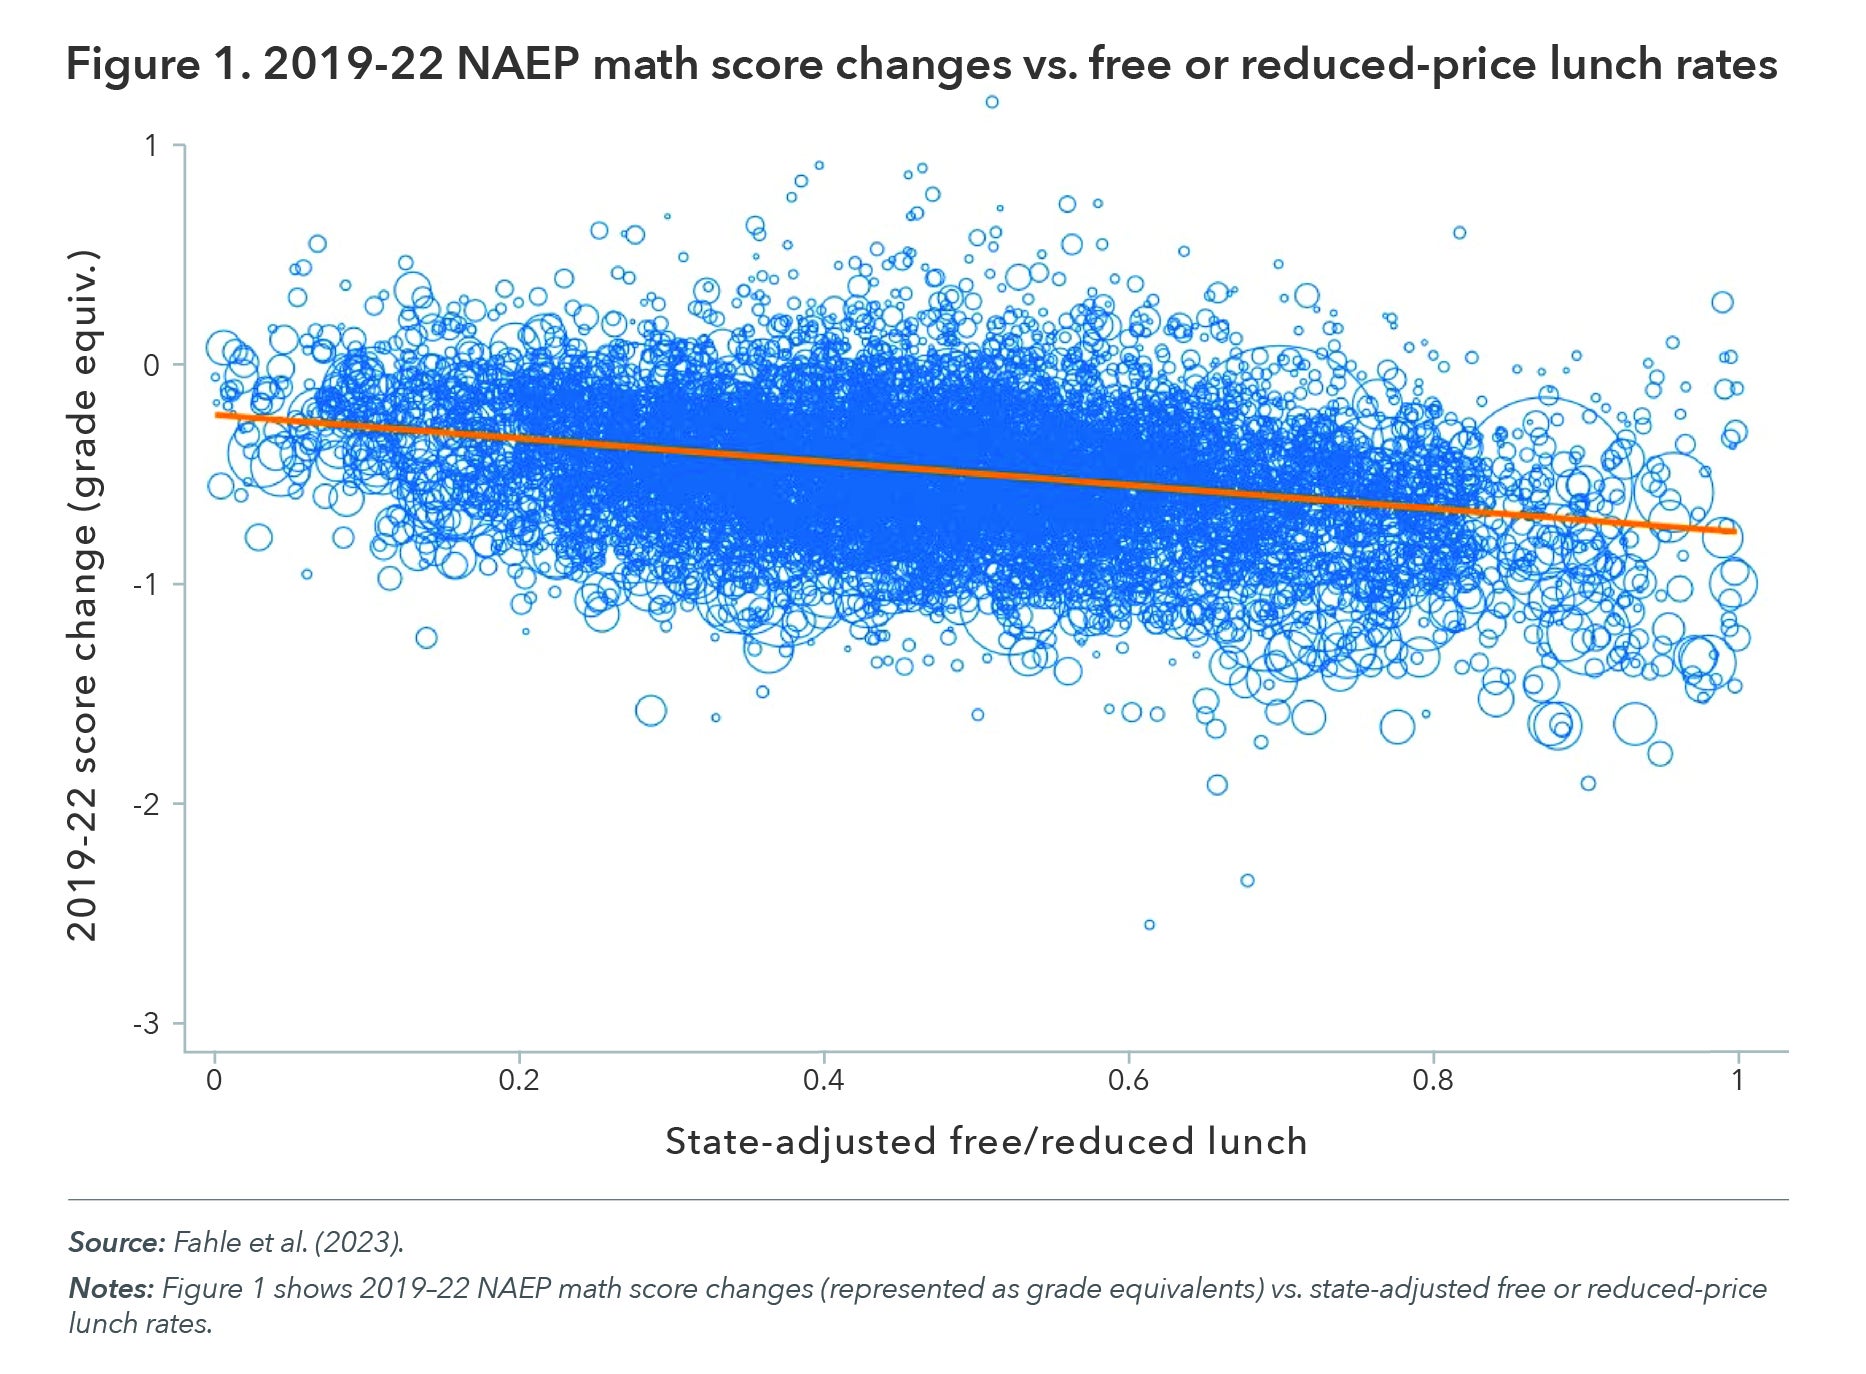
Figure 4: Social Security PIA versus AIME benefit formula in 2022
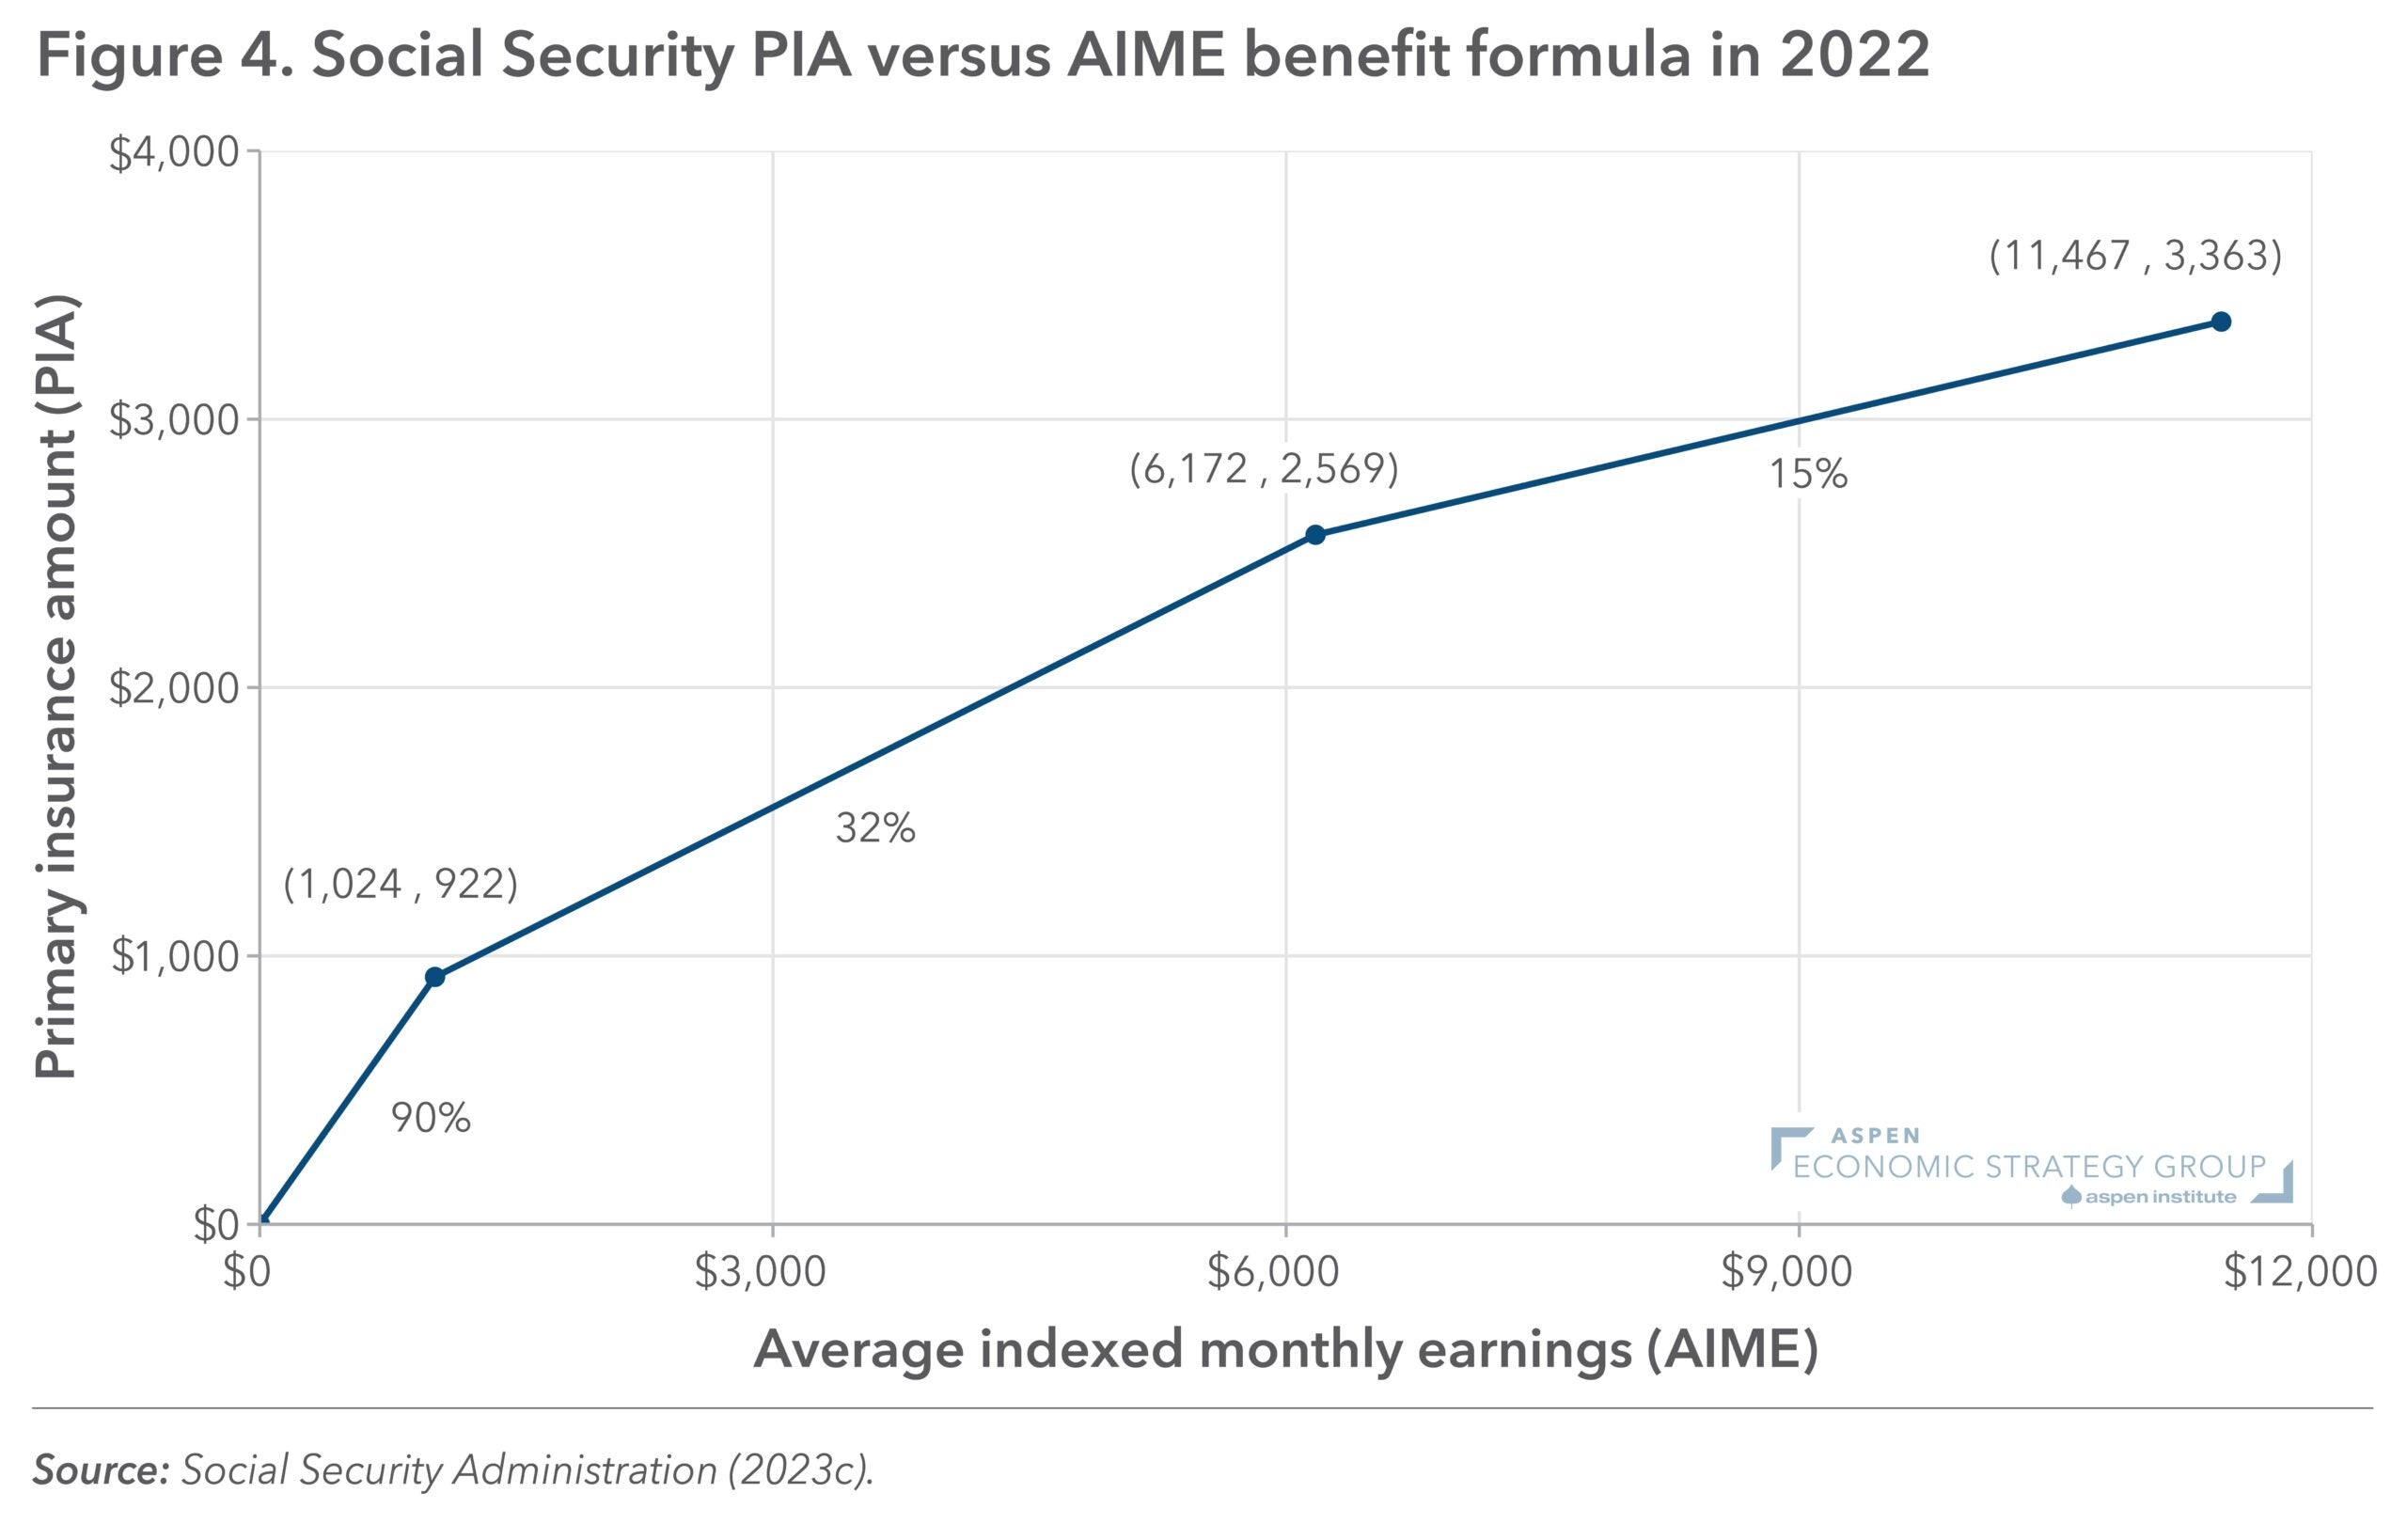
Figure 3: Top Income Sources in 2019
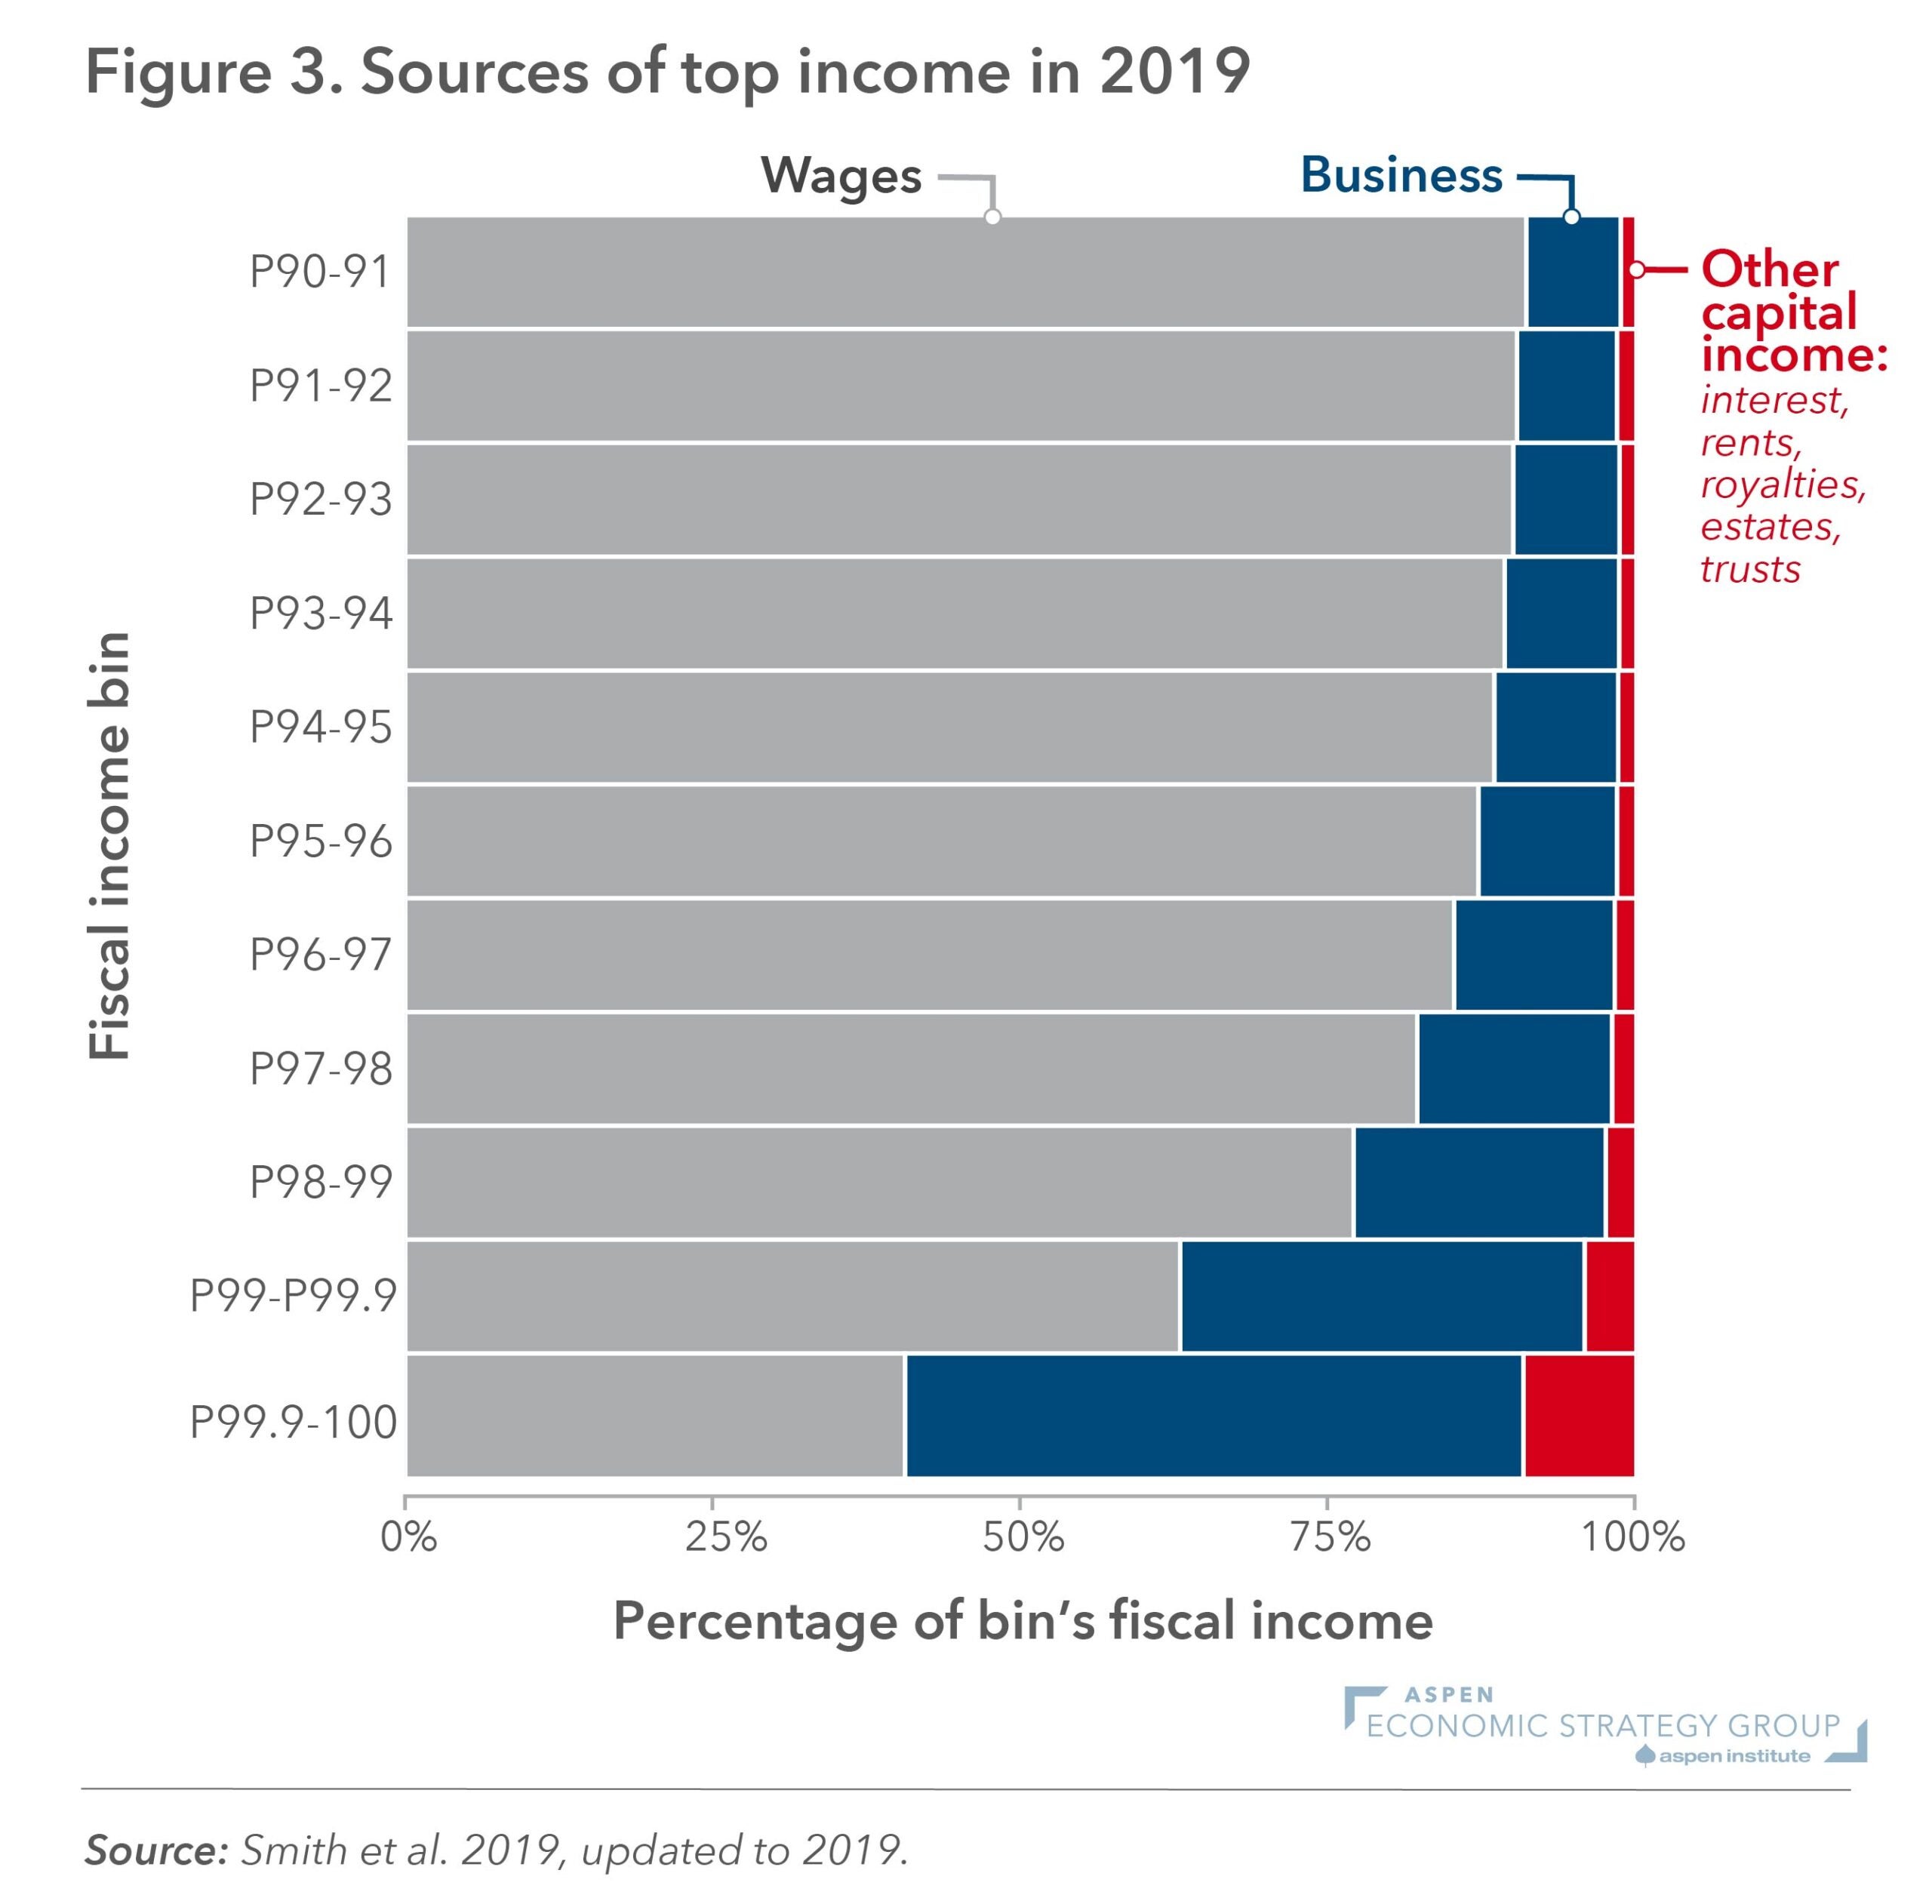
Figure 10: Annual Return to Human Capital, 1990-2021
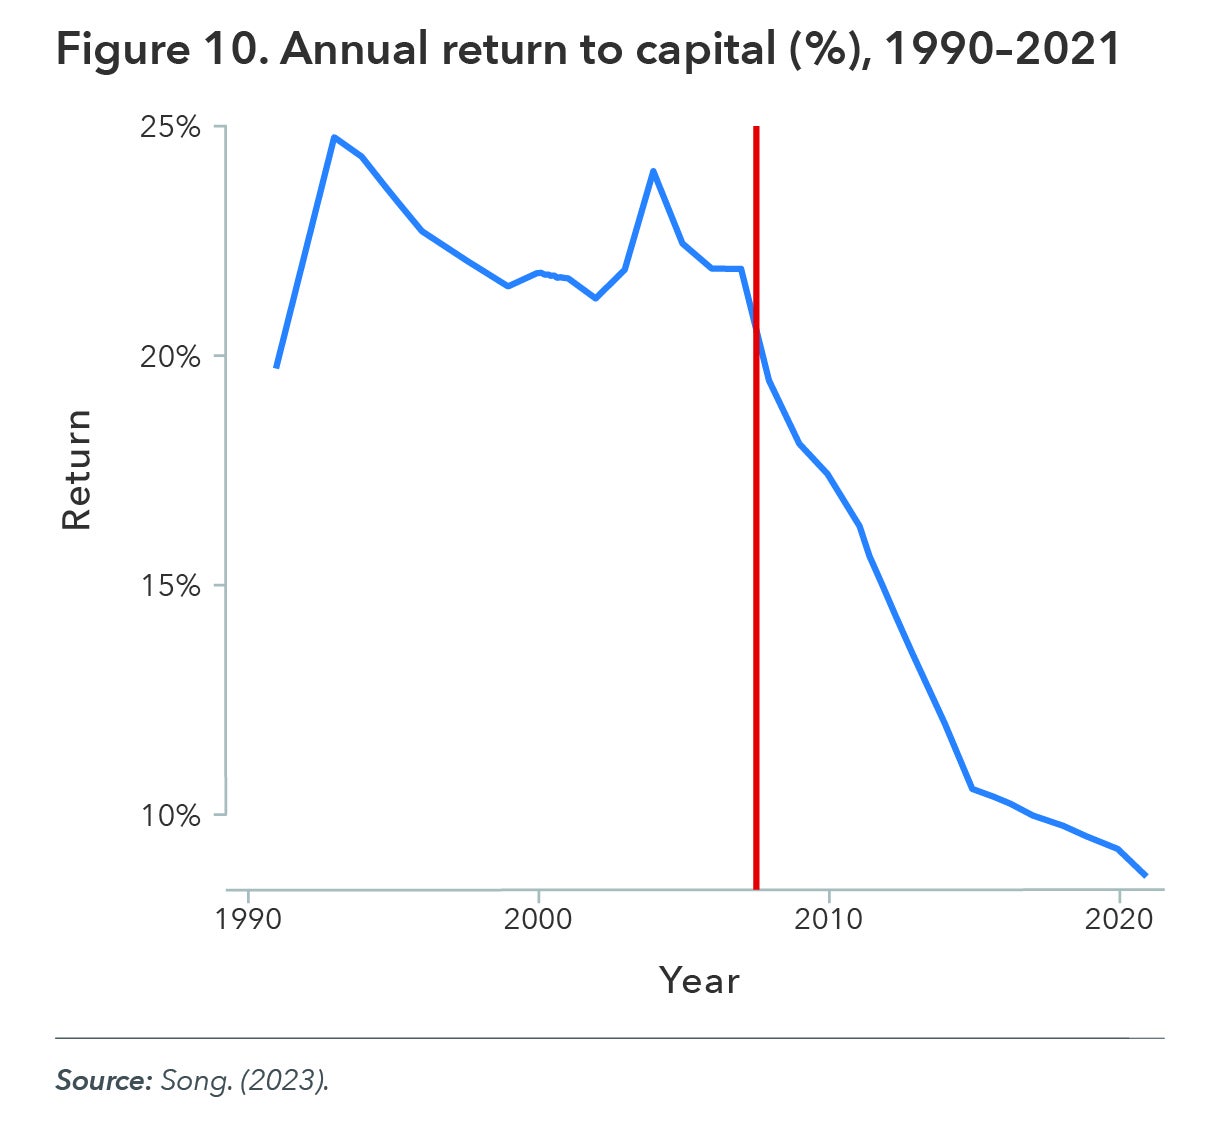
Figure 13: Distribution and Reimbursement of Provider-Administered Outpatient Drugs: Buy-And-Bill
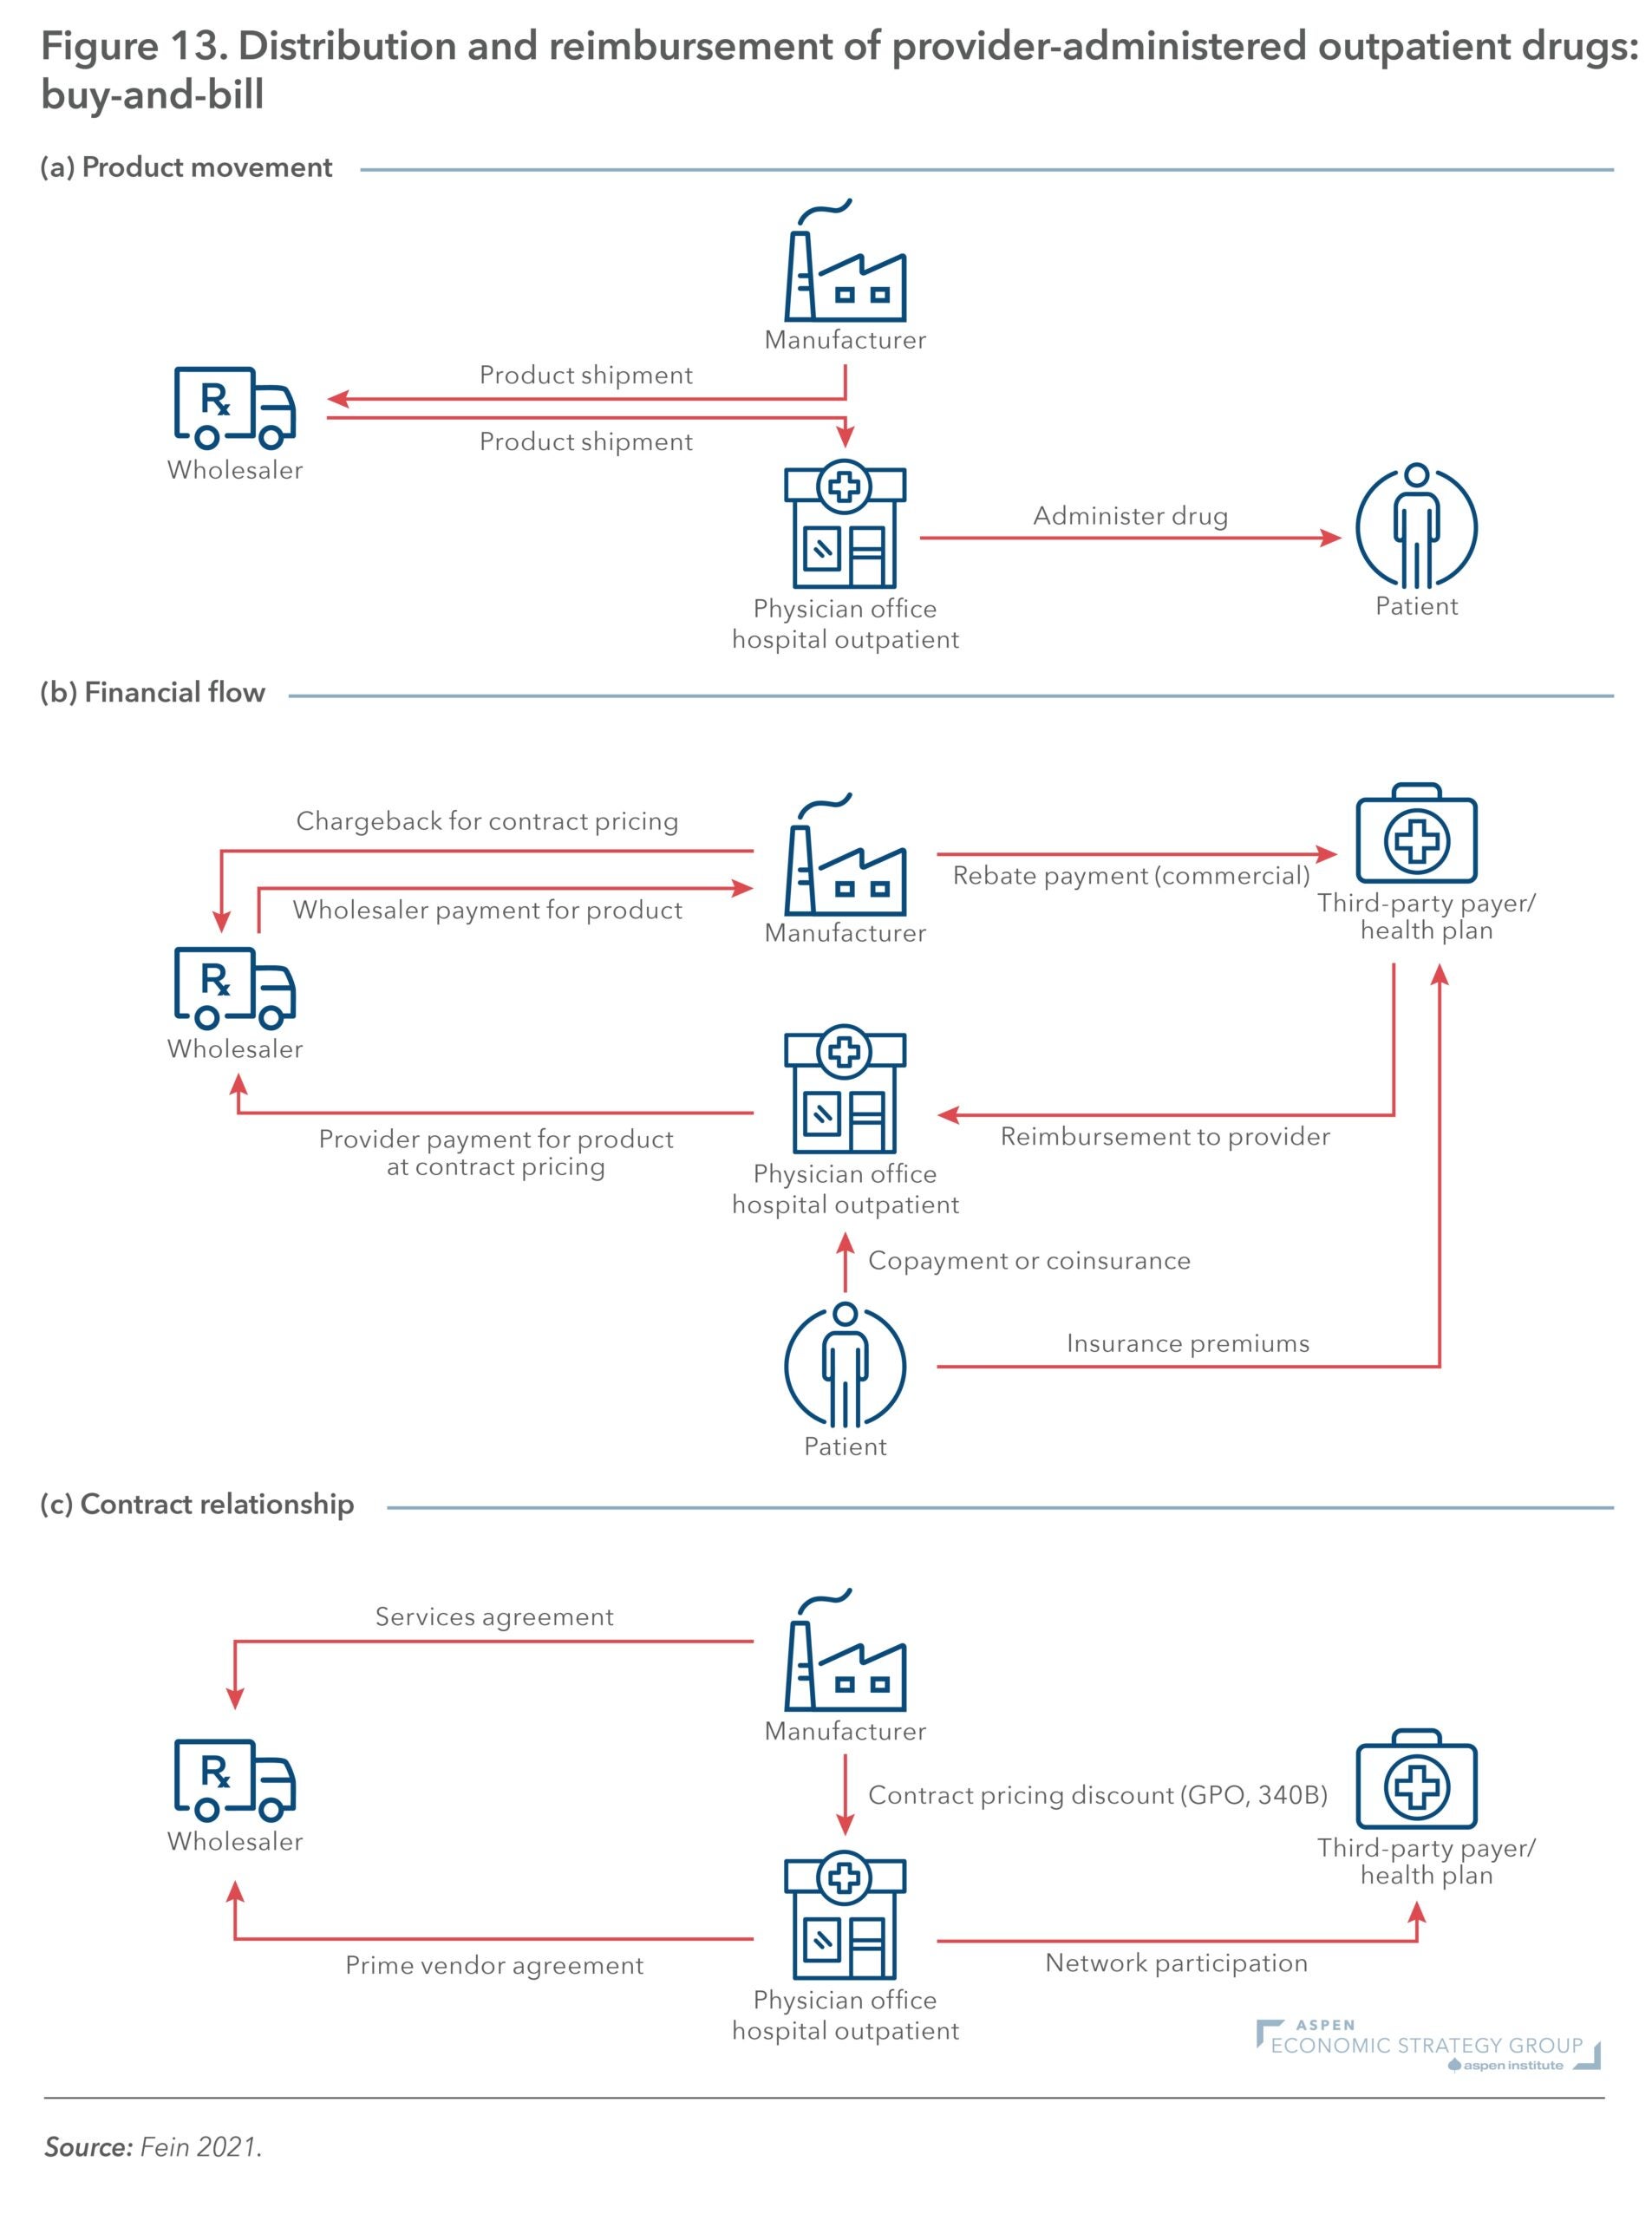
Figure 1: Federal debt held by the public, 1940-2053
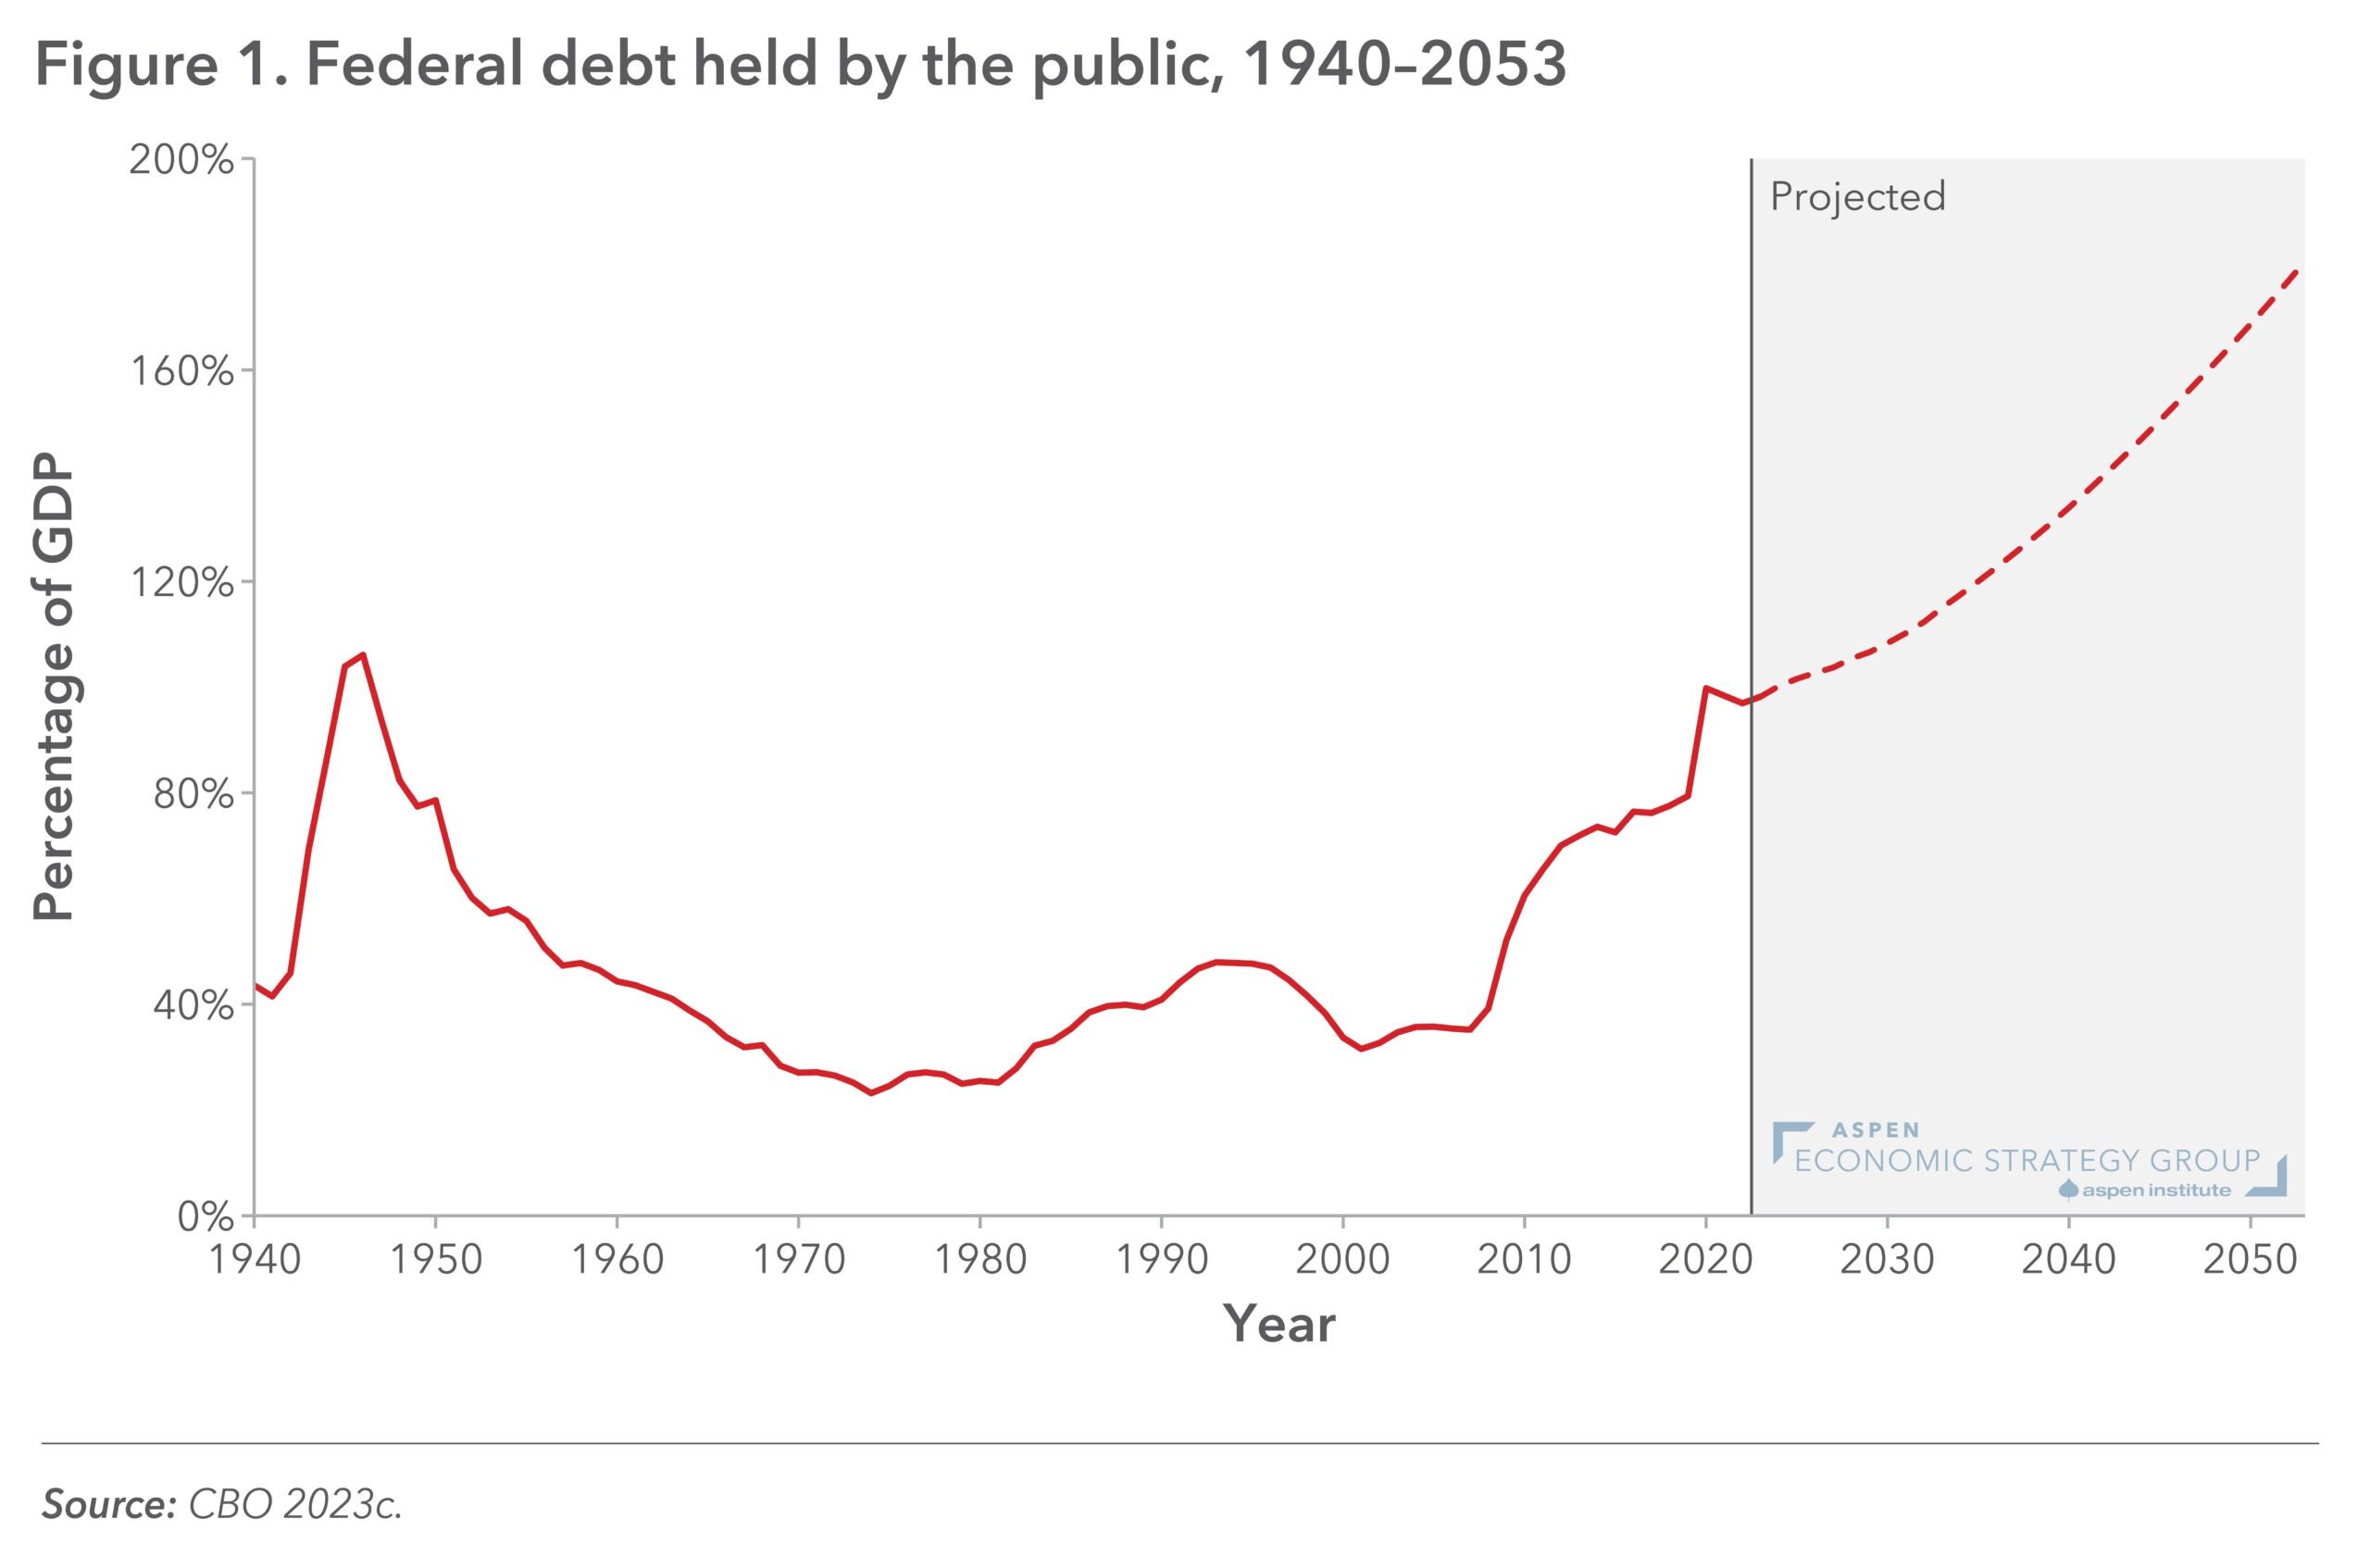
From “High and Rising US Federal Debt: Causes and Implications,” by Karen Dynan.
Figure 2(b): CBO Projections for Federal Spending and Revenues, 2008–2053
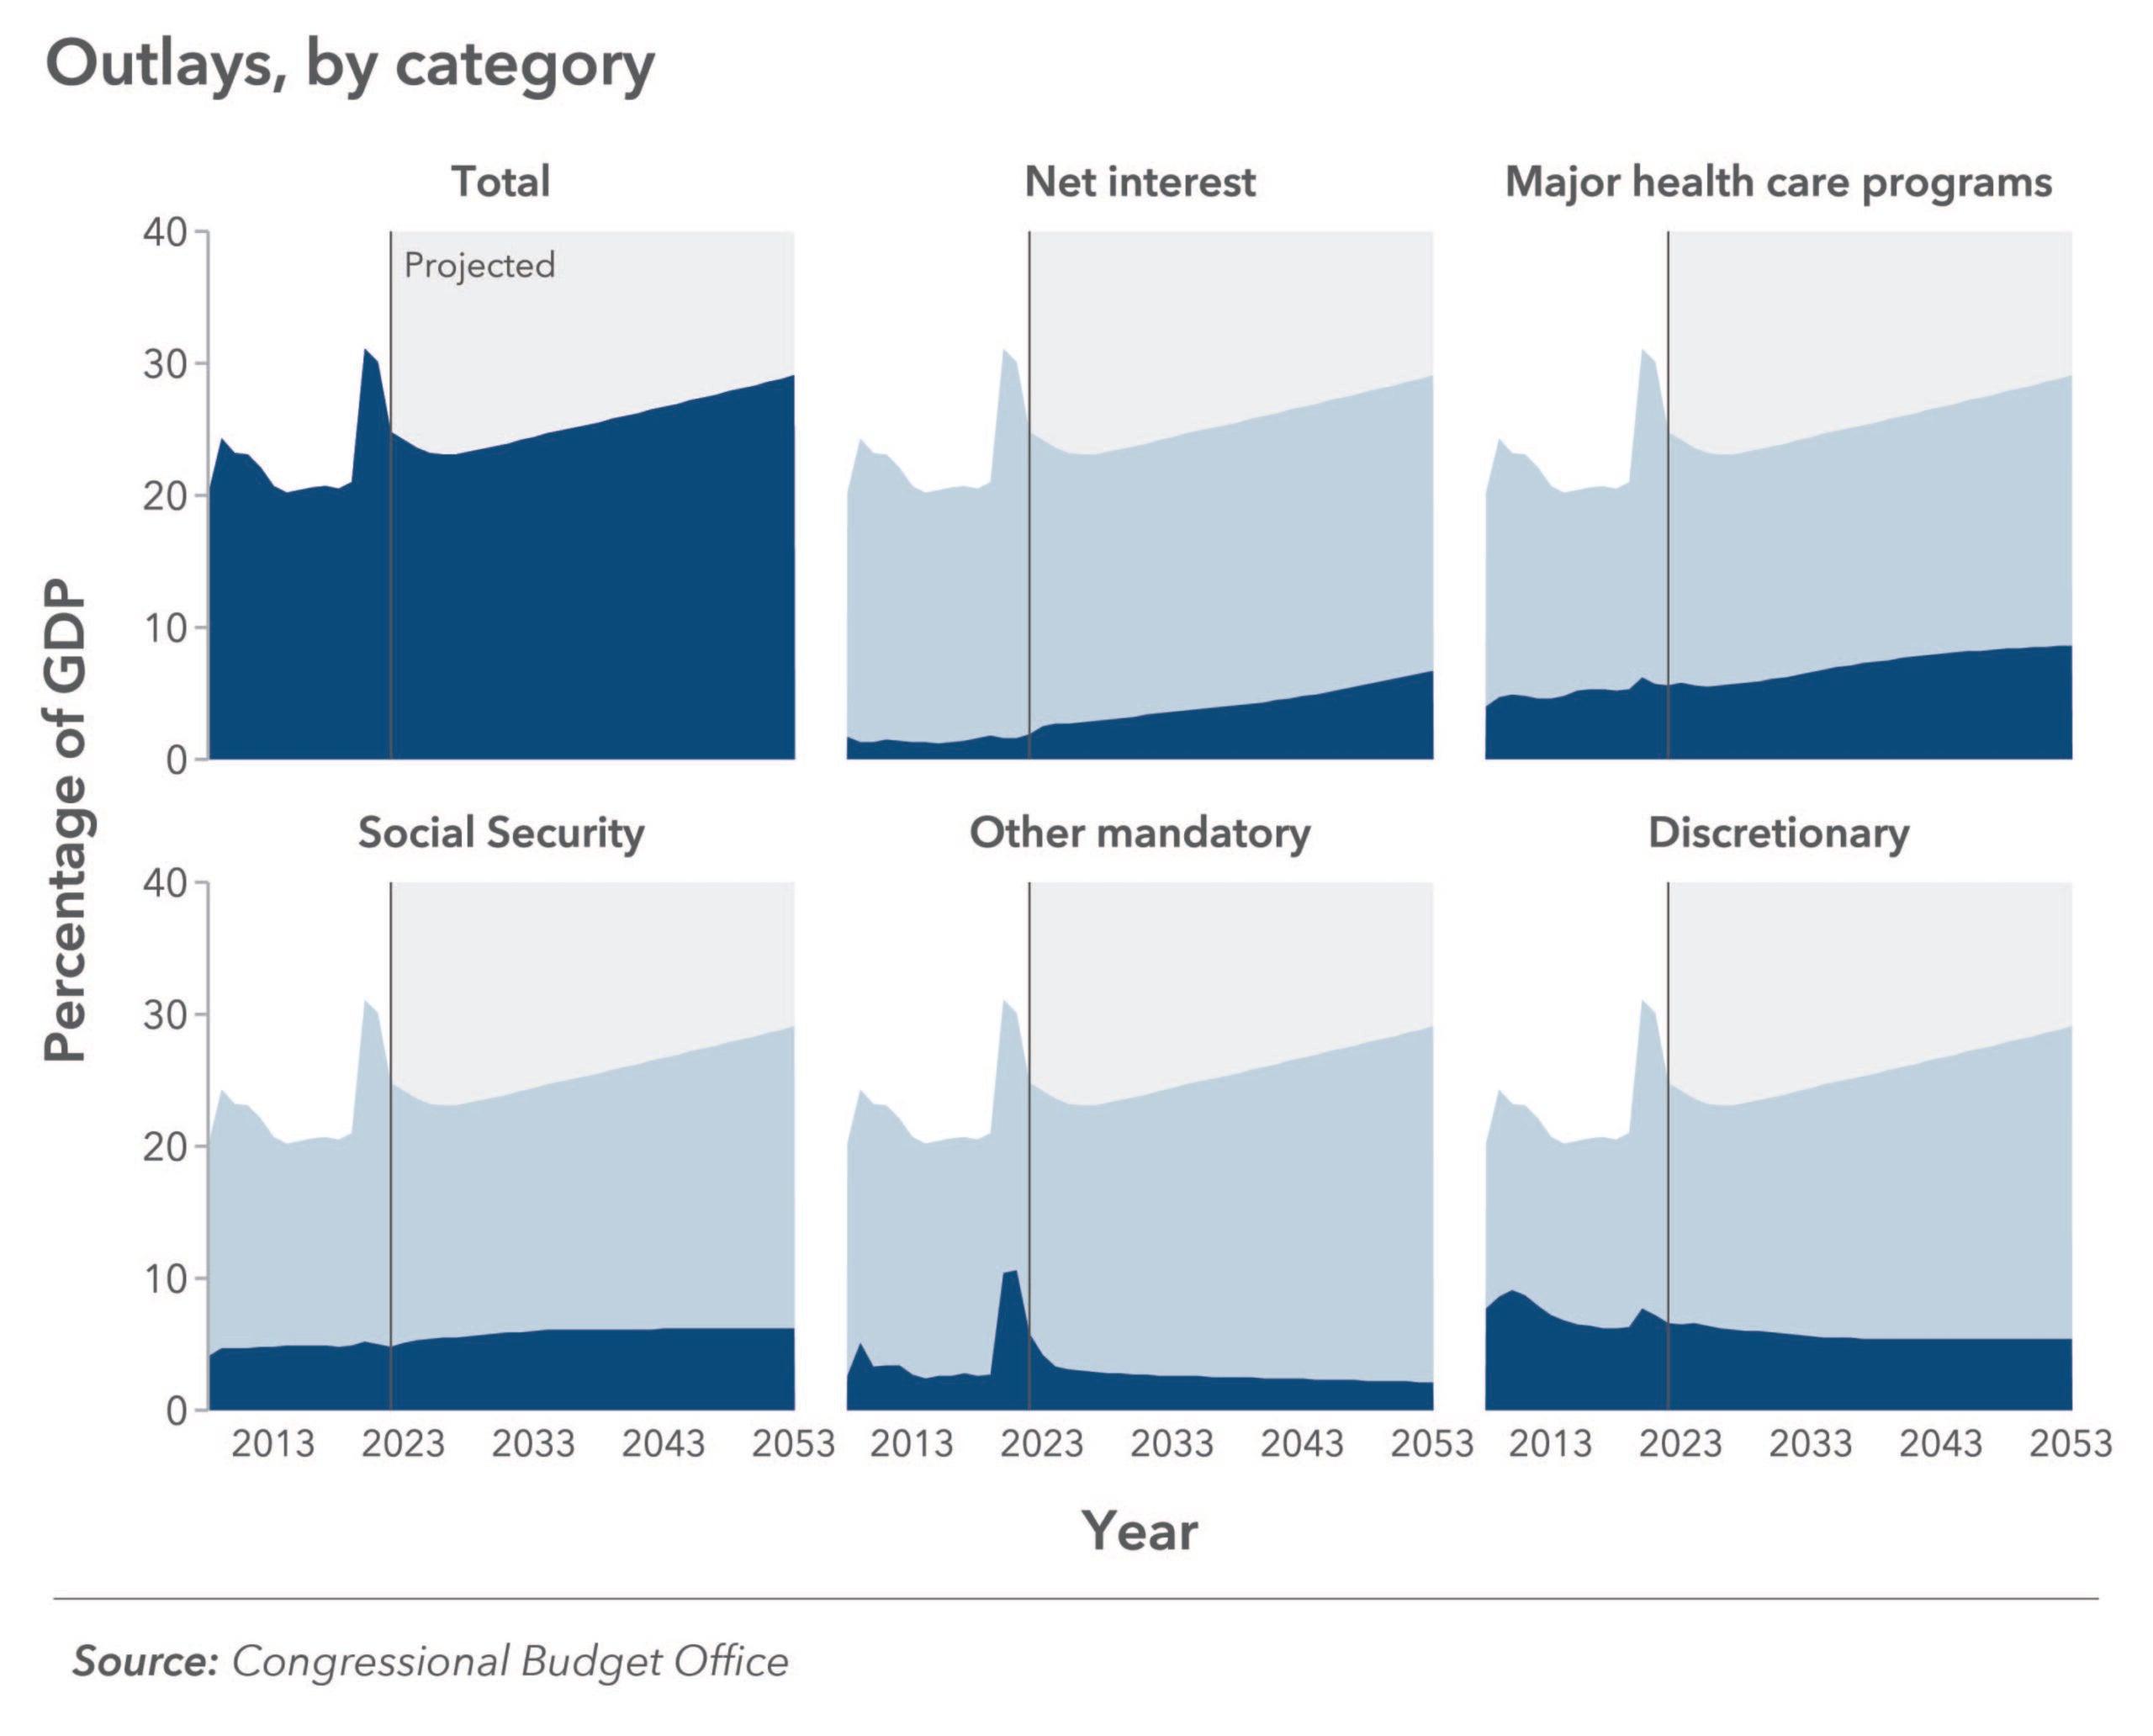
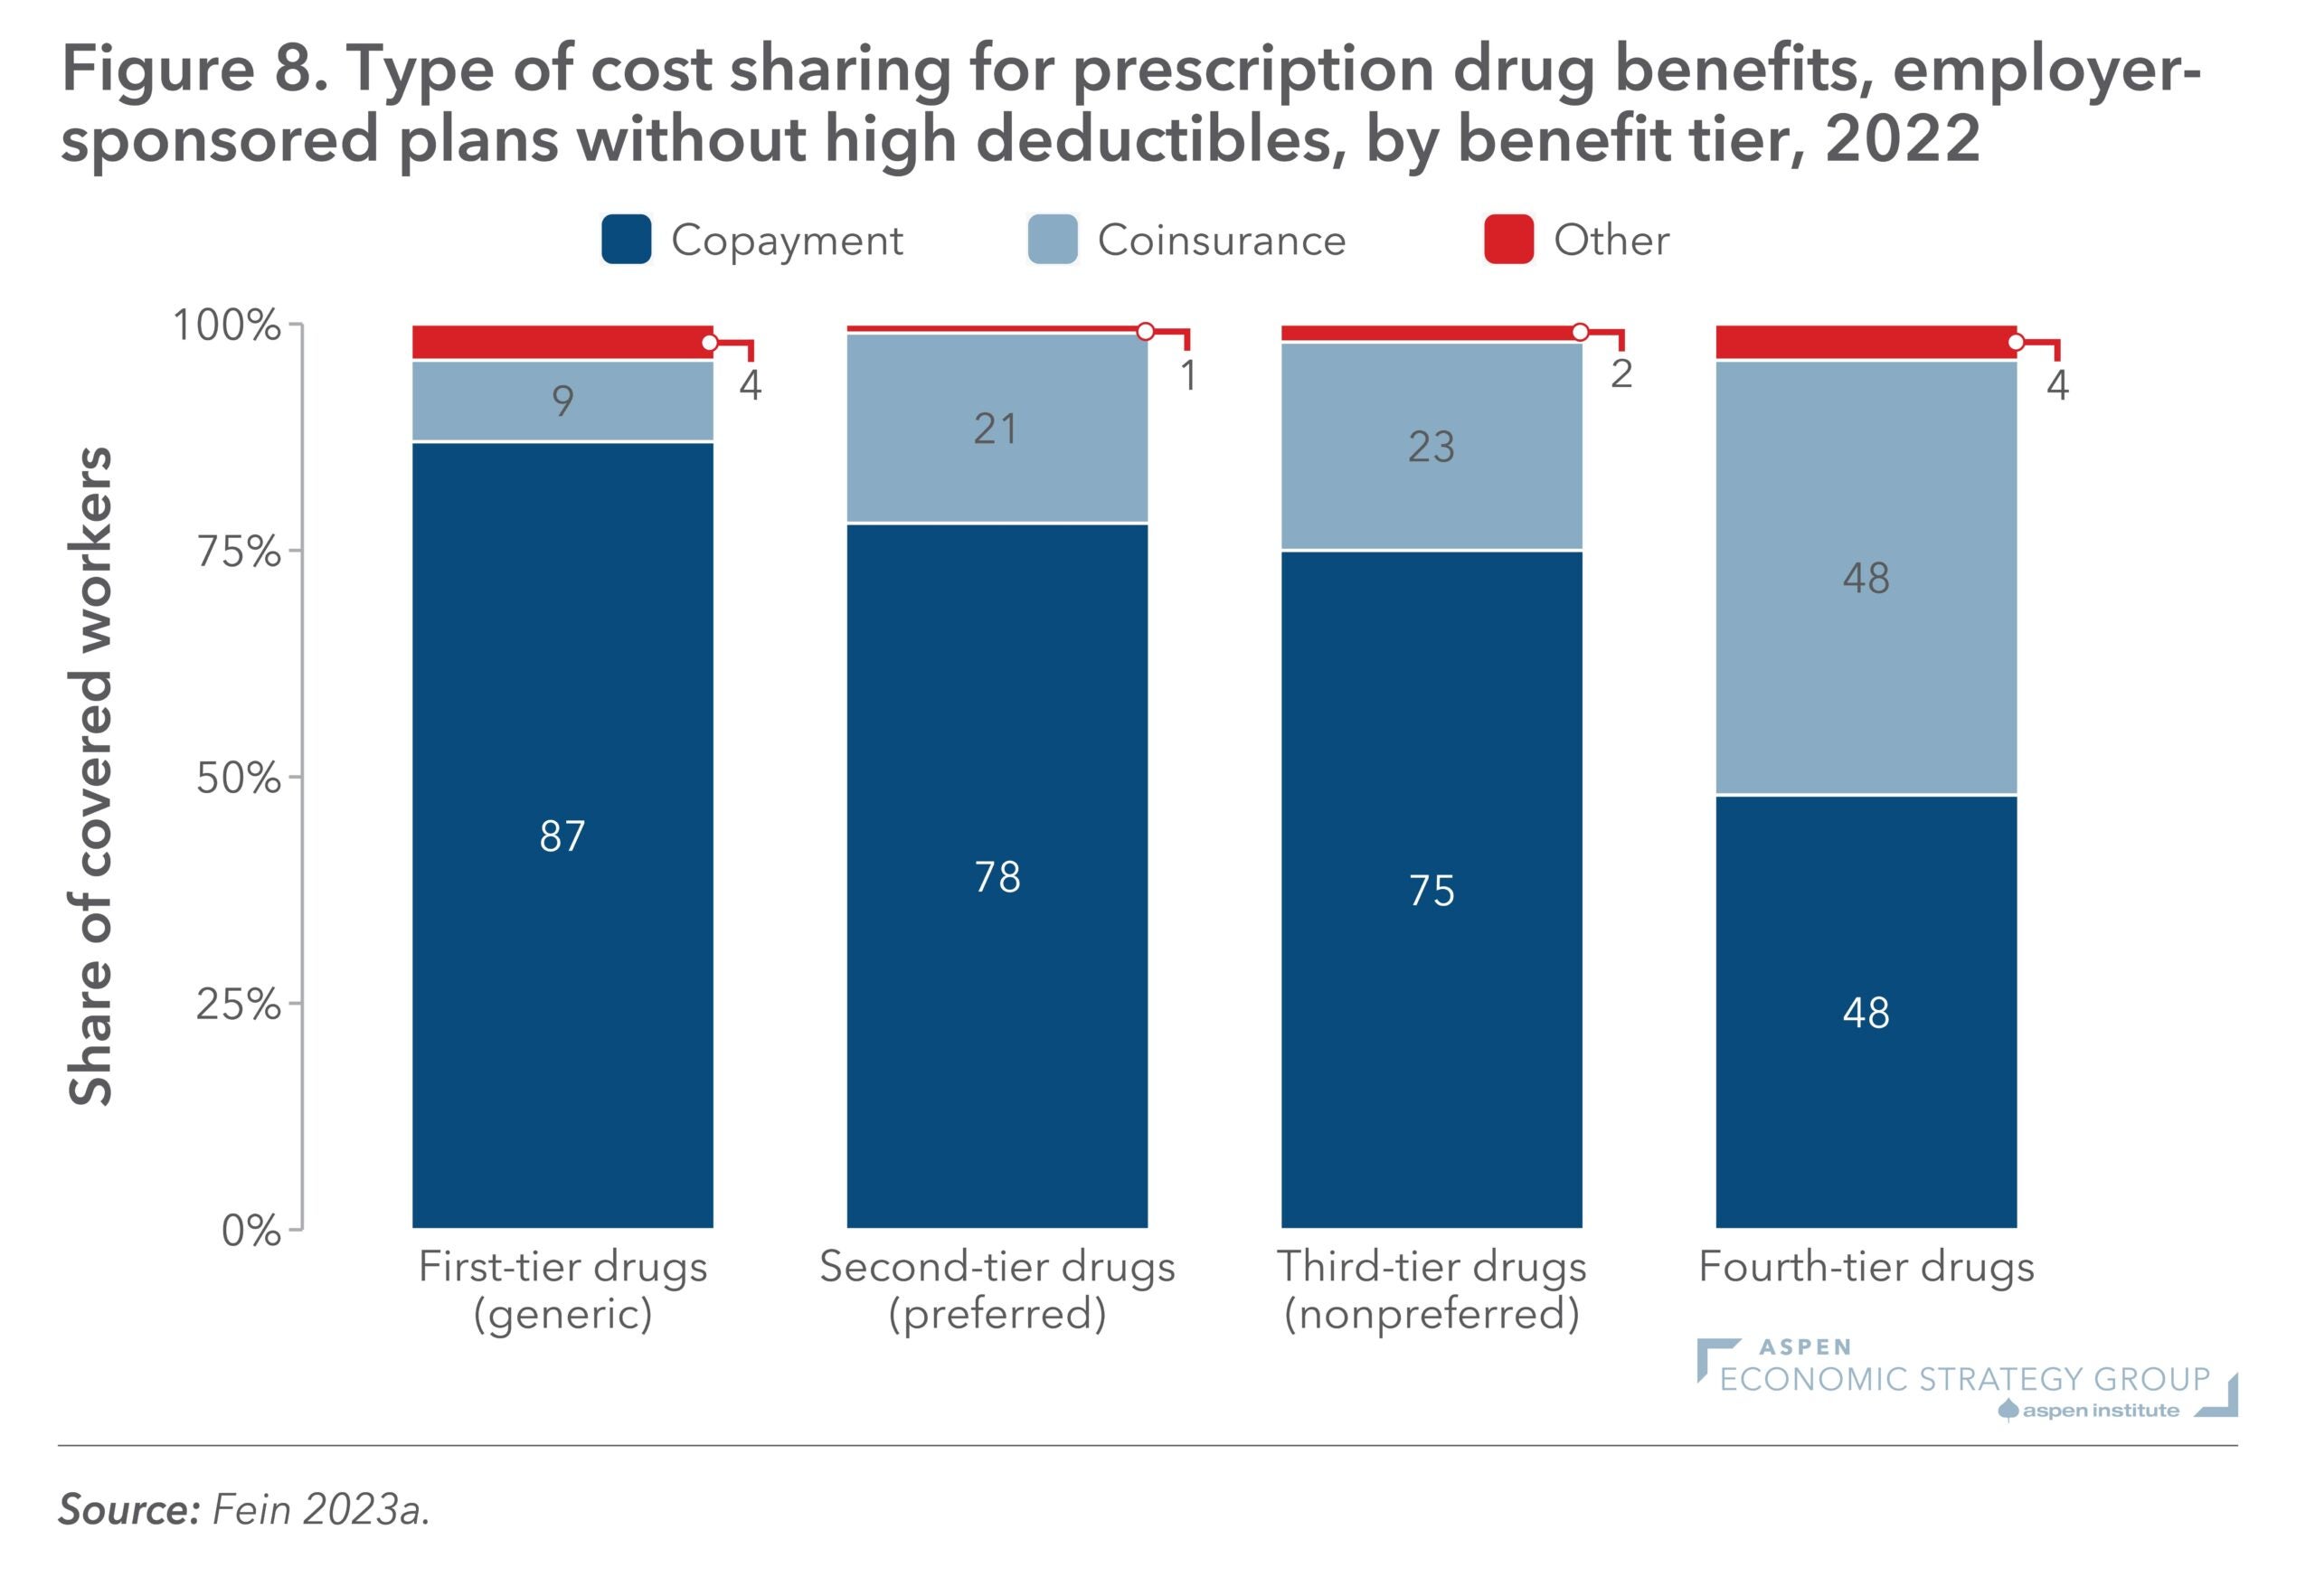
Figure 8: Type of Cost Sharing for Prescription Drug Benefits, Employer-Sponsored Plans Without High Deductibles, by Benefit Tier, 2022