14 Facts about US Investments in Infrastructure and R&D

Bipartisan support in Congress is emerging for new strategic investments in science and technology, in addition to a trillion-dollar infrastructure deal. These proposals reflect an emerging consensus that large-scale government investments are necessary to support the US economy’s transition to sustainable energy sources, address underlying sources of domestic inequality, and promote American economic competitiveness.
In order to inform the debate over the size and scope of new investments, we present this set of 14 facts with the goal of advancing an accurate understanding of the current state of public investment in the United States and, in particular, investment in infrastructure and research and development (R&D). As demonstrated in this memo, however, this is impossible to characterize the current situation in simple soundbites. On the one hand, US public investment in R&D is at a 60-year low. On the other hand, private R&D investment in the United States is reaching historic highs. America’s highway infrastructure is aging and the cost of building new roads has risen dramatically, but road quality also continues to improve and highways are becoming smoother. The United States invests less in transportation infrastructure as a share of GDP, on average, than the OECD or China. But the United States still leads the world in total (combined public and private sector) R&D investment.
The charts below provide a nuanced picture of federal investment and specifically nondefense investment, which falls into three categories: education and training, physical capital, and R&D. We focus on the latter two categories, in particular.1 Section I describe long-run trends in R&D and physical capital investments in the United States. Section II describes trends in overall infrastructure investment, by sector and across different categories of investment, highlighting the rise of digital infrastructure investment. Section III looks at unique features of the US highway infrastructure. Finally, Section IV places trends in US public investment into context by comparing them with investment trends in China and other advanced economies.
I. Overall Trends in Government Investment
Government investment has the potential to boost long-run productivity, wages, standards of living, and international competitiveness and to help redress long-standing sources of inequality. Government investment also provides public goods and services that the private sector tends to underproduce. For example, public funding for research and development has large, positive social externalities that private firms do not take into account when making decisions about how much to invest. Unlike public consumption, which often focuses on smoothing business cycles, government investment is made with an eye toward long-term economic goals.
In 2018, the US government invested less as a share of the economy relative to any other year since the early 1960s. This fact is especially striking since government debt as a share of the economy reached 104% in 2018, nearly surpassing the previous peak during World War II. With the exception of a temporary increase in funding for infrastructure projects and investment in response to the Great Recession, the recent run-up in federal debt has largely financed public consumption rather than investment.
1. Total federal investment as a share of the economy is declining.
Figure 1: US federal investment as a share of GDP, 1962–2018
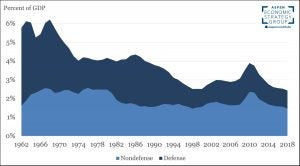
Source: CBO.
Figure 1 shows the breakdown of federal investment as a share of GDP across defense and nondefense categories. At 2.4% of GDP, total investment is far below the 1968 peak of 6.2%. Although both types of investment have declined, defense investment as a share of the total is shrinking at a faster rate. In 1962, defense investment made up 72% of the total. By 2018, that share had fallen to under 40%.
2. US federal investment in R&D and physical capital is at historic lows, while federal investment in education and training remains on par with the historical average.
Figure 2: US federal nondefense investment as a share of GDP, 1962–2018: physical capital, education and training, and R&D
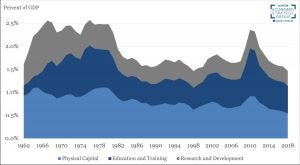
Source: CBO and author’s calculations.
Figure 2 breaks down nondefense investment into its three primary categories: physical capital, education and training, and R&D. As a share of the economy, the US federal government invested just under 1.5% of GDP across all three categories in 2018. This is well below the historical average of 2% of GDP per year and is the second lowest level between 1962 and 2018.
US investments in physical capital peaked in the 1960s and 1970s at 1.1% of GDP, a period which included the construction of the interstate highway system. Physical capital investment increased temporarily to 0.9% in 2009 and 2010 due to investments associated with the passage of the American Recovery and Reinvestment Act (ARRA).
Federal investment in education and training rose from less than 0.5% in the 1960s to nearly 1% of GDP by 1975 due to a large increase in spending on elementary, secondary, and higher education and on education benefits for Vietnam War veterans (CBO 2019). By 1985, it had shrunk back down to just under 0.5%. Education investment as a share of the economy rebounded to 1% of GDP again in 2010 under ARRA, which temporarily increased funding for Pell grants for higher education, along with spending for K-12 education and secondary and vocational training. Today, at 0.6% of GDP, education and training investment is on par with the average over the previous six decades.
Federal nondefense investment in R&D has steadily declined for several decades. It has consistently been below 0.5% of GDP since the early 1980s, and now, at just 0.3% of GDP, has reached the lowest share on record.
Recently, there has been heightened political interest in increasing federal R&D spending to increase American competitiveness with China. The Innovation and Competition Act (2021), passed by the US Senate in June 2021 with bipartisan support, authorizes over $140 billion over five years to fund R&D activities through the National Science Foundation, the Department of Commerce, the Department of Energy, and NASA. If implemented, the Act would increase federal R&D spending to more than $90 billion per year over the next five years—almost double the historical average of $46.4 billion per year (in 2018 dollars).
3. Although federal R&D investment is near a historic low, business R&D has been rising for decades.
Figure 3: US R&D spending by source, 1953–2019
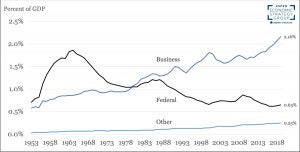
Source: National Center for Science and Engineering Statistics (NCSES) National Science Foundation, Table 1.
Alongside declines in federal R&D investment, R&D investment by the business sector has been on an upward trend for over half a century. In 1980, US private sector R&D investment surpassed that of the federal government (Figure 3) and the gap continues to widen. From 2010 to 2019, total inflation-adjusted R&D investment grew at a pace of 3.3% per year, which was driven entirely by private investment and outpaced the average real GDP growth of 2% over the same period (NCSES 2021). One might suspect from looking at these trends that public and private investment are substitutes, but existing research suggests the opposite is the case. For example, OECD (2000) finds an additional dollar of government R&D investment increases business-financed R&D by 1.7 dollars, on average.
Business R&D reached a high of 2.2% of GDP, or roughly $463 billion in 2019. Meanwhile, total federal R&D spending was just over 0.6% of GDP in 2018, among the lowest levels on record. “Other” R&D spending remains a small but growing portion of total R&D spending and includes investment by state and local governments, higher-education, and non-profit institutions.
Although direct federal spending on R&D is declining as a share of the economy, the federal government also promotes private sector R&D through the federal R&D tax credit. In 2021, the Joint Tax Committee (2018) estimates federal expenditures through the R&D tax credit to be worth $11.6 billion. These tax credit benefits are not included in the direct federal spending amounts depicted in Figure 3. However, the share of R&D tax incentives in total government support for R&D has increased over time, from approximately 29% in 2000 to 38% in 2016 (OECD 2020).
II. US Infrastructure Assets and Investments
This section explores trends in US infrastructure investment and the stock of infrastructure assets. As recent public debates illustrate, defining what constitutes infrastructure is a difficult undertaking. We rely on definitions provided by Bennett et al. (2019), who analyze the national economic accounts to define and measure three broad categories of infrastructure investment: basic, social, and digital. The authors define “basic” infrastructure as traditional assets such as transportation, water, sewer, and power. “Social infrastructure” refers to public and private hospitals, schools, and public safety facilities. Finally, “digital infrastructure” includes communications structures and equipment, software, and computers.
Public capital (infrastructure) and technological progress (driven by R&D) can play an important role in stimulating both long-run economic growth and labor productivity (and thereby long-run wage growth). Increasing the amount of capital available per worker hour, known as capital deepening, and technological progress are important drivers of labor productivity, along with human capital investments. Public investments that raise the total amount of capital available per worker and accelerate technological innovation through investments in R&D fuel productivity growth and therefore long-run wage and economic growth. Ramey (2020) summarizes existing estimates of the elasticity of output to public capital, which range from .08 to .39.
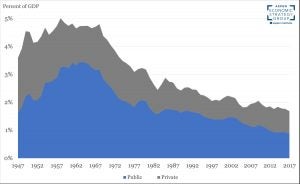
4. Basic infrastructure still accounts for the largest share of infrastructure spending across public and private sectors, but the share of digital infrastructure investment is catching up.
Figure 4: Infrastructure investment by type, 1947–2017
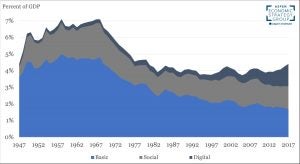
Source: Bennett et al. (2019), BEA, author’s calculations.
Total infrastructure investment across all categories (basic, social, and digital) and across public and private sectors has remained relatively steady since the early 1980s, but the composition of spending has changed significantly. In 2017, digital infrastructure investment was 1.4% of GDP compared to 1.4% for social infrastructure and 1.7% for basic. This is in contrast with the year 1980, when digital infrastructure was just 0.33% of GDP, social was 1.2%, and basic was more than 3.1%. Since the year 2000, constant dollar digital infrastructure investment has increased by an average of 6.7% per year, while social infrastructure has increased by 1.9% per year, and basic infrastructure has grown at an average pace of just 0.5% per year.
5. Total spending on basic infrastructure across the public and private sectors is at a historic low.
Figure 5. Basic infrastructure investment by sector, 1947–2017
Source: Bennett et al. (2019), US Census Bureau, author’s calculations.
Figure 5 focuses only on basic infrastructure, including water, sewer, power, and conservation and development across public and private sectors. Total investment in this category peaked in the late 1950s, driven by public investments in the federal highway system. Both total basic investment and public sector basic investment as a share of GDP reached a minimum in 2017 at 1.68% and 0.87%, respectively. When measured on a per-capita basis, public and private basic infrastructure investment have converged over time. In 2017, per-capita private infrastructure spending was $455 per person per year, compared to a historical average of $340 per person. The same year, public spending was $486 per person per year, compared to a historical average of $566 per person.
6. The growth rate of digital infrastructure assets per capita reached an all-time high in 2017, while growth in the stock of other infrastructure assets is slightly above population growth.
Figure 6. Growth rate of the real net stock of basic, social, and digital infrastructure assets, per capita, 1990–2017
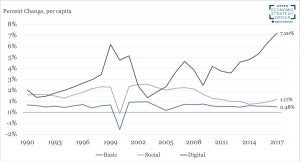
Source: Bennett et al. (2019), US Census Bureau, author’s calculations.
Figure 6 shows the growth rates of the stock of infrastructure per capita, in contrast to the flow measures of infrastructure investment shown in Figures 4 and 5. Measuring the stock of infrastructure assets helps to inform how well infrastructure investment is keeping up with the depreciation of assets and is thus an indicator of infrastructure’s productive capacity. We focus on per capita measures of infrastructure assets rather than stocks as a share of the economy because the amount of capital per worker (including public capital) drives labor productivity.
Figure 6 illustrates that basic infrastructure investment has just kept pace with population growth, growing at an average rate of 0.5% per year since the late 1990s. The stock of social infrastructure assets per capita has grown at an average pace of 1.6% per year since 1990, peaking in the early 2000s at 2.5% before the financial crisis of 2008. For the period 2010–2017, social infrastructure investment has grown at just 1% per year, on average. The story of digital infrastructure investment stands in sharp contrast to the other categories. The growth of the stock of digital infrastructure per capita has accelerated since 1990, growing at an average pace of 3.5% over the period 1990–2017 and peaking in 2017, the latest year for which data was available, at 7.2%.
7. The United States has made significant progress in expanding broadband internet access over the past decade.
Figure 7: Deployment of fixed terrestrial 25/3 Mbps services, by area type, 2012–2019
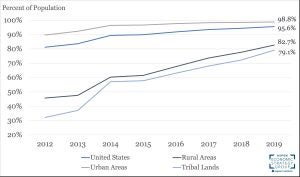
Source: FCC.
The availability of broadband internet is an issue of longstanding interest among policymakers. Moreover, the COVID-19 pandemic further underscored its increasing importance for economic opportunity and education. Figure 7 shows that broadband internet coverage has seen consistent and significant gains in recent years. The Federal Communications Commission (FCC) defines broadband internet by a benchmark download speed of 25 Mbps and an upload speed of 3 Mbps for fixed services. By 2019, 95.6% of Americans had access to fixed terrestrial broadband service, up from 81.2% in 2012. The largest gains over the period took place in rural and tribal areas, although they continue to lag behind urban residents. In 2019, an estimated 14.5 million Americans (4.4%) lacked access to fixed terrestrial broadband, with 11.3 million (17.3%) in rural areas, 846 thousand (20.9%) in tribal lands, and 3.2 million (1.2%) in urban areas (FCC 2016 – 2021).
III. Transportation Infrastructure
The idea that America’s transportation infrastructure is aging and therefore decaying is a common motivation for new physical infrastructure investments. This section highlights relevant facts about the US highway infrastructure that challenge this notion. We also highlight the large differences in the amount of spending on highways across states and the fact that the cost of building new highways has risen over time. For the sake of length, we focus on highways, but refer readers to the work of Duranton, Nagpal, and Turner (2020) for a discussion of the quality and condition of other types of transportation infrastructure, including bridges, bus transit, and subways.
8. The US interstate system is aging, but road conditions are improving.
Figure 8: Average age of US highways and streets vs. share of US interstate miles with the lowest International Roughness Index ratings, 1995–2019
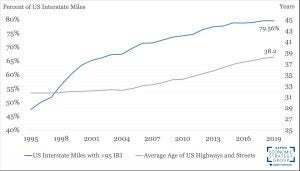
Source: Federal Highway Administration, BEA, author’s calculations. Note: IRI data not available for 2010.
The majority of the US interstate highway system was built between the 1960s and early 1990s. As a result, the average mile of road on an interstate highway is nearly 40 years old. However, this aging does not necessarily reflect a crumbling infrastructure system; highway quality today is as good as ever. Figure 9 illustrates the relationship between the average age of US highways and the percent of US interstates that rate the best in the International Roughness Index (IRI). The IRI was devised by the World Bank in 1986 to create a standardized roughness measurement of roads and highways (TRID 1995).2 IRI ratings can range from less than 60 inches per mile to more than 220 inches per mile, though any rating less than 95 inches per mile is generally considered “good” (MDOT). As shown in Figure 9, despite the aging of the US interstate system, the percentage of US interstate miles with a “good” IRI rating has increased more than 30 percentage points since 1995. Continued federal funding for maintenance and operations (shown in Figure 11) has resulted in smoother highways over time.
9. There are large differences in the level of highway spending per capita across states.
Figure 9: Per capita public highway infrastructure investment by state, 2017
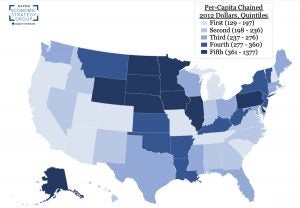
Source: Bennett et al (2019), author’s calculations.
Figure 9 illustrates the variation in per-capita spending by state on highway infrastructure. The range of funding extends from $129 per person in Michigan to ten times that amount ($1,377) in North Dakota. Several of the least populous states in the Midwest and North Central states (Iowa, Minnesota, Nebraska, North Dakota, South Dakota, and Wyoming) are in the highest quintile of states in terms of highway spending per capita. In contrast, states in the western United States, including Arizona, California, Colorado, Oregon, and Utah, are in the bottom quintile of highway spending per capita. Many economists have documented that expected returns to additional highway infrastructure vary significantly across states, with greater returns in more dense areas (Allen and Arkolakis 2019; Poterba and Glaeser 2021). For example, Allen and Arkolakis (2019) find large welfare benefits from additional highway construction in California and in the greater New York City area. However, per-capita spending appears to be more closely related to geographic location rather than to states’ population density.
10. States spend most of their infrastructure funds on operations and maintenance.
Figure 10: Spending on transportation and water infrastructure, by category of spending, 2017
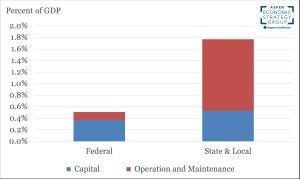
Source: CBO.
Figure 10 shows the breakdown of US transportation and water infrastructure spending across the federal vs. state and local government, after federal grants and transfers to states. The figure also illustrates the different uses of infrastructure funding at different levels of government. The vast majority of state and local funding goes to operations and maintenance rather than new physical infrastructure. Given the maturity of US transportation and water infrastructure, maintenance and operations can be expected to account for a large share of total spending. In fact, total state and local infrastructure spending has increased over time, driven by operations and maintenance. In contrast, the majority of federal funding for transportation and water infrastructure goes to capital investments rather than operations and maintenance.
11. The cost of US highway infrastructure has dramatically increased since the mid-1970s.
Figure 11: Spending per mile of new highway construction, 1955–1993
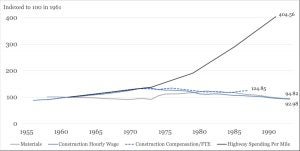
Source: Reproduced from Brooks and Liscow (2020).
An important consideration for policymakers when determining the desired amount of infrastructure is cost. As Poterba and Glaeser (2021) highlight, building infrastructure in the United States is far more expensive than in the rest of the world. Figure 11 focuses specifically on highway construction, illustrating the dramatic increase in cost per new highway mile that occurred between the mid-1970s and the 1990s, when the US interstate system was constructed. Over the period from 1973 to 1991, highway spending per mile increased 193%. Brooks and Liscow (2020) document that increased spending does not correlate with increases in construction wages or the cost of materials, such as concrete, construction machinery, construction sand, paving mixtures, and steel mill products. Over the period, materials prices rose by only 7% and construction hourly wages decreased in real terms by 39%. The authors find increased highway construction costs are positively correlated with increases in incomes and housing values over the same period, as well as an increase in local demands for physical structures to be built along with Interstates that alleviate concerns about noise or other negative externalities.
IV. International Comparisons
A primary motivation among policymakers for dramatically increasing US infrastructure investment is a desire to remain economically competitive with the rest of the world. This section highlights how the United States compares to other countries by some of the metrics discussed above. While it is true that the United States trails other advanced economies in transportation spending, the opposite is true for R&D investment when private sector investments are taken into account. We also highlight the dramatic increase in public investments by China in recent decades.
12. US gross capital formation is in the middle of the pack among advanced OECD economies.
Figure 12a: Government gross fixed capital formation as a share of GDP in advanced OECD countries, 2019
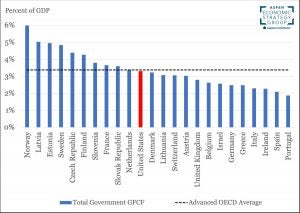
Source: OECD Statistics Datasets 1 & 11 and authors’ calculations. Note: Data for Japan not available for the year 2019.
Figure 12b: Government nondefense gross fixed capital formation in advanced OECD countries, 2019
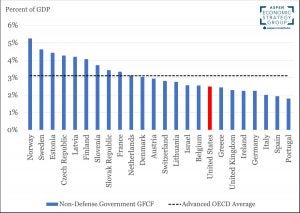
Source: OECD Statistics Datasets 1 & 11 and authors’ calculations.
Figures 12a and 12b compare levels of US fixed capital formation—or investment in productive assets—relative to other advanced OECD countries. In 2019, the United States ranked 11th of 24 in total capital formation among advanced OECD economies when defense investments are included. As Figure 12b shows, the United States falls to 17th among advanced OECD economies when comparing only nondefense investments. The United States ranking among this group has not improved in recent decades: in 2000, the United States ranked 11th in total fixed capital formation and 14th in nondefense fixed capital formation.
13. The United States exceeds China and the OECD average in total R&D investment as a share of GDP.
Figure 13: Total R&D investment (public and private) as a share of GDP in selected countries, 1981–2019
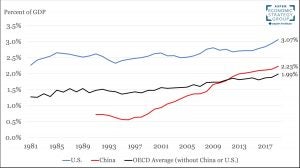
Source: Figure 3 in Van Reenen (2019), OECD, author’s calculations. Note: The OECD defines gross domestic spending on R&D as “the total expenditure (current and capital) on R&D carried out by all resident companies, research institutes, university and government laboratories, etc., in a country.” It includes R&D funded from abroad, but excludes domestic funds for R&D performed outside the domestic economy.
Figure 13 illustrates overall R&D investment in the United States, China, and the OECD average, excluding China and the United States. Although federal funding for R&D in the United States has been declining, the private sector’s contribution places the United States above the OECD average as a share of GDP. Despite being above average, the United States invests less in R&D than some advanced economies as a percentage of GDP. South Korea leads the OECD overall, investing nearly 5% of its economy into R&D in 2019. Germany and Japan also exceed the United States in R&D investment as a share of their economies.
China has experienced rapid growth in R&D investment since the mid-1990s, outpacing its overall economic growth and rising to 2.2% of its economy by 2019. The country’s total R&D investment when measured in constant dollars increased by an average of 14% per year between 1991 and 2019.
Among the four largest western economies—the United States, Germany, the United Kingdom, and France—only Germany has made a meaningful increase in R&D investment as a share of its economy since 2000, increasing investment by 2.7% per year.
14. Transportation infrastructure spending as a share of GDP is far higher in China than in the United States or the OECD average.
Figure 14: Transportation infrastructure across select economies, 1995–2019
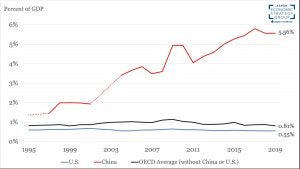
Source: OECD.
Figure 14 shows investment in transportation infrastructure, including both new structures and maintenance, as a share of GDP across advanced economies. Although the initial stock of infrastructure varies by country, China far outpaces other advanced economies in both the share and level of transportation investment. The United States also trails most other advanced OECD countries in transportation infrastructure investment. At just 0.6% of GDP, the United States lags behind France, Germany, Japan, Korea, and the United Kingdom in transportation infrastructure investment as a share of their economies.
The data underlying these figures are available for download here.
1 See Expanding Economic Opportunities for More Americans
2 According to the FHWA, a road’s IRI rating is “calculated from a single longitudinal profile measured with a road profiler in both the inside and outside wheelpaths of the pavement. The average of these two IRI statistics is reported as the roughness of the pavement section.” (FWHA).