Seven Recent Developments in US Science Funding

Over the past century, scientific research and development (R&D) has fueled US economic and military might and propelled the country’s status as a global superpower. These investments have helped to launch not only the technologies that define modern life, including the internet, mobile and personal computing, and artificial intelligence, but also the healthcare advances that have extended US life expectancy by nearly 20 years, including vaccines, diagnostic technologies, and novel drug therapies. As Ben Jones described in a 2021 AESG paper, the returns on publicly funded scientific investment are substantial: “effectively, the science and innovation system is akin to having a machine where society can put in $1 and get back $5 or more.”
Vannevar Bush’s influential 1945 report Science: The Endless Frontier laid the original groundwork for a national science strategy premised on the idea of a triangular partnership among government, academia, and the private sector—rather than a strategy that concentrates research activity within the federal government (Isaacson, 2019). That informal partnership largely remains intact today and is reflected in the billions of dollars the National Institutes of Health (NIH) grants each year to academic institutions for medical research; in organizations such as the Defense Advanced Research Projects Agency (DARPA), which produces breakthrough technologies in partnership with industry and academia; and in the National Science Foundation (NSF), which funds roughly a quarter of the basic research conducted at US colleges and universities. But much about the national strategy has also changed—as have its results.
The landscape for scientific funding has evolved since its early days and now comprises a complicated array of government agencies, private ventures, and partnerships between the two. This report casts light on the current state of US science funding and the institutions that support that funding, highlighting seven ways in which the size, composition and structure of US scientific research and development have developed since Vannevar Bush’s seminal report. What emerges is a portrait of the complicated arrangements that extend across the federal government, the business sector, higher education, and nonprofits.
1. The United States leads the world in gross R&D domestic investment, but China is quickly narrowing that gap.
US national R&D investment is the highest in the world. At over $700 billion in 2020, US R&D expenditures exceed those of Japan, Germany, South Korea, France, India, the United Kingdom, and Russia, combined. But China is closing the gap. As demonstrated in Figure 1A, which charts gross domestic expenditures on R&D by country in billions of PPP dollars (left axis) and as a share of GDP (right axis), total Chinese annual R&D investment exceeded $500 billion as of 2019—the latest year for which comparable data are available. China’s R&D investment has accelerated over the past decade, growing at an average annual rate of 10.6 percent, roughly twice that of the United States over the same period (see Figure 1B). Meanwhile, South Korea and Taiwan, both small, technologically advanced countries, lead the world in R&D investment when measured as a share of GDP.
Figure 1a. Gross Expenditures on R&D (GERD) and R&D Intensity,
Top 17 Countries, 2019 or Most Recent Data Year
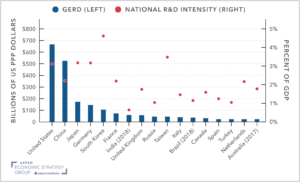
Source: National Science Board, National Science Foundation (2022).
Figure 1b. Gross Domestic Expenditures on R&D by Selected Country, 1990–2019
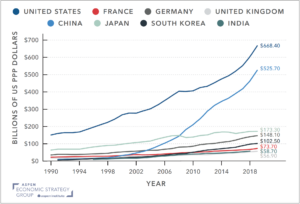
Source: National Center for Science and Engineering Statistics (2022).
2. Over the past 30 years, business R&D investment has accelerated while federal investment has plateaued.
Seventy-three percent of American R&D investment is funded by the business sector, which receives tax benefits designed to incentivize such investments. As demonstrated in Figure 2, business investment in R&D accelerated between 2010 and 2020, growing at a pace of roughly 5.8 percent per year, and reached $517 billion (current dollars) in 2020, nearly four times the amount of federal R&D funding, which has remained relatively flat over the past decade. As a result, federal R&D funding has not kept pace with economic growth and stands near a 60-year low when measured as a share of the overall economy (see Ganz and Vincent, 2021). These trends are noteworthy since business-funded investment tends to favor later-stage R&D while federal investment is more likely to support early-stage, exploratory research. However, direct federal expenditures represent only a portion of total federal support for R&D. Tax subsidies for research expenditures, most notably the R&D tax credit, are expected to total more than $80 billion over 2020-2024 (Joint Committee on Taxation, 2020). The non-profit and higher education sectors meanwhile fund a relatively small share of total R&D expenditures, accounting for $53 billion (current dollars) in 2020.
Figure 2. US R&D Expenditures by Funding Source, 1990–2020
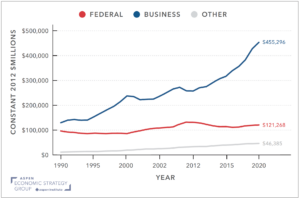
Source: National Center for Science and Engineering Statistics (2022).
3. The federal government is the largest source of funding for basic science R&D, but the business sector is the largest source for applied R&D.
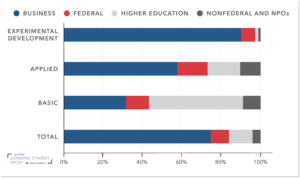
Figure 3. R&D Funding by Type of Funding and Sector, 2019
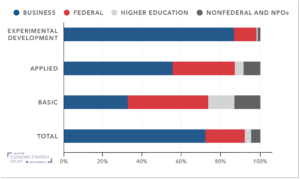
Source: National Center for Science and Engineering Statistics (2022); authors’ calculations.
Figure 3 disaggregates R&D by type of research—applied, basic, or experimental development. Each type of research entails a different risk profile in search of different goals. While applied research is directed toward a specific objective or application, basic research is more flexible: results are not committed toward any particular application. Experimental development meanwhile applies existing research, knowledge, and experience to new products, processes, or improvements (NCSES, 2022).
Figure 3 also disaggregates R&D by sector—business, the federal government, higher education, and nonprofits—and demonstrates that the three types of research draw their funding from the various sectors in significantly different proportions. For instance, the federal government is the largest source of funding for basic research (41 percent of the total), followed by the business sector (33 percent), while higher education and nonprofits each contribute around 13 percent of the total. In contrast, business funds the majority of applied research (55 percent), followed by the federal government (32 percent), with the remaining share (13 percent) coming from higher education and nonprofits combined. Finally, the business sector funds 87 percent of all experimental development while the government funds just 11 percent of the total.
The changing composition of the funding landscape in recent decades has shifted the composition of R&D being performed. Increases in the business sector’s contribution to total R&D funding over the past decade has led to a 76 percent increase in applied research, as compared against a 42 percent increase in basic research over the same period.
4. The higher education sector is the largest performer of basic science R&D in the United States.
Figure 4. R&D Performance by Type of Funding and Sector, 2019
Source: National Center for Science and Engineering Statistics (2022) and authors’ calculations.
R&D performance differs from R&D funding. In the triangular partnership between business, government, and higher education, the business sector performs three quarters of total R&D,[1] followed by higher education (12 percent) and the federal government (9 percent).
Among the total R&D performed by businesses in 2019, nearly 60 percent was spent on manufacturing, including pharmaceuticals, computers, and electronics. The information industry (22 percent) represented much of the remaining spending (Wolfe, 2021).[2] In contrast, the federal government spends most of its R&D funding on medicine and life sciences, space, defense, and energy.
The distribution of funding within each source is not consistent across research types. Higher education performs the greatest share of basic research (48 percent), followed by business (32 percent), the federal government (12 percent), and nonprofits (9 percent). Of the basic research performed by higher education, just over half is funded by the federal government.
The majority of R&D performed by the higher education sector is spent on life sciences (56 percent), followed by engineering (15 percent), physical science (6 percent), geosciences (4 percent), social science (3 percent), and computer science (3 percent) (Gibbons, 2021; NCSES, 2022).[3] Within the life sciences investment, health-related R&D comprised 56 percent of the total.
5. The Department of Defense accounts for the largest share of federal R&D investment, followed by the NIH, the Department of Energy, and the National Aeronautics and Space Administration.
Figure 5. Federal R&D Funding by Agency, 2022 ($millions)
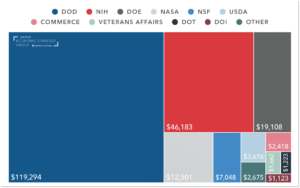
Source: Congressional Research Service (2023).
Figure 5 depicts the distribution of federal R&D appropriations across federal agencies. Five agencies receive 95 percent of federal R&D funds.
The Department of Defense (DOD) maintains the largest R&D[4] budget at just under $120 billion,[5] constituting around 55 percent of total federal R&D funding. Fifty-five percent ($65.4 billion) of the DOD’s budget is allocated to experimental development activities, which includes larger-scale experimental hardware development, prototypes, and proof-of-concept designs. Non-experimental development, which supports system improvements in existing operational systems, receives 37 percent ($44.2 billion) of DOD R&D funding. DARPA, which is widely celebrated for its contributions to the creation of the internet, GPS, voice recognition, Moderna’s COVID-19 vaccine, among countless other breakthrough technologies, has an annual budget of $3.9 billion in 2022, which is less than 4 percent of the total spent on R&D by DOD.
The NIH receives just over 20 percent of all federal R&D funding, the most of any government agency. This appropriation is allocated across 24 different research institutes. The largest funding recipients within the NIH are the Institutes for Cancer ($6.9 billion), Allergy and Infectious Diseases ($6.3 billion), and Aging ($4.2 billion).
The Department of Energy (DOE) received $19.1 billion for fiscal year 2022, allocated across four offices and administrations and to four additional energy programs. Among those offices, the Office of Science, which funds physical sciences research, and the Office of Energy Efficiency and Renewable Energy (EERE), which focuses on renewable energy, low carbon transportation, manufacturing, and weatherization, received the bulk (71 percent) of DOE’s federal R&D funding. The CHIPS and Science Act appropriated approximately $30.5 billion in new funding to the DOE over the next five years for basic and applied energy research.
The National Aeronautics and Space Administration (NASA) received $12.5 billion for fiscal year 2022, 6 percent of the total federal R&D budget. Over 60 percent ($7.5 billion) is allocated toward “Science,” which includes funding for the recently employed James Webb Space Telescope. Another 23 percent ($2.9 billion) is allocated toward deep space exploration and operation programs.
Of the $7 billion allocated to the NSF, the overwhelming majority (81 percent) is used to fund “Research and Related Activities” (R&RA), which includes early-stage research across all areas of science technology and engineering and mathematics (STEM) (NSF, 2021). The CHIPS and Science Act allocates substantial new resources ($20 billion over baseline over the next five years) to the NSF to establish a new Directorate for Technology, Innovation, and Partnerships (TIP) to accelerate translational research and support STEM-related workforce development. The CHIPS and Science Act also provides an additional $16 billion over baseline over the next five years for basic research and programs to develop the STEM workforce.
The Department of Agriculture allocates most of its $3.7 billion R&D budget to the Agriculture Research Service ($1.8 billion), USDA’s in-house basic and applied research agency, and to the National Institute of Food and Agriculture ($1.6 billion), USDA’s principal extramural research agency that partners with education institutions, private organizations, and individuals to conduct projects and research. The remainder of the agricultural R&D budget is allocated to the National Agricultural Statistics Service and the Economic Research Service.
The Department of Commerce splits its $2.4 billion R&D budget between two of its major agencies: the National Institute of Standards and Technology (NIST) and National Oceanic and Atmospheric Administration (NOAA). NIST research provides measurement, calibration, and quality assurance techniques to support US commerce, while NOAA produces research relating to ecosystems, atmosphere, and global climate change. The CHIPS and Science Act allocates an additional $2.8 billion over the next five years to research conducted by NIST (Department of Commerce, 2022).
The federal government also provides R&D funding to the Department of Veterans Affairs ($1.6 billion), the Department of Transportation ($1.2 billion), and the Department of the Interior ($1.1 billion). Included in the $2.7 billion funding represented in the “Other” category in Figure 5 are allocations for the Environmental Protection Agency ($781 million), the Department of Homeland Security ($664 million), the Department of Education ($405 million), and the Smithsonian Institution ($332 million).
6. Since the late 2000s, federal expenditure on R&D has shifted toward tax incentives and away from direct financing.
The research and development tax credit, first enacted in 1981 under the Economic Recovery Tax Act, was made permanent in 2015. The credit is calculated based on the change in a firm’s R&D expenses over a defined period, rather than on its gross R&D expenses. As Bloom et al. (2019) highlight, this method enshrines the United States among the bottom third least generous of Organisation for Economic Co-operation and Development (OECD) member countries. US tax incentives reduce the cost of R&D spending by an average of 5 percent, as compared to the 30 percent subsidy in countries with the most generous tax regimes.
Nevertheless, the Joint Committee on Taxation estimates the cost of government tax support for R&D rose from $9.5 billion in 2000 to $22.1 billion in 2018, as measured in 2015 constant dollars. According to the OECD (2021), 91 percent of the total tax subsidy credit is awarded to firms with gross receipts in excess of $50 million. Surveying the literature on the effectiveness of R&D credits, Hall (2019) concludes “that they are generally effective at increasing business R&D, with a price elasticity of minus one.” That is, each dollar of tax revenue foregone increases R&D spending by approximately a dollar.
Figure 6. Direct Funding of Business R&D and Tax Incentives for R&D in the United States, 2000–2018
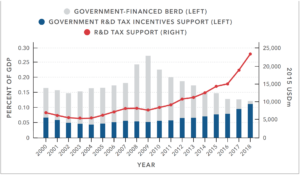
Source: Chart recreated from OECD (2021).
7. Funders now employ a variety of traditional and newer mechanisms to select projects and scientists for funding.
While the federal government funds $160 billion in R&D each year, there remains significant debate over how to maximize that investment’s effectiveness. A substantial share of this funding, including an estimated 95 percent of academic medical research (Guthrie et al., 2018), is allocated through agency-led peer review processes at institutions such as the NIH and NSF. But various institutions have developed alternative models in response to recognized weaknesses in the traditional peer review model. Table 1 highlights the distinguishing features of four prominent project selection models, including the peer review model.
Table 1. Project Selection Models
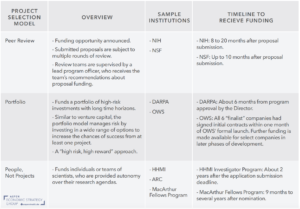
Sources: NIH (2021a); National Science Foundation (n.d.); Bonvillian (2020, 2021); Congressional Research Service (2021a, 2021b); GAO (2021); HHMI (2022); ARC (n.d.); MacArthur Foundation (2022).
1. Peer Review
The peer review model is a bureaucratic review process used to solicit and to select proposals for specific projects. After applications for a particular project are opened, submitted proposals are subjected to multiple rounds of expert review. Review teams are supervised by a lead program officer, who receives the team’s recommendations about proposal funding. If a lead program officer or Director recommends the proposal for award, some agencies will then require a review of business, financial, and policy implications. Once the review is completed, a final decision is made to fund or decline the proposal.
The peer review system’s weaknesses are well-known: the process is time-intensive (Publons, 2019); the burden of which falls on applicants who may or may not receive funding (Rockwell, 2009; Guthrie et al., 2018; Herbert et al., 2013); and there is evidence of bias against the most innovative research and in favor of older or previously funded researchers (Luukkonen, 2012; Ayoubi et al., 2021). While the peer review process outperforms random assignment of science funding, it is a weak predictor of future research performance in some research sectors (Guthrie et al., 2018; Fang et al., 2016). And these critiques are not unique to the United States. In Canada, for example, researchers have observed that the cost of peer review is greater than the cost of awarding all qualifying scientists a $40,000 grant (Gordon and Poulin, 2009).
Researchers (Ricón, 2021; Fang and Casadevall, 2016) have proposed modifying the peer review system by instituting a lottery in instances where the supply of qualified applications exceeds the available funding. Proponents of these modified lottery systems emphasize the mixed results of the peer review process at generating innovative research and highlight that a quasi-randomized system could substantially reduce reviewer bias, improve grantee diversity, and expedite the selection process. The idea has gained momentum internationally, with notable institutions such as the Health Research Council of New Zealand and the Swiss National Science Foundation becoming the latest to experiment with the process (Adam, 2019).
2. Portfolio
The portfolio approach, used most notably by DARPA and Operation Warp Speed (OWS), is geared toward generating new ideas to address novel problems. Unlike the peer review process, the portfolio approach simultaneously funds a variety of projects working to solve the same problem. By investing in a wide range of options (a “portfolio”), organizations increase the chance that at least one project will prove successful, while also accepting the risk that more projects will likely fail. Unlike the peer review model, the portfolio approach encourages funding organizations to invest in “risky” proposals that may otherwise be rejected.[6] Organizations that use the portfolio approach often employ a flat, non-hierarchical structure, allowing them to expedite the project selection process.
DARPA is one of the more prominent examples of an organization using the portfolio approach. Established in 1958 as an agency of the DOD, DARPA aims to maintain and to advance US technical superiority (Congressional Research Service, 2021b). The agency is composed of a Director, a Deputy Director, and approximately 100 program managers (PMs), each of whom serve five-year appointments to create and oversee ambitious R&D programs. Programs that are approved by the Director and Deputy Director are then issued budgets, and a PM next solicits, reviews, and selects proposals for the program’s various components. Once funding recipients are selected, the PM then plays a supervisory role throughout the project’s duration. PMs may supervise more than one program at a time, and programs typically last between three and five years. While the PM can often take over a year to research and to design programs, performers typically receive funding around six months after proposals are submitted.
OWS, an interagency partnership between the DOD and the Department of Health and Human Services (HHS) created by the Trump administration in 2020 to facilitate and accelerate the development, manufacture, and distribution of COVID-19 vaccines, also used the portfolio approach. Organizationally, OWS functioned like an accelerated version of the DARPA model, selecting multiple firms to receive funding for vaccine research and development (Bonvillian, 2021). However, unlike DARPA, OWS guaranteed the purchase and distribution of the firms’ final product. These guaranteed purchases were instrumental in accelerating vaccine development, but also required that the government incur substantial financial risk. By March 2021, OWS had issued $18.2 billion in contracts for vaccine development and production, in addition to over $950 million for ancillary COVID-19 supplies (GAO, 2021; Congressional Research Service, 2021a). But OWS ultimately delivered vaccines at scale in unprecedented time—by January 2021, only eight months after the program’s launch, five of the six contracted vaccine manufacturers had begun commercial manufacturing, and by month’s end these companies had released 63.7 million doses of the vaccine.
3. People, Not Projects
The “people, not projects” approach focuses the selection process on scientists, rather than on specific projects. It is currently favored by a variety of non-government agencies. For example, The Arc Institute selects “Core Investigators” for renewable, eight-year appointments to operate fully funded labs. Investigators have complete autonomy over their research agenda and “pursue their very best research ideas in accordance with their own judgment, regardless of short-term risk” (ARC). The Howard Hughes Medical Institute (HHMI) adopts a similar approach: HHMI investigators receive renewable seven-year appointments that confer flexible funding for salary, lab staff, and equipment at their primary research institutions. Likewise, the MacArthur Award is a $650,000, “no strings attached” grant to “talented individuals who have shown extraordinary originality and dedication in their creative pursuits,” and does not require that recipients affiliate with any particular institution during their fellowship (MacArthur, 2022).
The “people, not projects” approach removes short-term pressures for recipients to reach specific goals within limited timeframes, and instead allows them substantial freedom to construct their own research agendas, enabling them to explore ideas that may not be funded by traditional project selection models. However, critics highlight that the approach, much like the peer review model, tends to favor already prominent researchers. It also often leaves them with little or no accountability for the work they produce (Ioannidis, 2011; Ricón, 2020).
Conclusion
The triangular partnership that Vannevar Bush envisioned between government, academia, and the private sector to fund US research and development lives on today in an ever-evolving form and at ever-increasing scale. As Chinese expenditures come to rival American investment, understanding the dynamics of R&D funding will be critical to efficiently allocating resources, and to developing new approaches that address some of the peer review model’s drawbacks, including its potential for sluggishness. Recent successes such as Operation Warp Speed provide cause for continued optimism that US innovation will continue as the preeminent source of scientific breakthroughs and widespread economic prosperity.
[1] Dollar amounts in this section are listed in constant 2012 $millions.
[2] Data from Wolfe (2021) is extracted from the 2019 Business Enterprise Research and Development Survey and dollar amounts carry minor discrepancies with data used in Figures 3 and 4.
[3] Data from Gibbons (2021) is extracted from the 2019 Higher Education Research and Development Survey and dollar amounts carry minor discrepancies with data used in Figures 3 and 4.
[4] The R&D budget for the Department of Defense discussed here refers to funding appropriated in Title IV, “Research, Development, Test, and Evaluation” (RDT&E). For consistency, we refer to “RDT&E” as “R&D” throughout this section.
[5] The DOD’s total R&D budget in Figure 5 includes funding for all budget activities (6.1-6.8) under Title IV. The OMB does not count 6.7 and 6.8 as R&D. For this and other reasons, the total R&D amount discussed in this section does not align with total federal R&D investment figures used elsewhere in this report.
[6] The newest of the NIH’s programs, the Advanced Research Projects Agency-Health, which aims to undertake “agile, risky, transformational biomedical research projects,” is using a DARPA-like portfolio model to fund projects rather than the traditional NIH peer review process in order to better “establish a culture of championing innovative ideas” (AAAS, 2021; NIH, 2021).