Archives: Publications
These are AIESG Publications
Figure 5: Marginal Value of Public Funds (Ratio of Benefits to Net Government Costs), by Age of Beneficiary
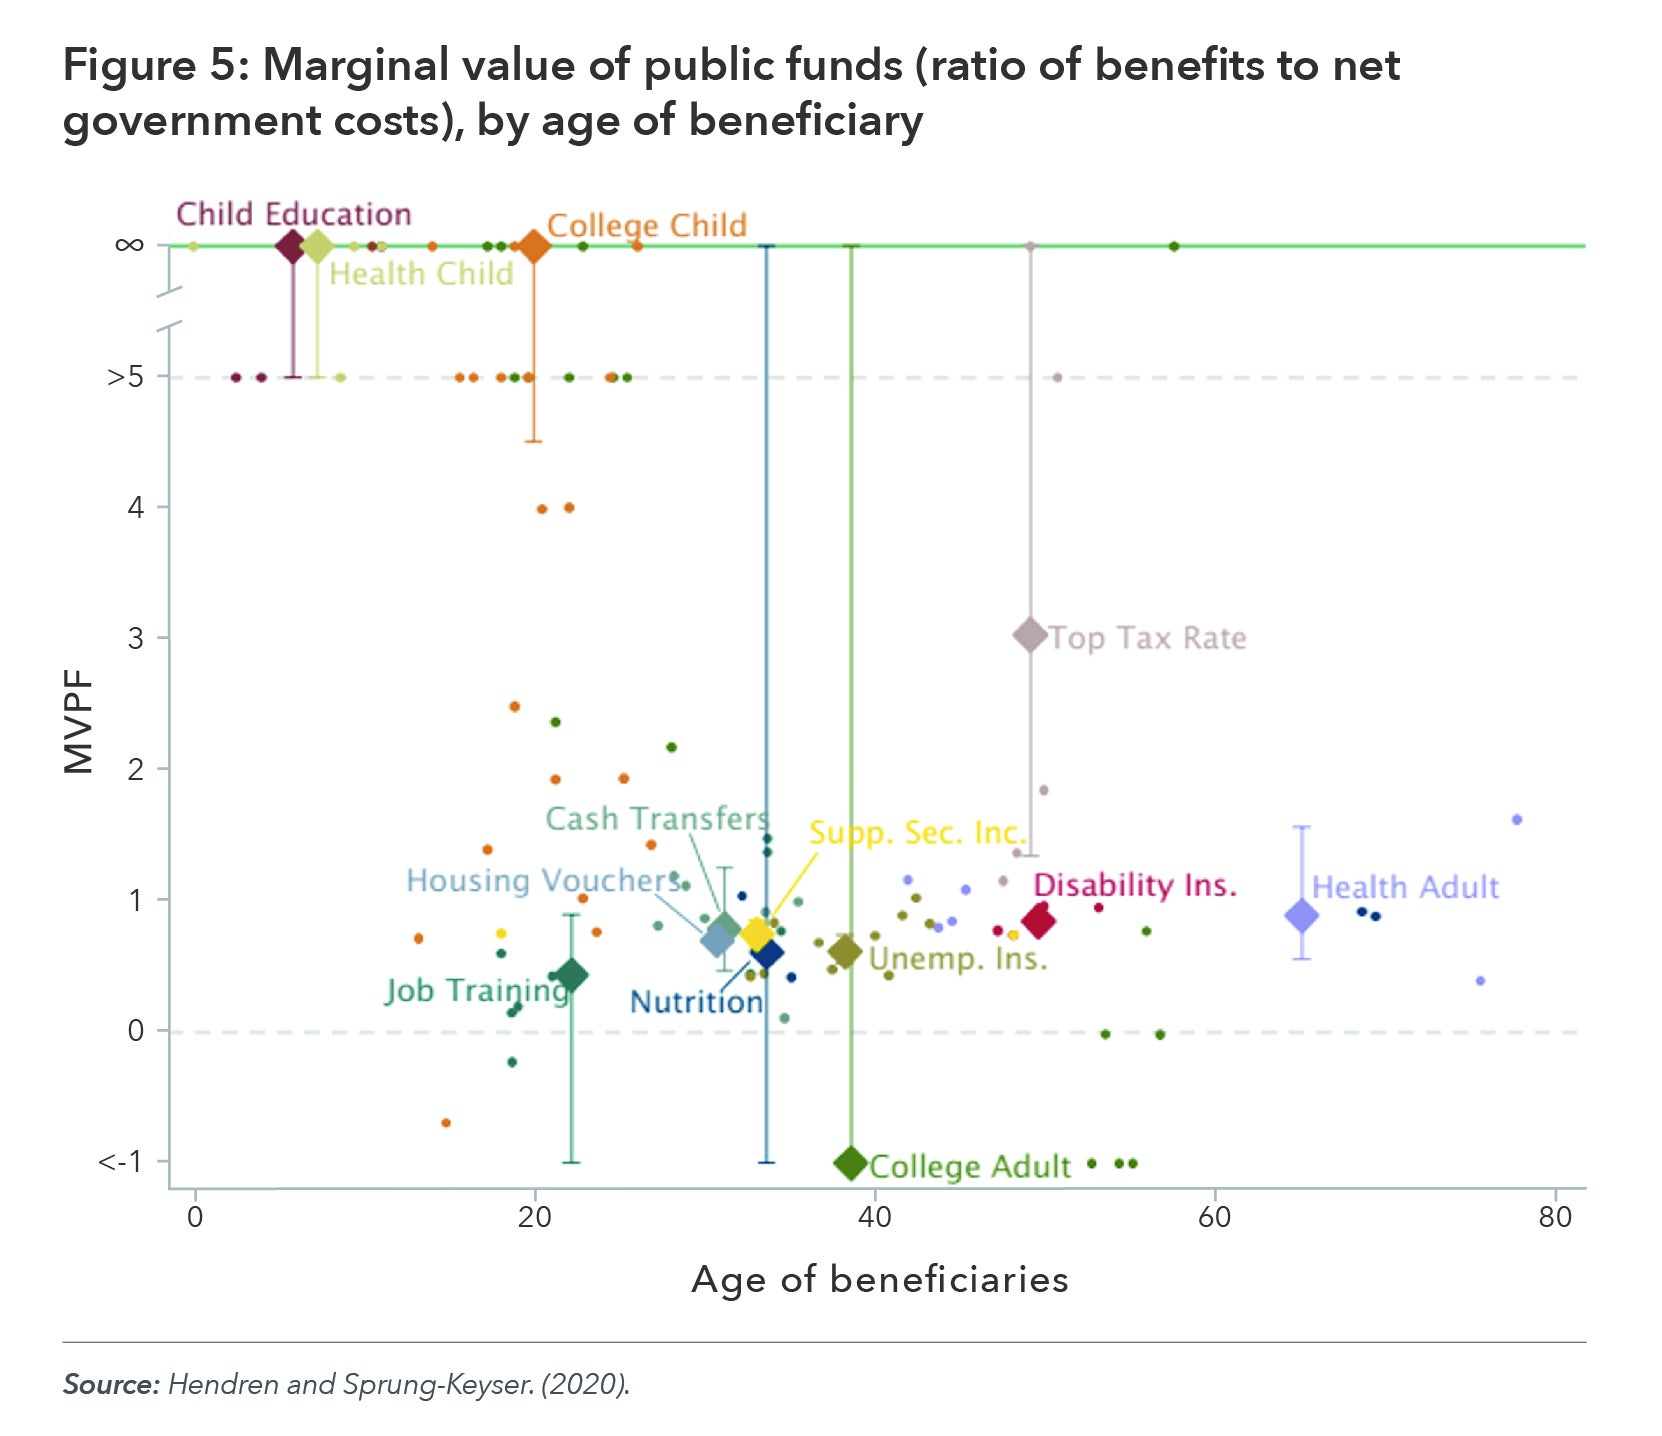
Figure 4: Share of US Electronics Imports for China and Vietnam, 2010-2021
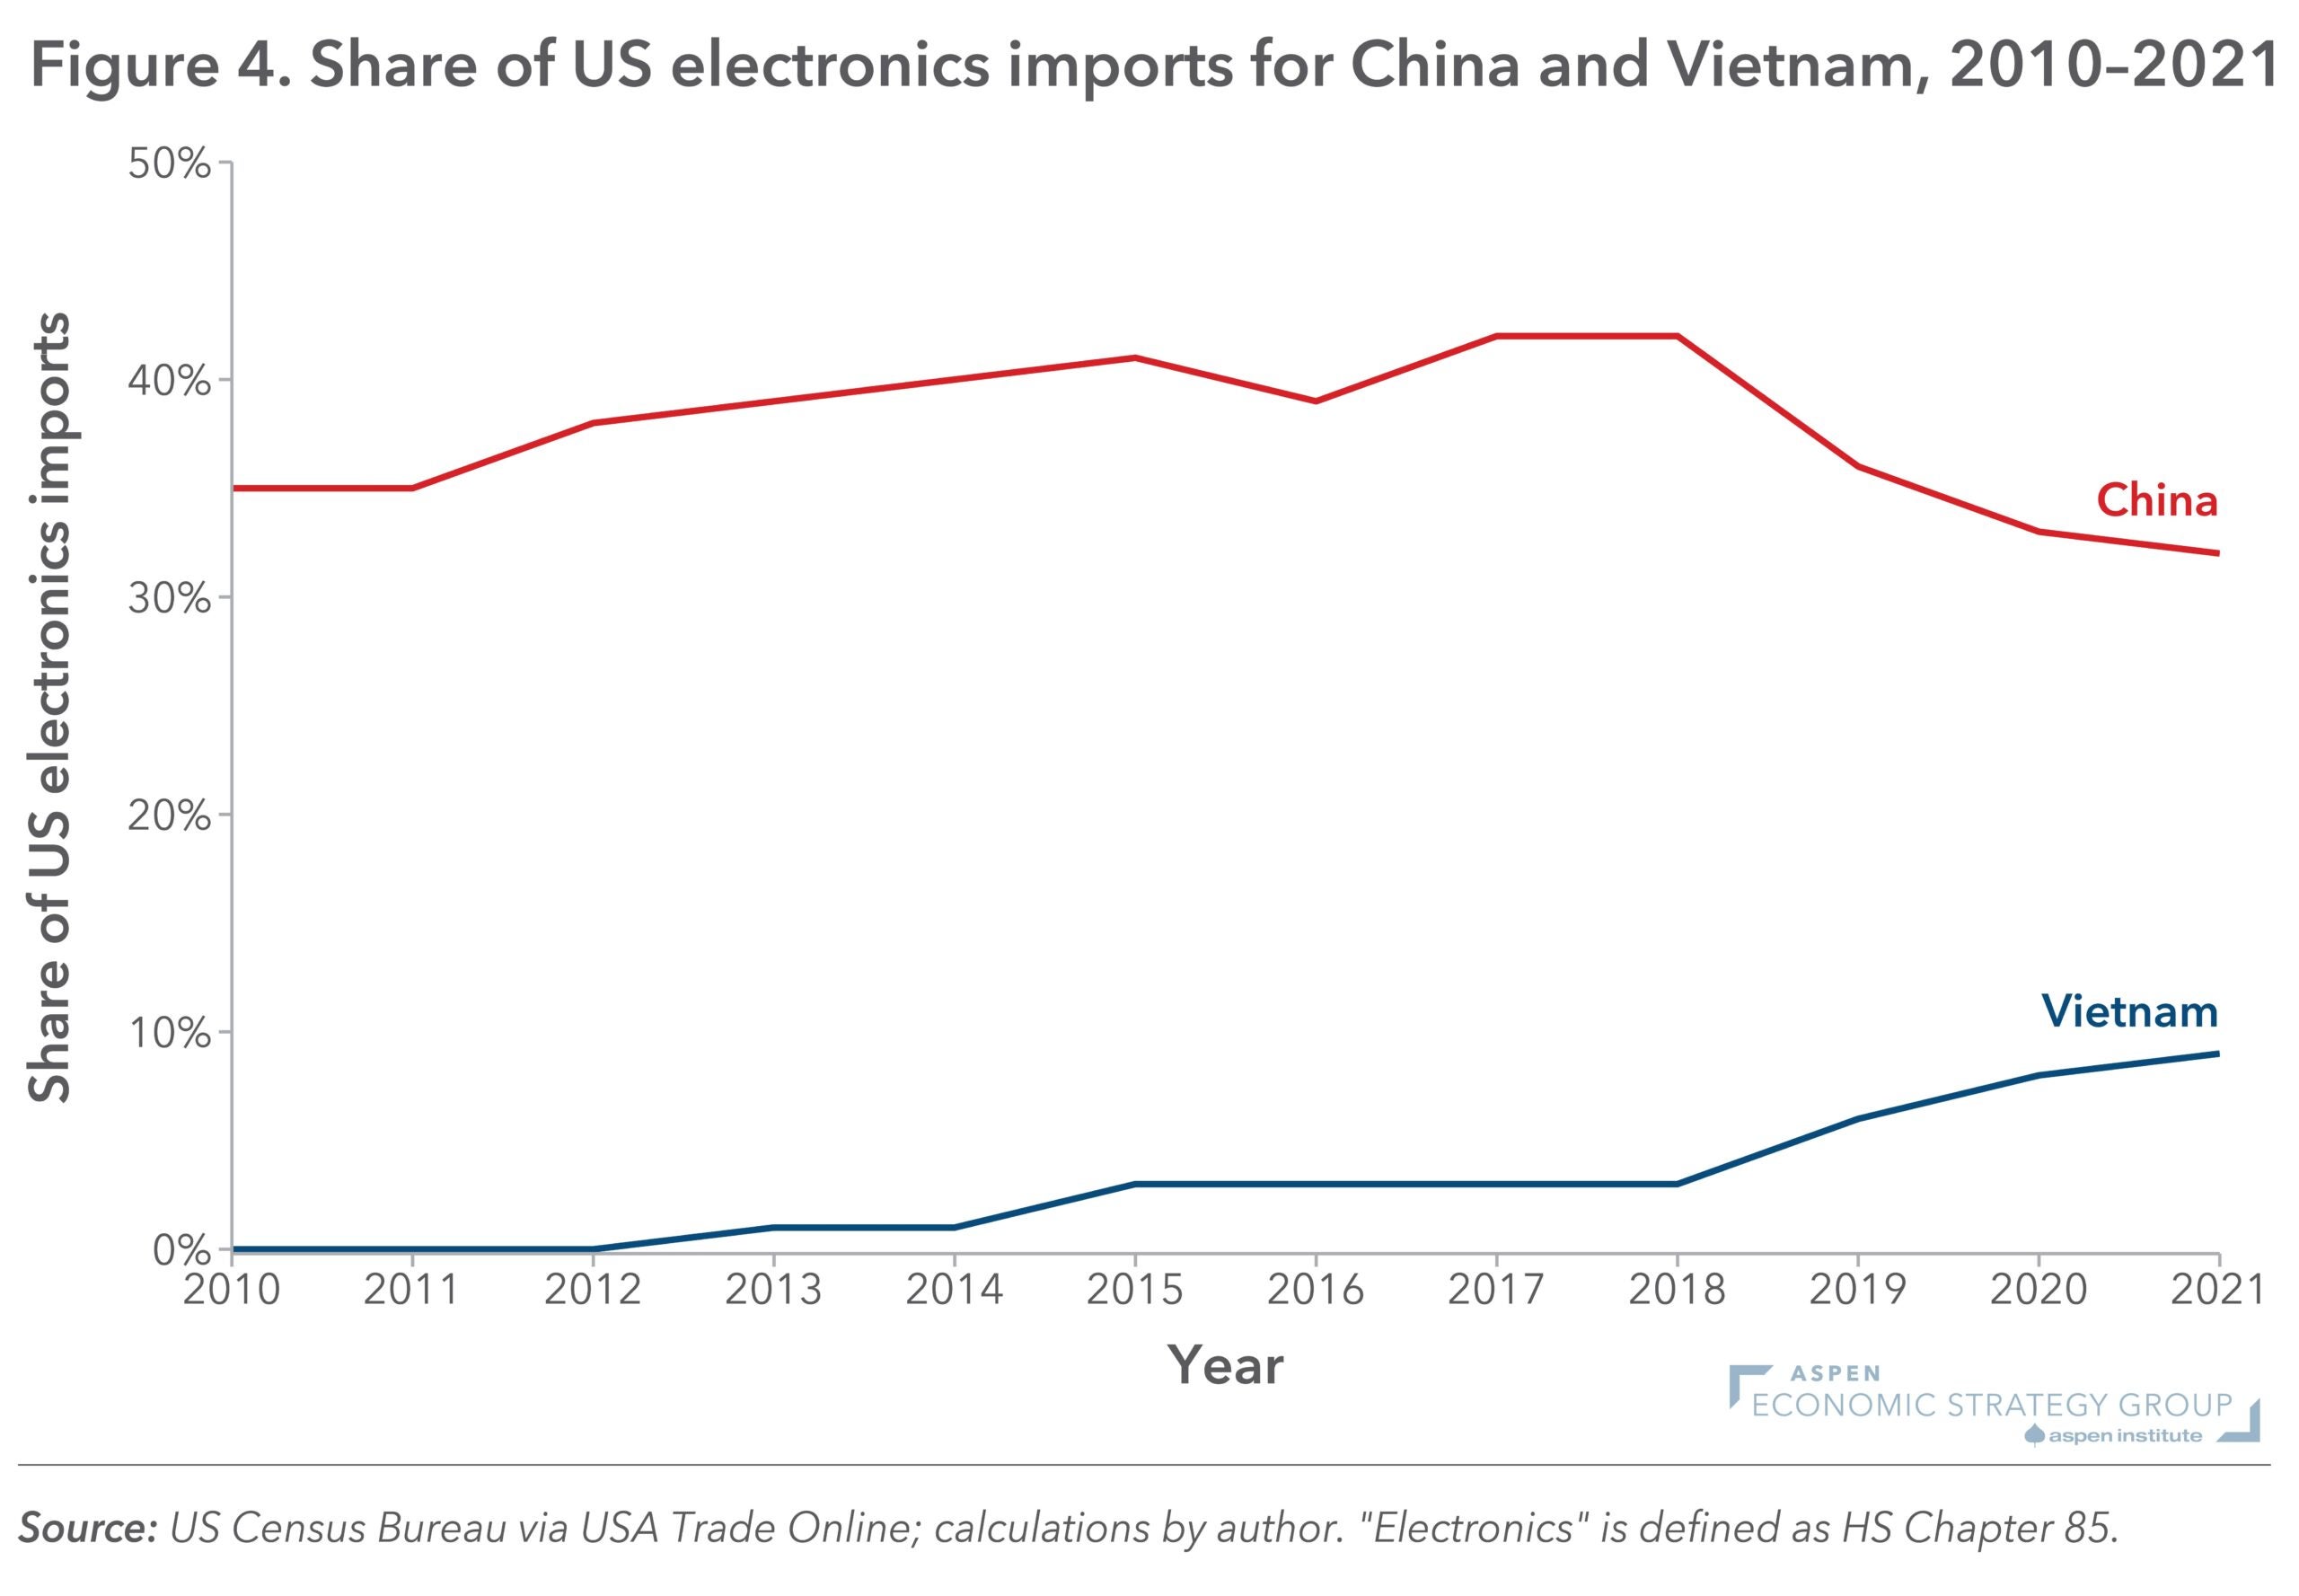
Figure 9: Evolutions of TFP Growth Rates for Selective Economies as a Function of their Relative Per Capita GDP to the US
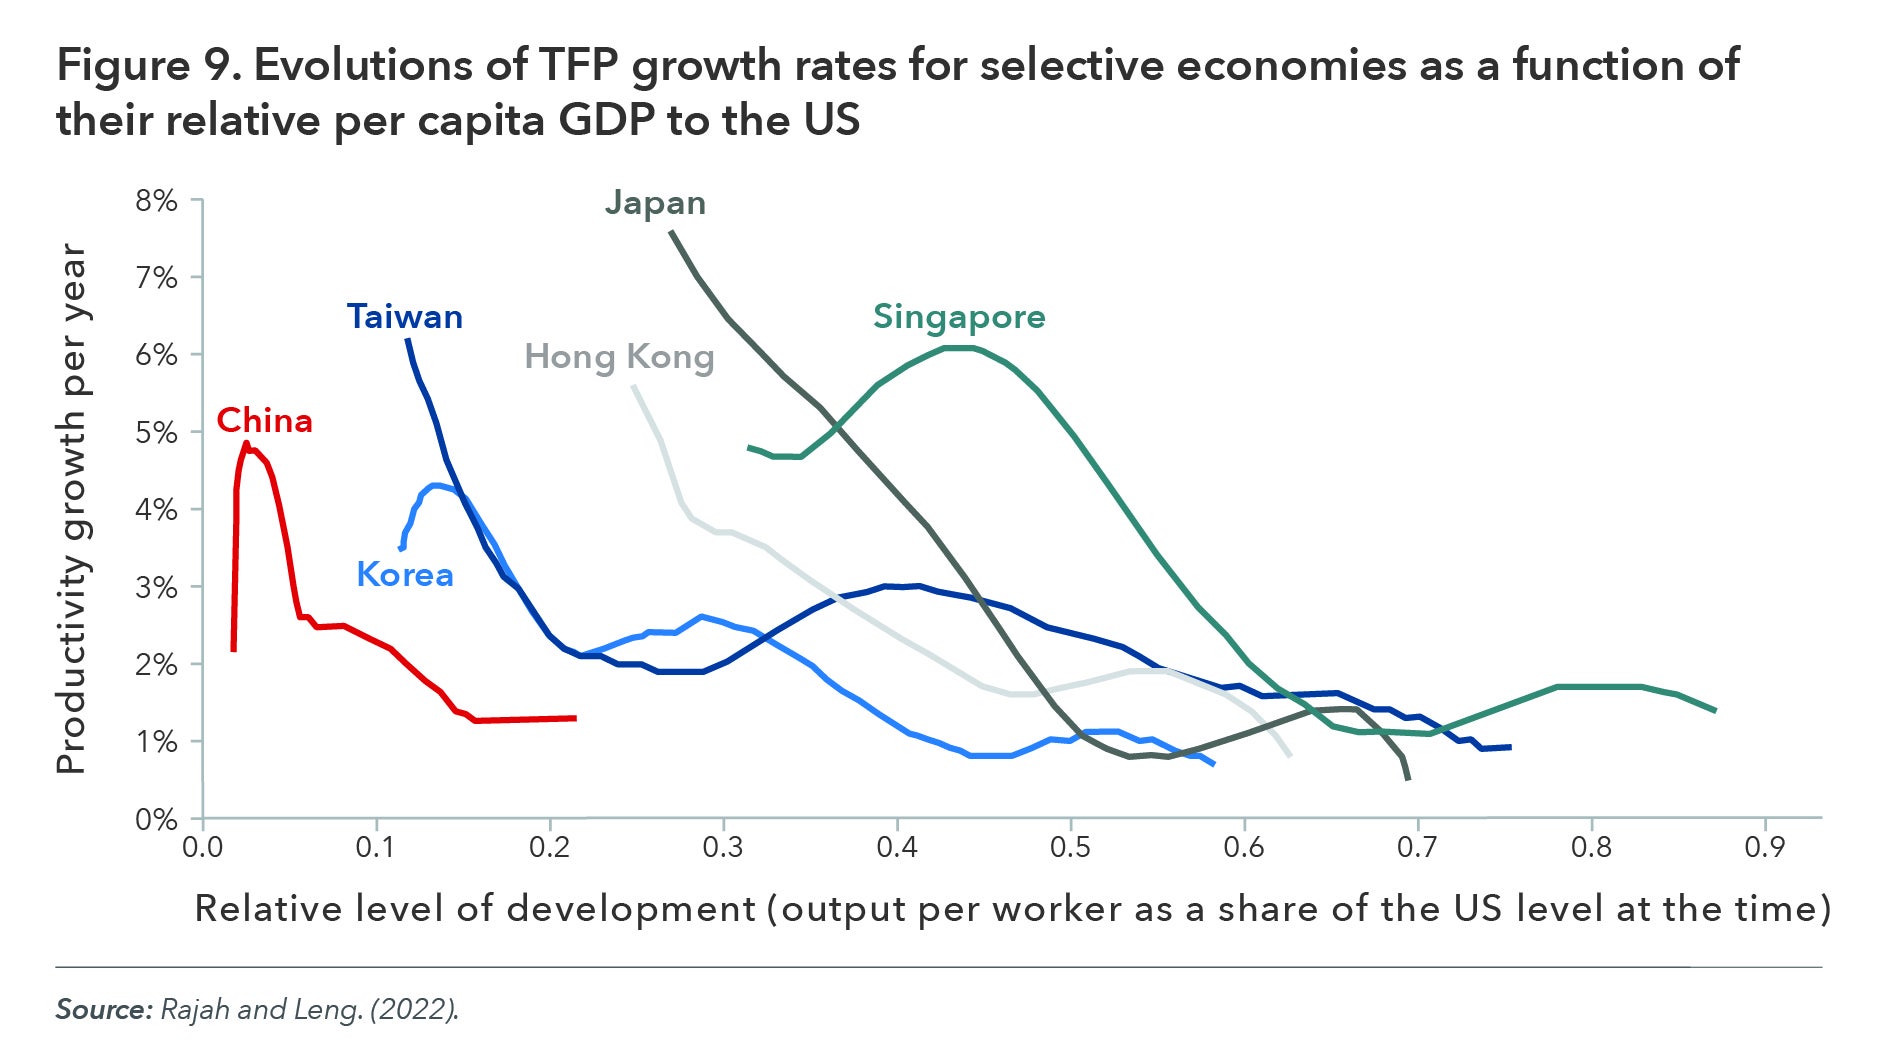
Figure 6: Different vintages of federal noninterest spending and revenues projections, 2000-2053
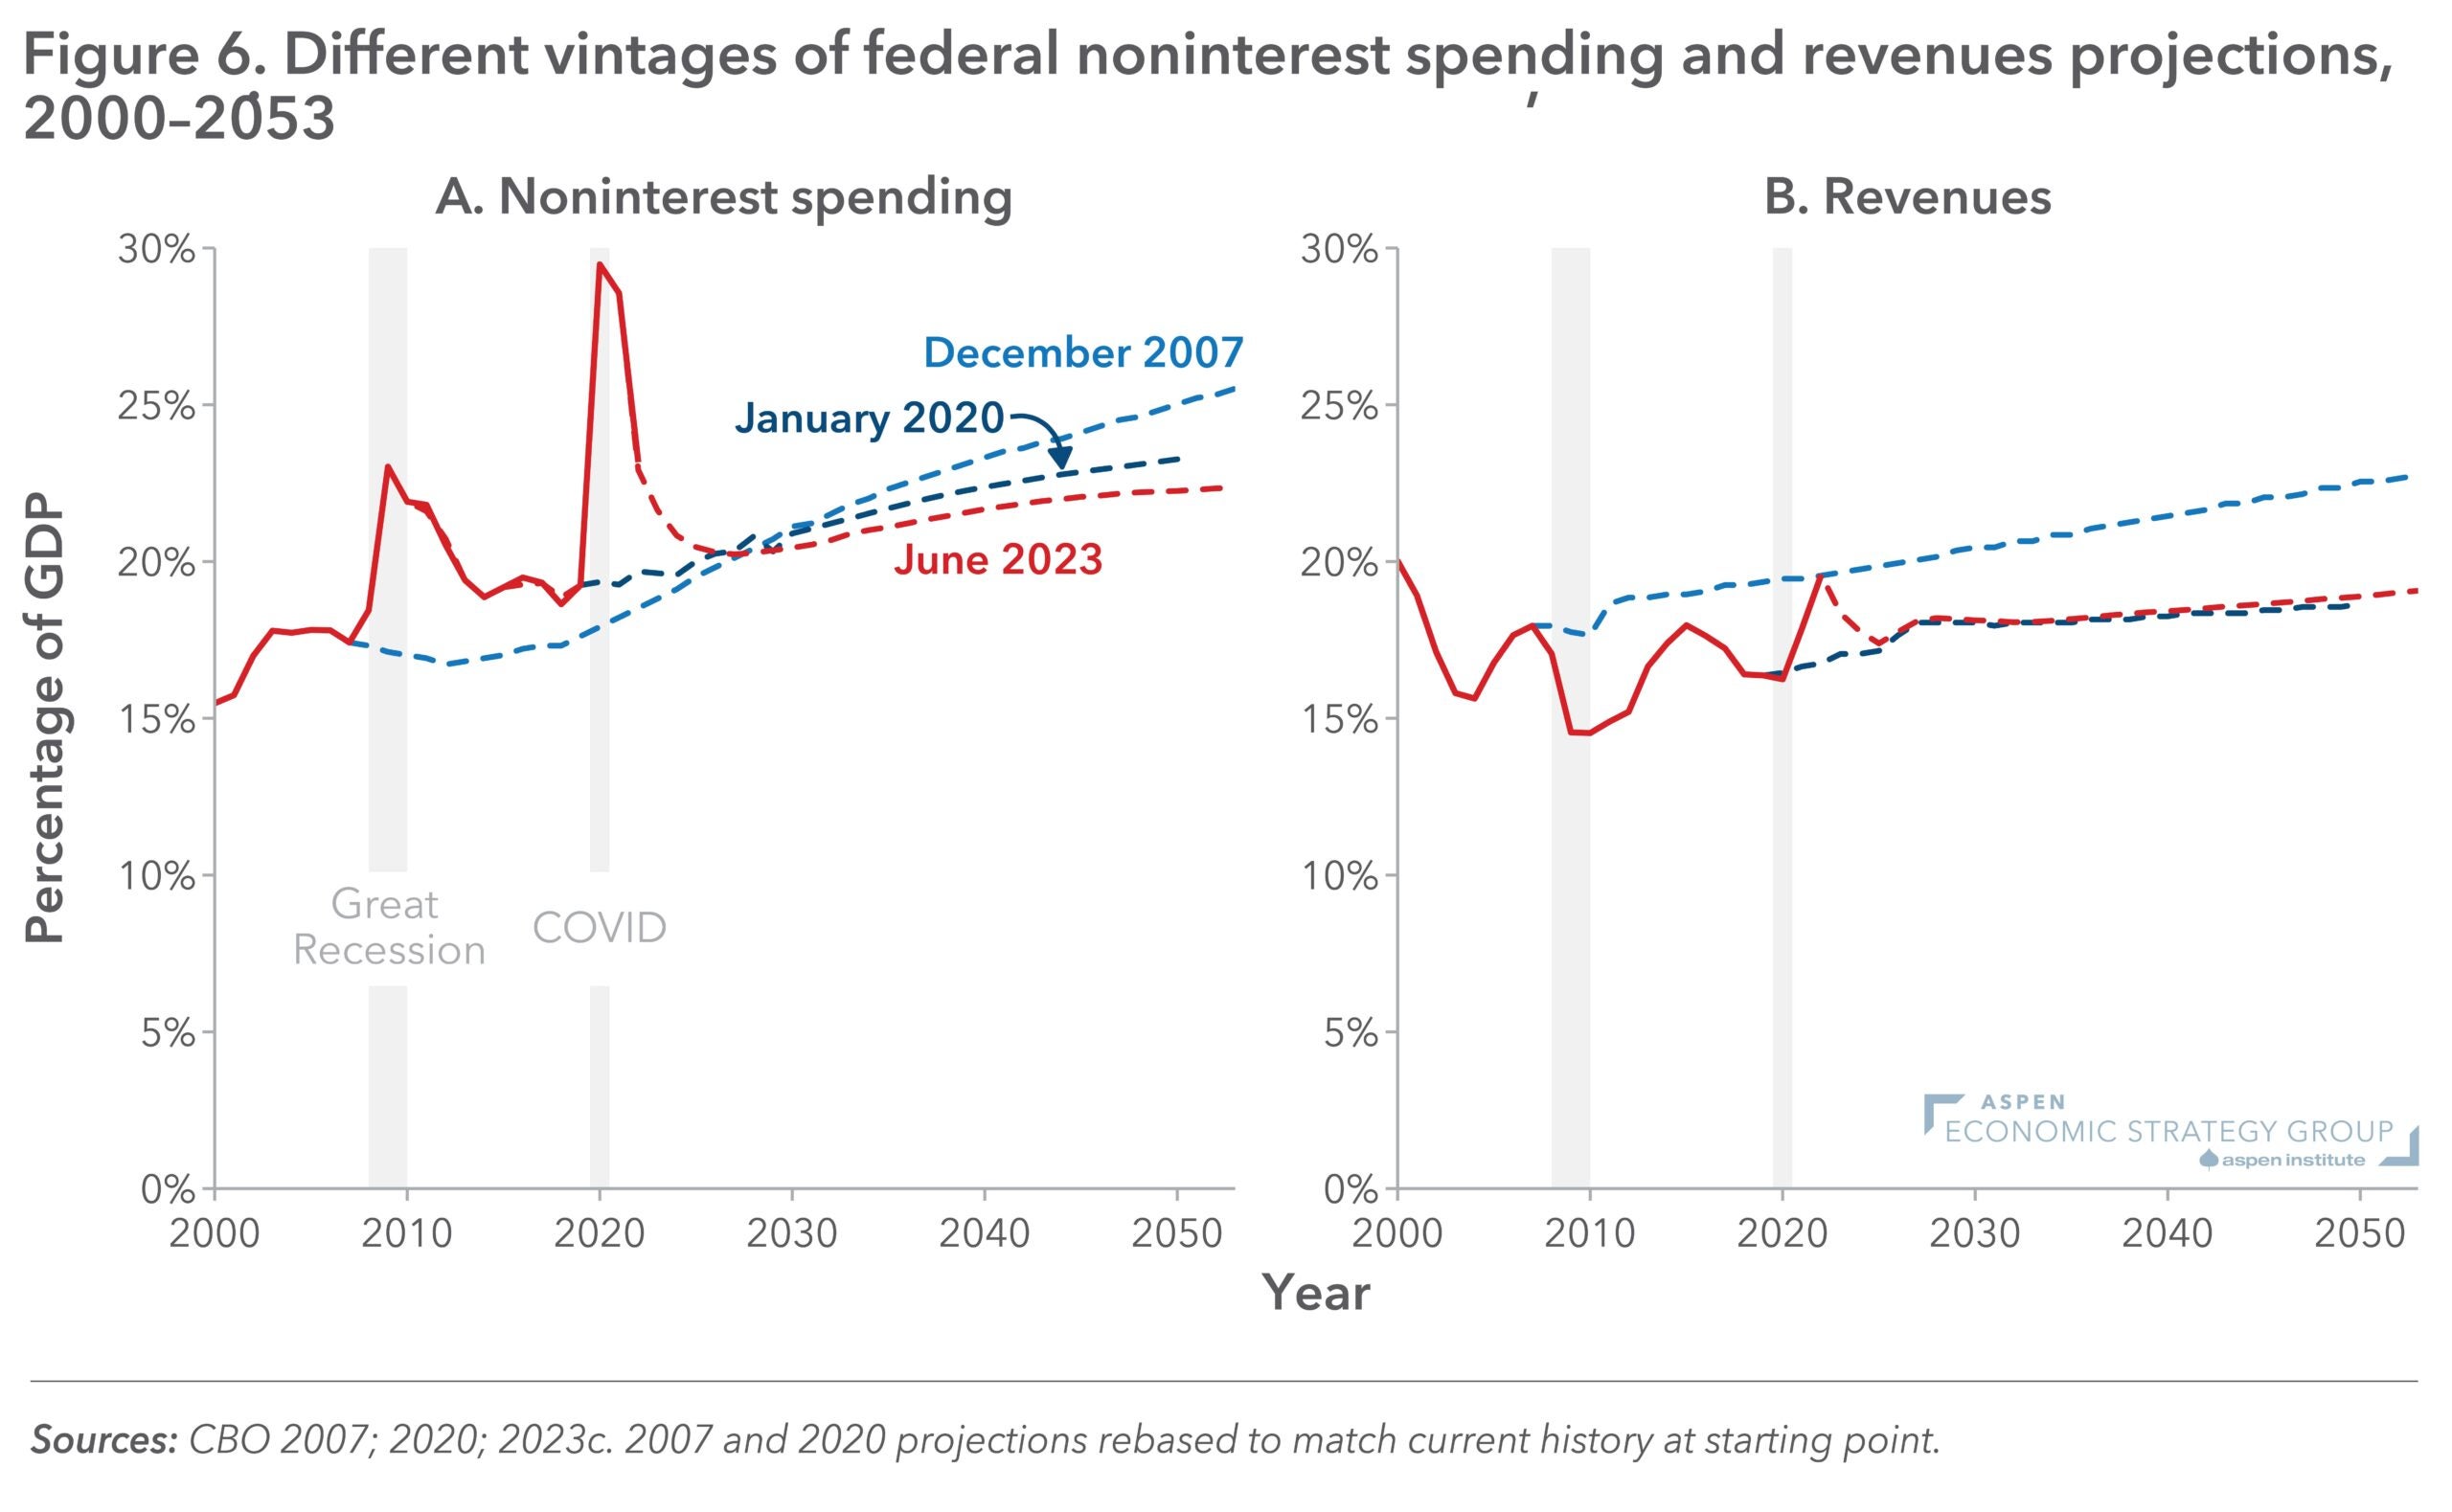
Figure 2: The Rise of Pass-Through Businesses
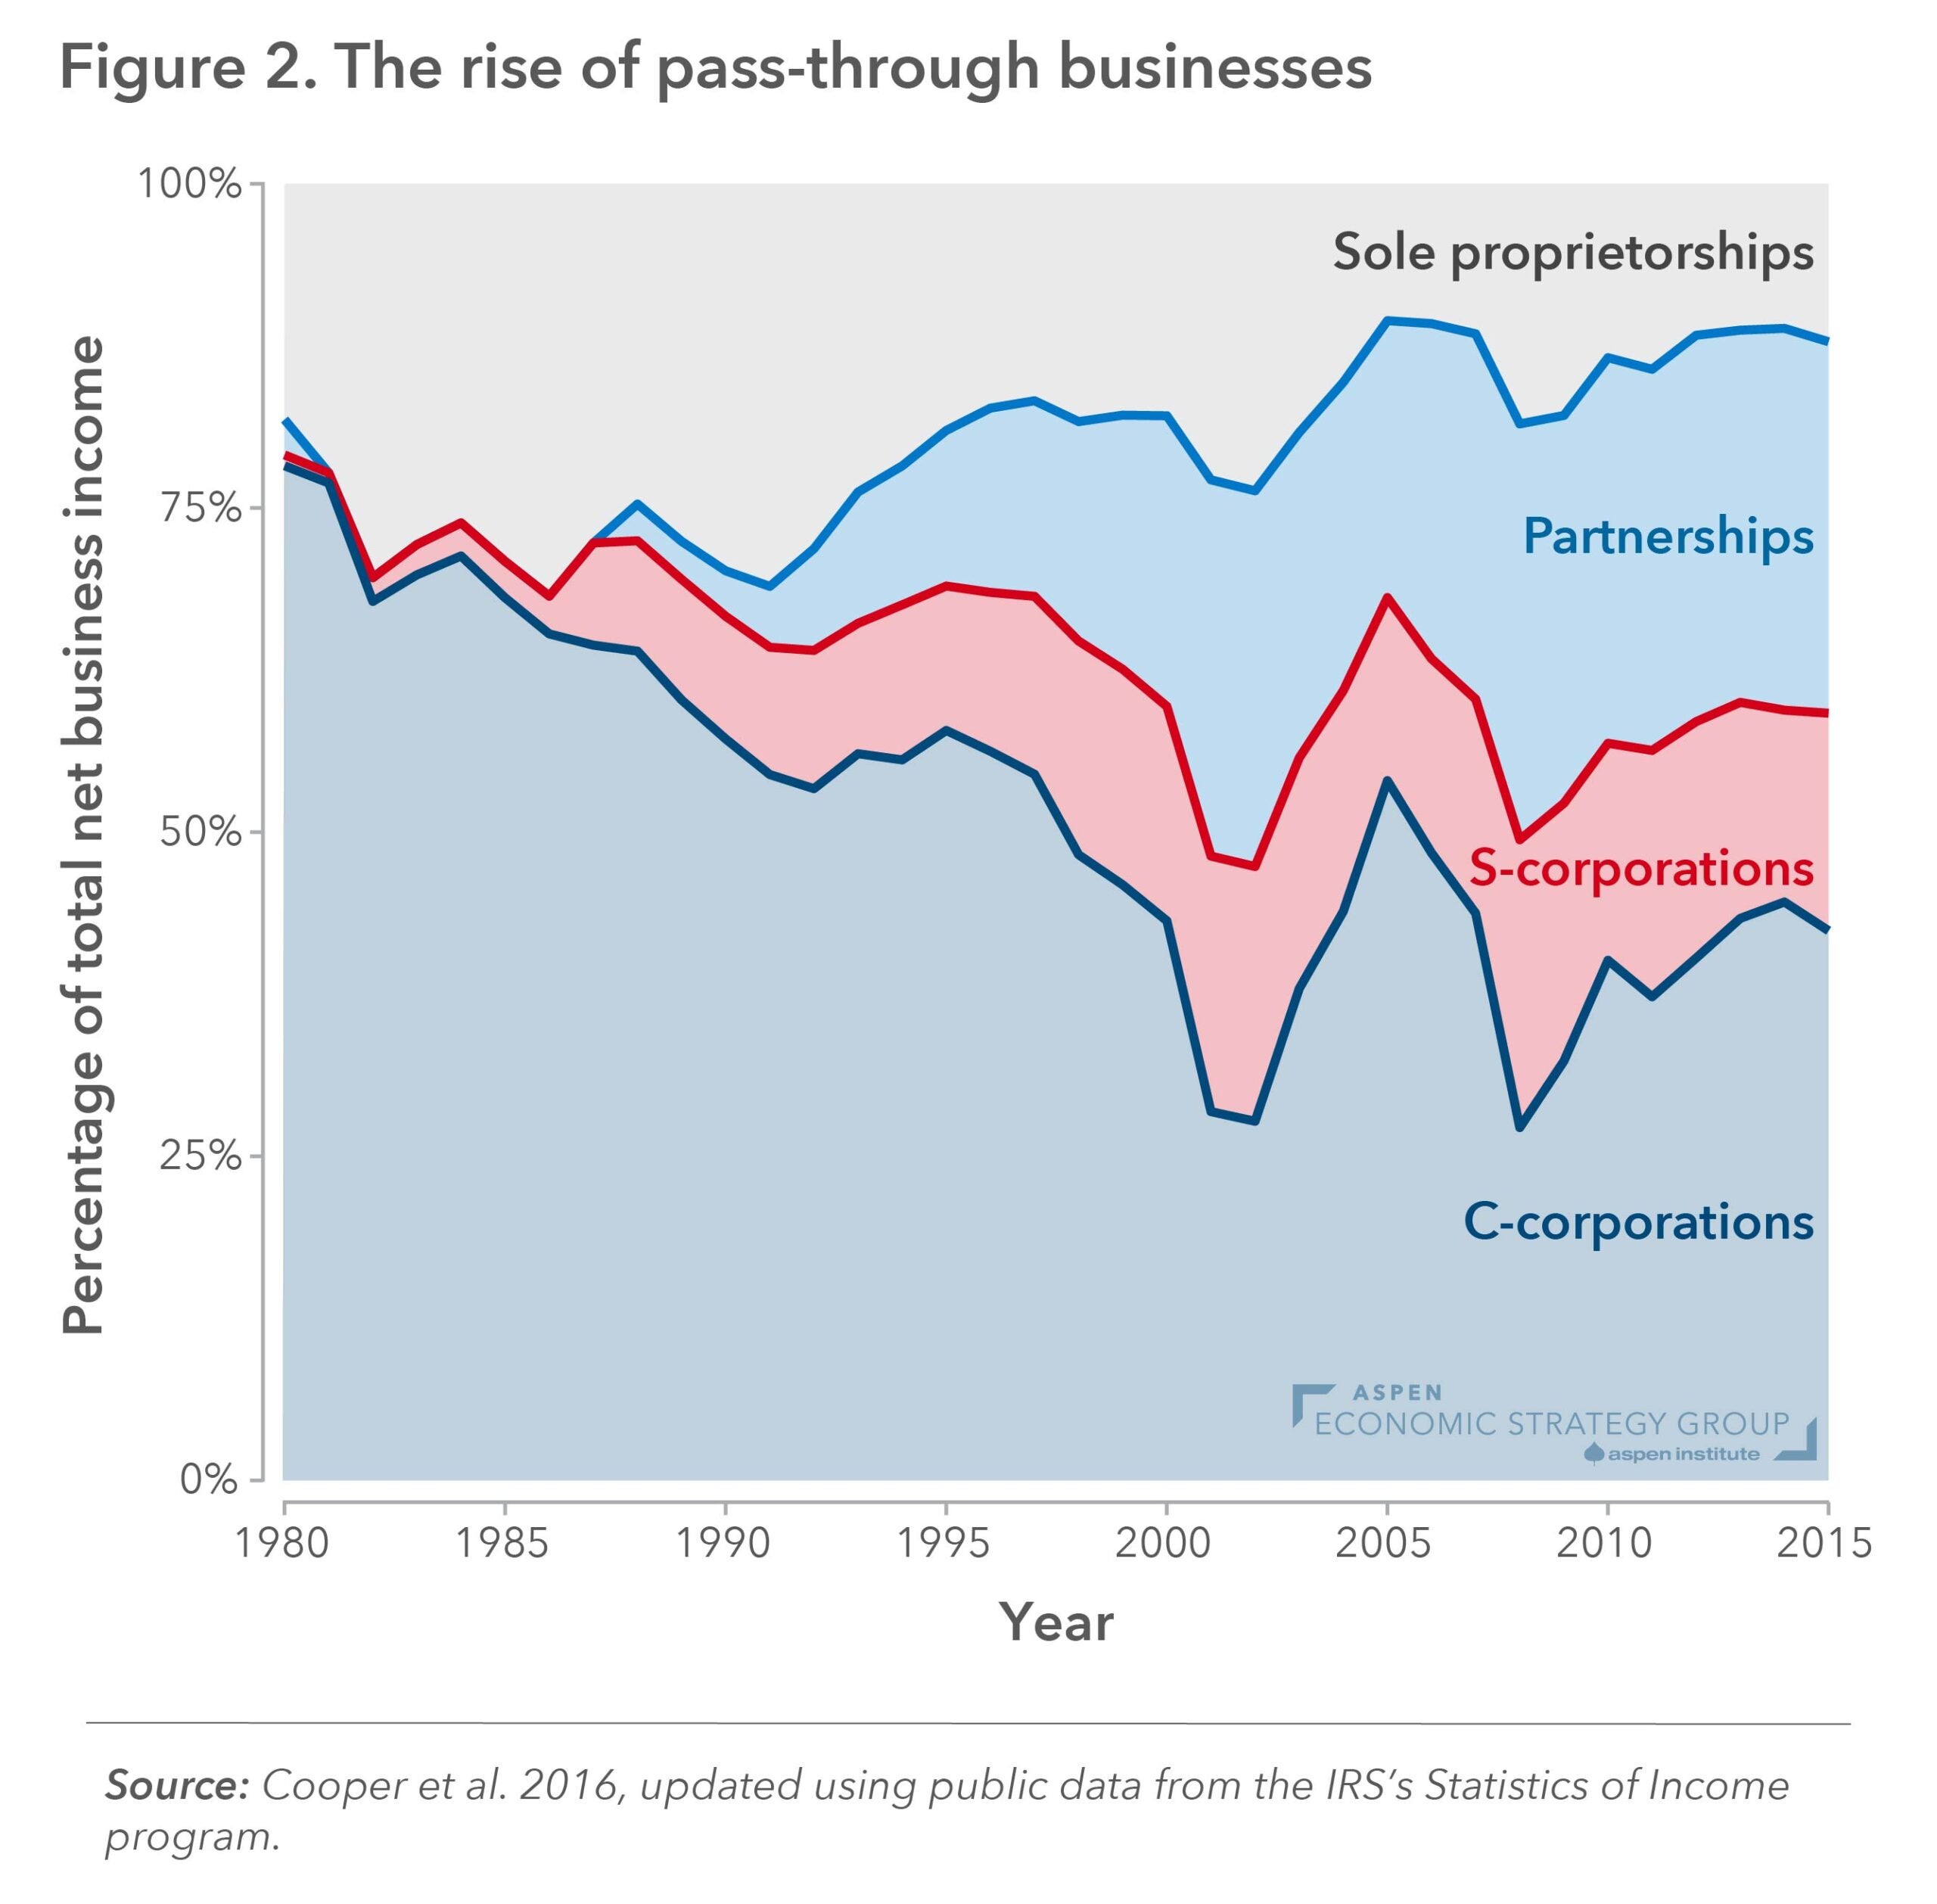
Figure 14: Median Generic Prices Relative to Brand Price Before Generic Entry: Average Manufacturer Price (AMP)
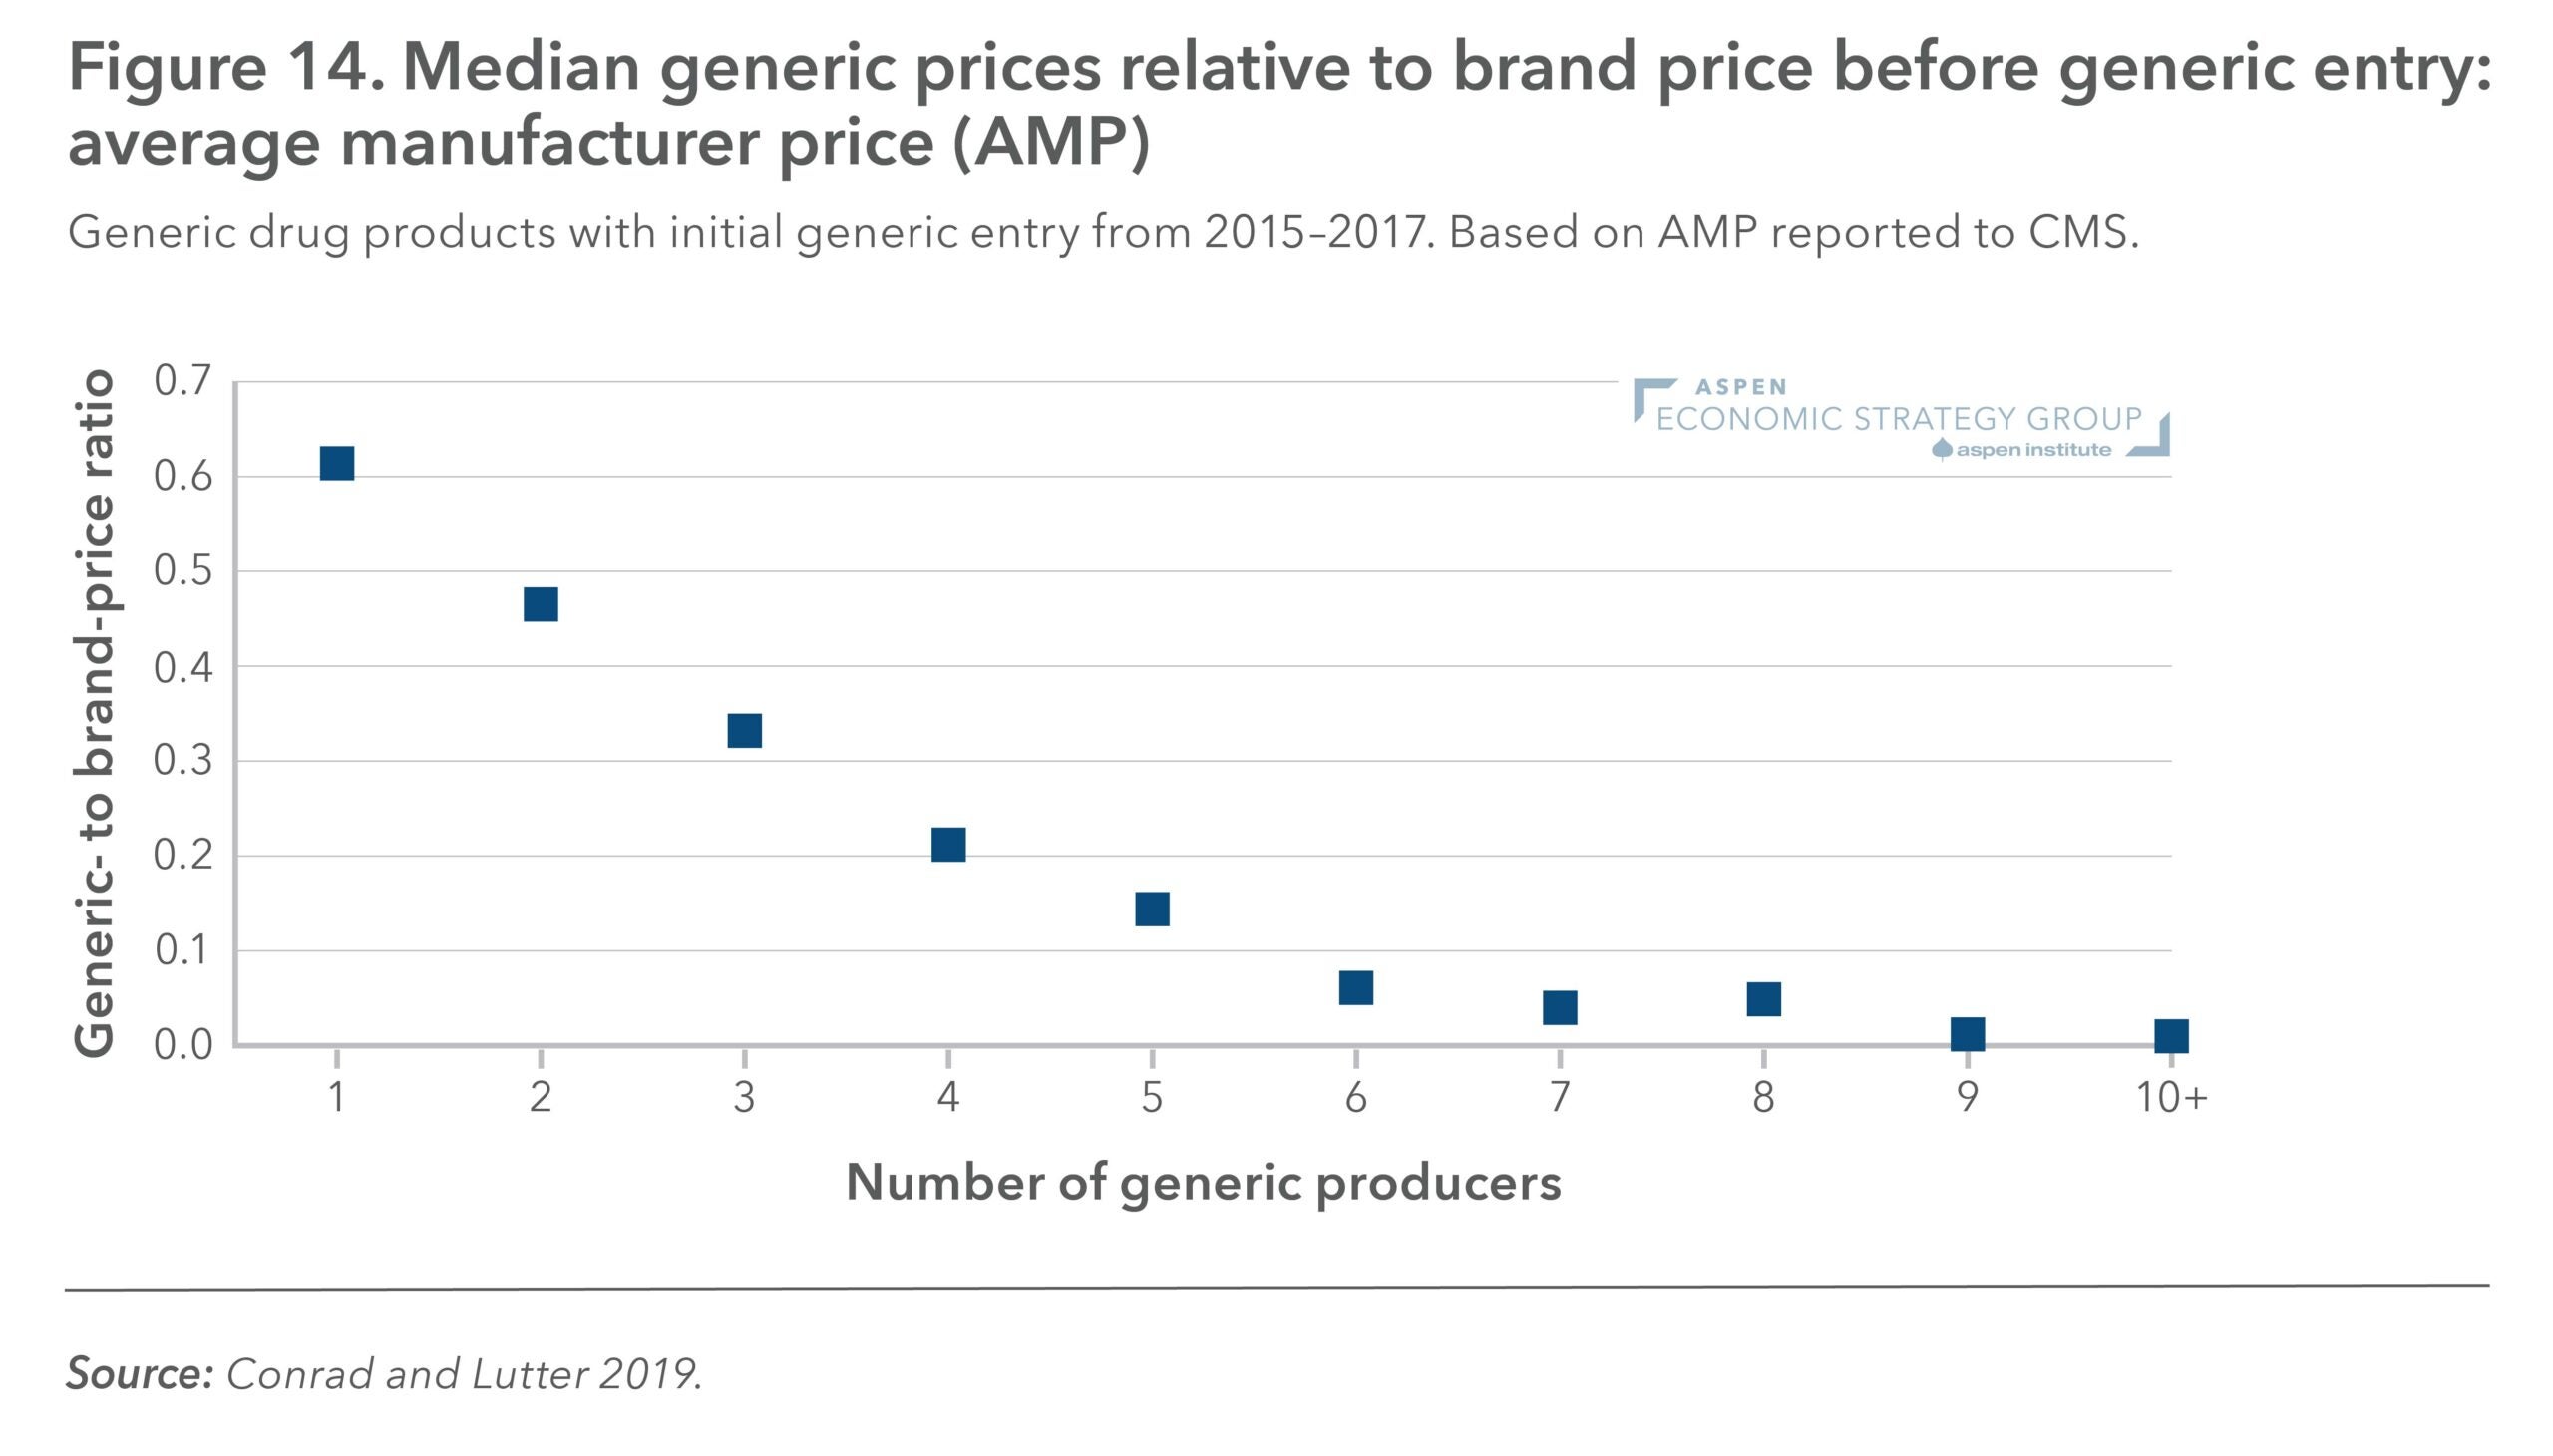
Figure 10: PBM rebate arrangements for traditional and speciality medications in employer-sponsored plans, by employer size, 2014 vs. 2018
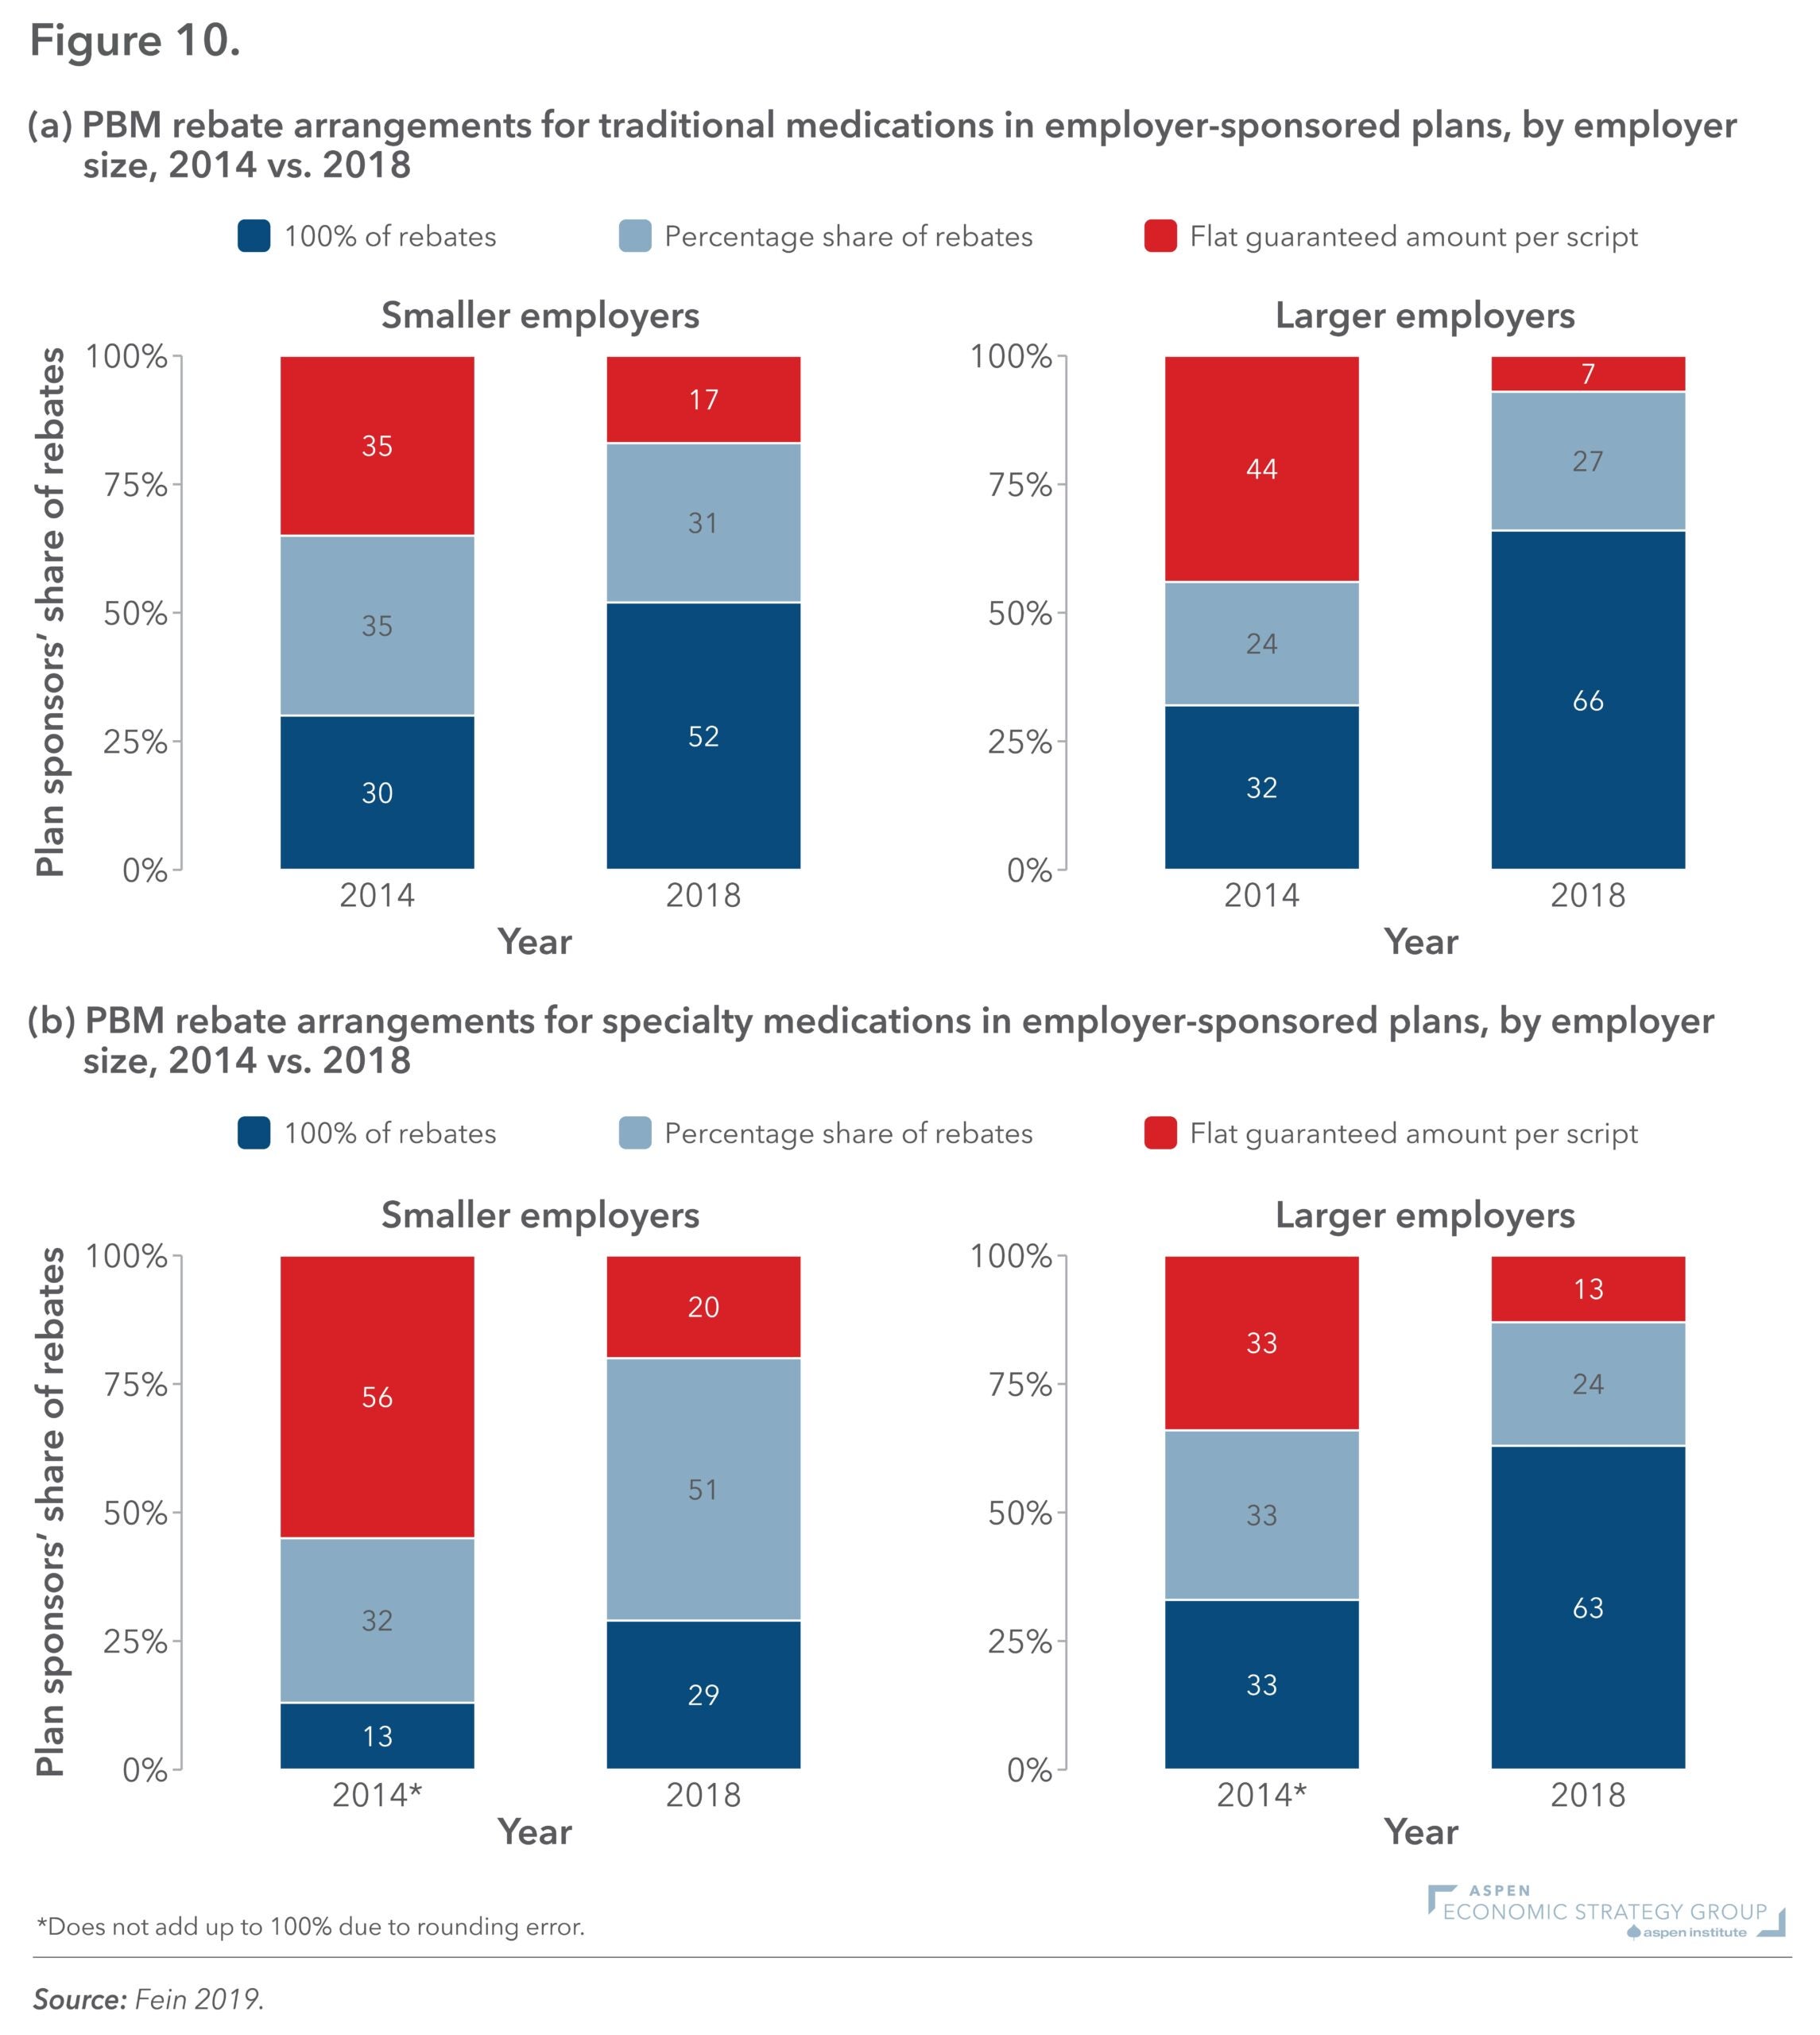
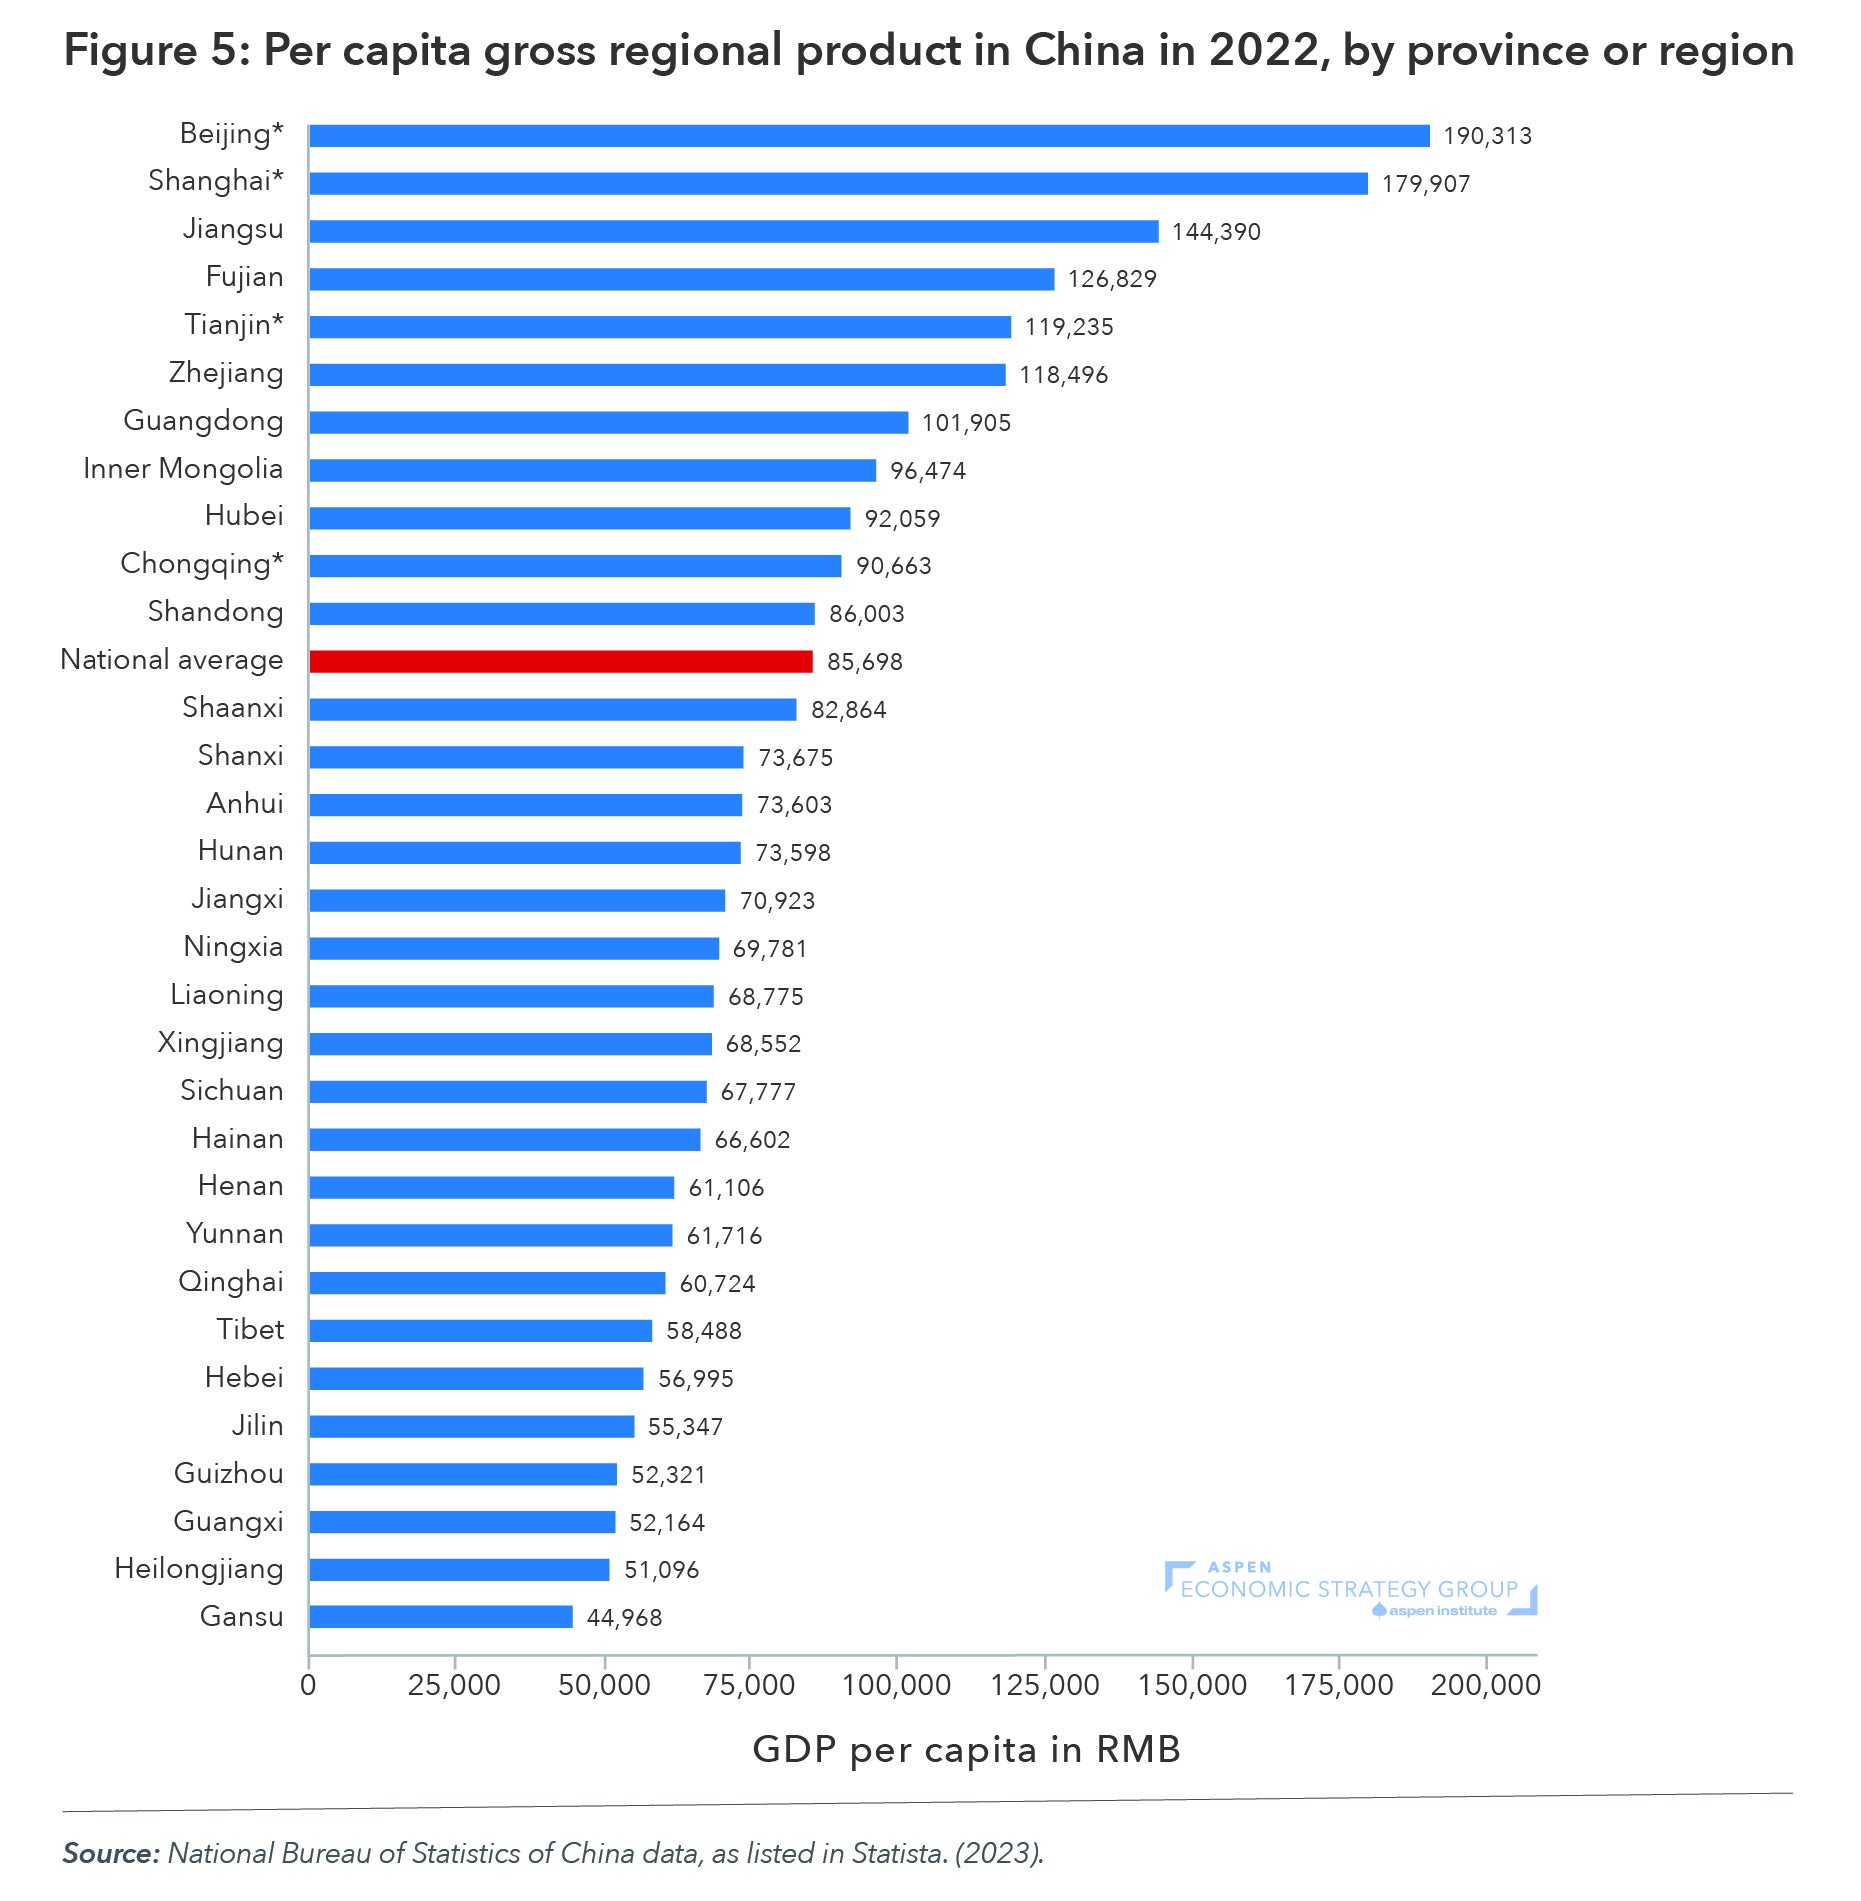
Figure 5: Per Capita Gross Regional Product in China in 2022, by Province or Region