Archives: Publications
These are AIESG Publications
Figure 8. Survey: How Much Do You Worry About Federal Spending and Budget Deficit?
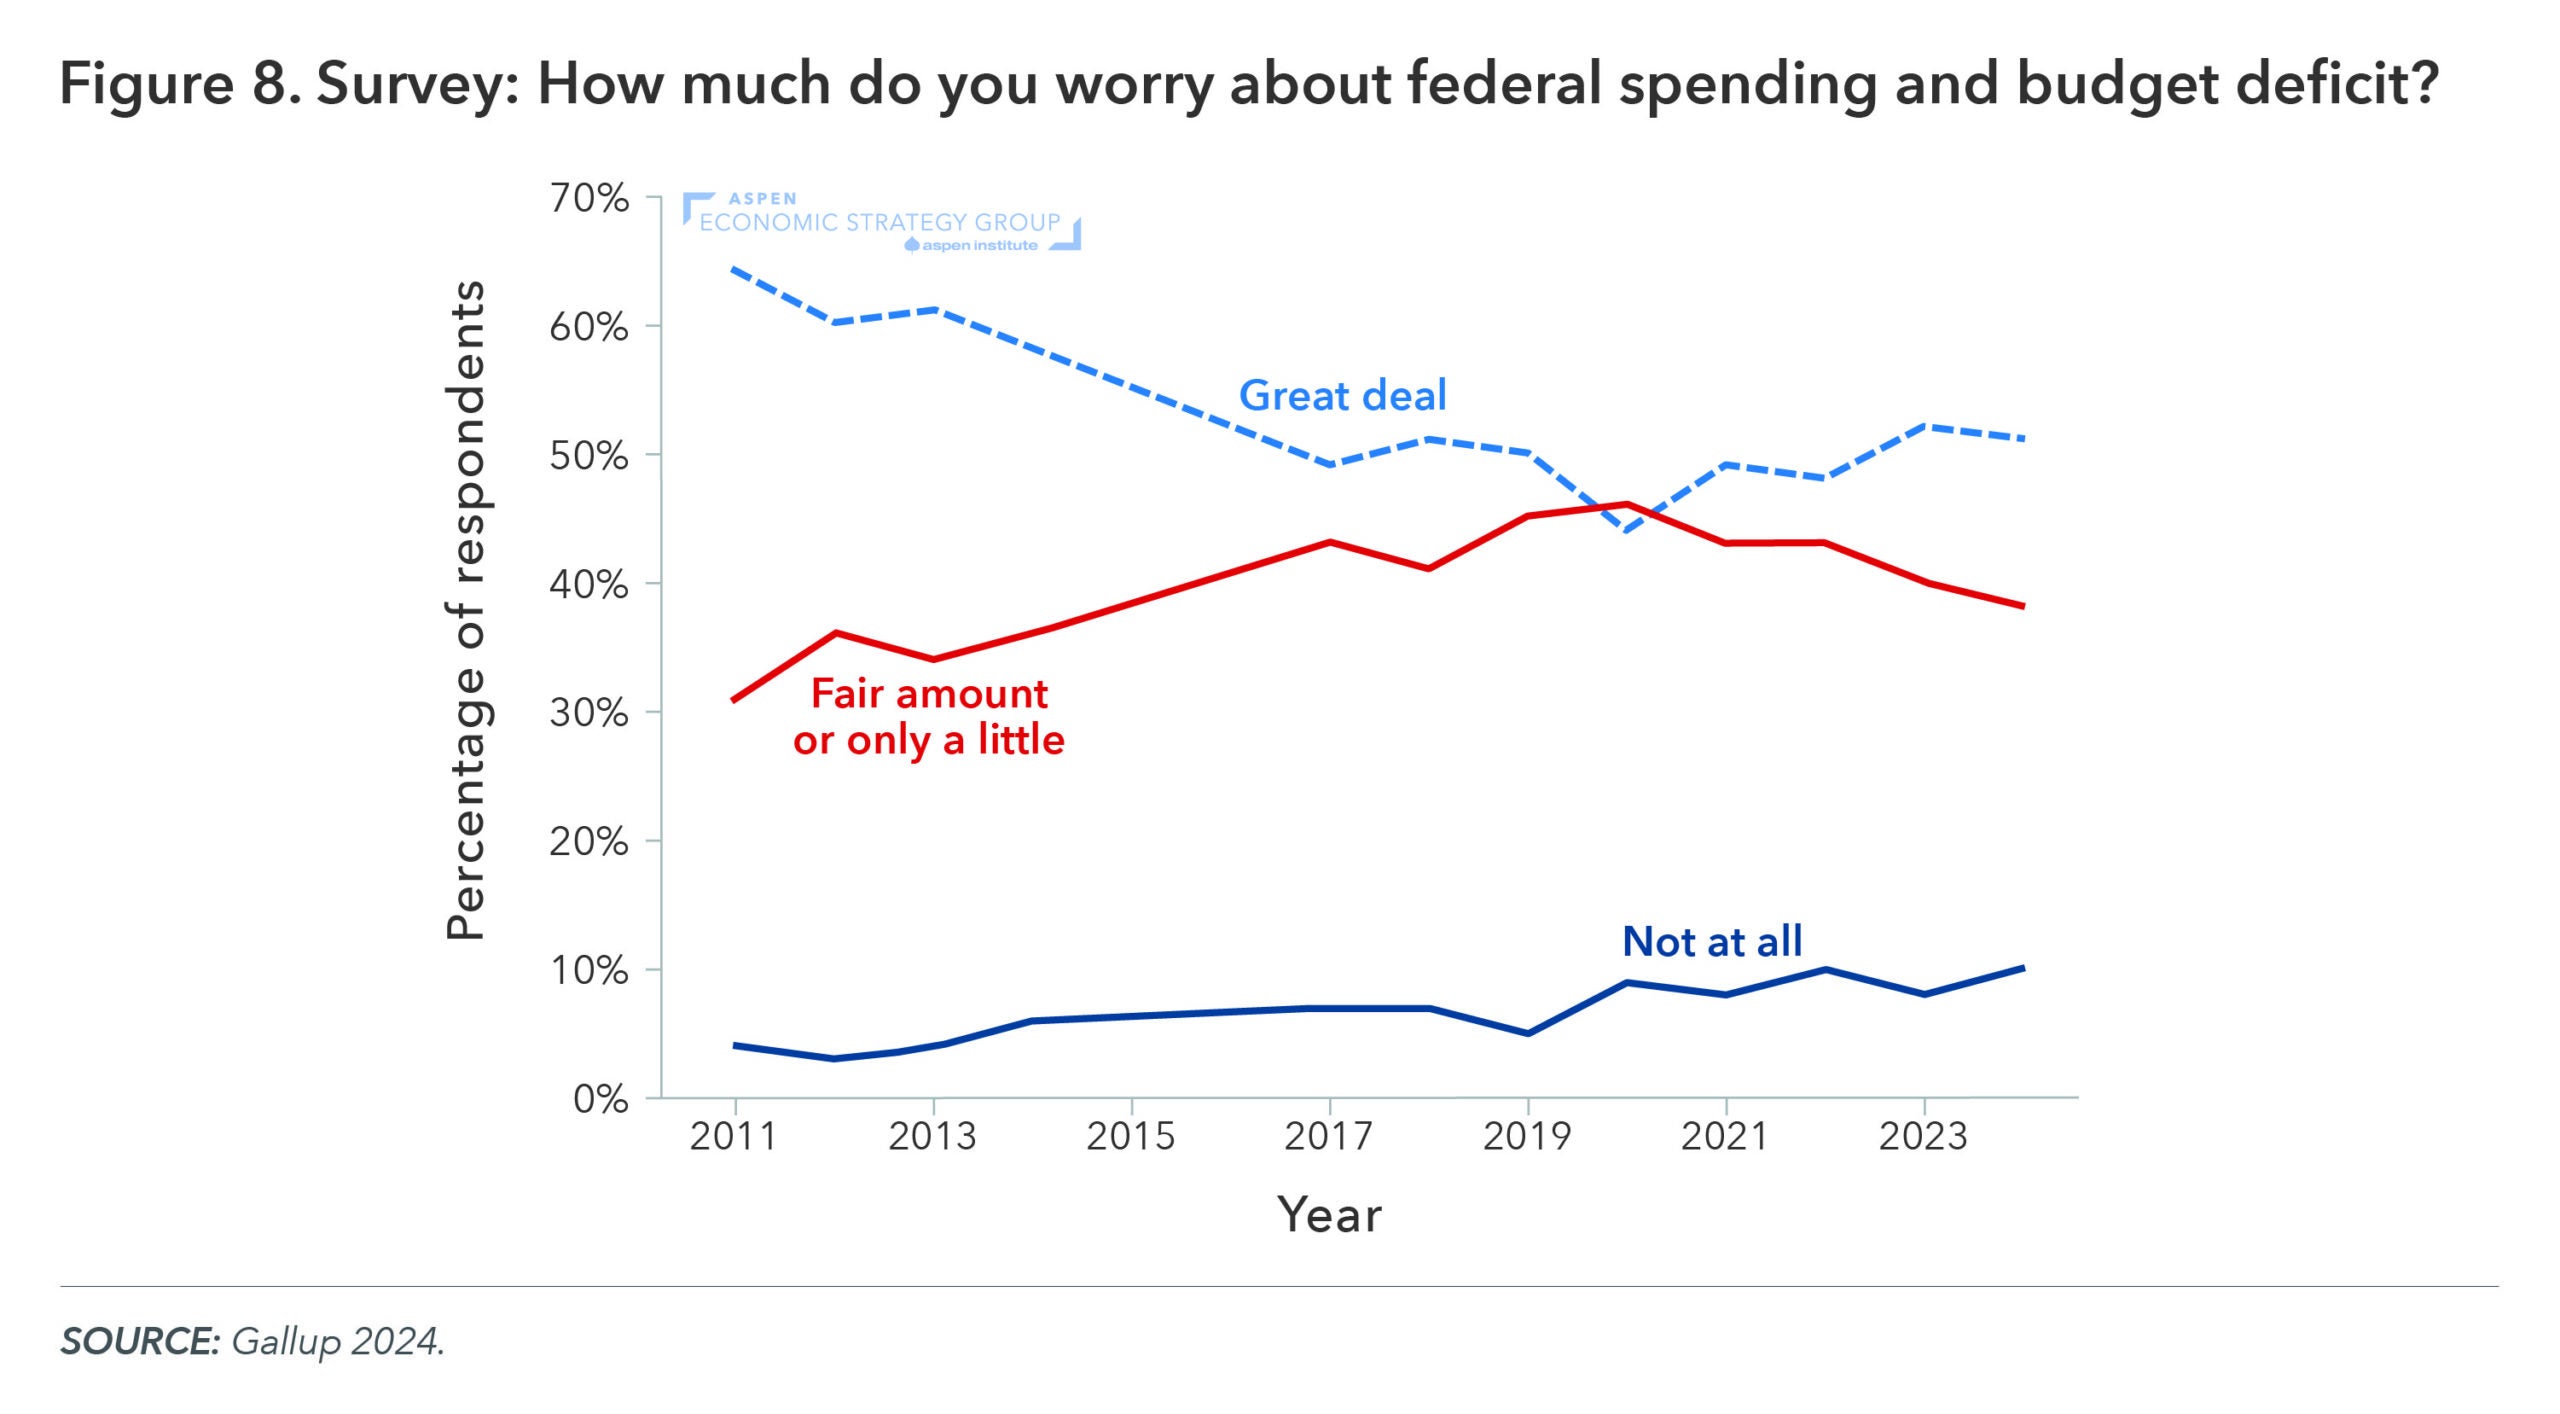
Figure 1. US Violent Crime Rate per 100,000 Residents by Year, 1987-2022
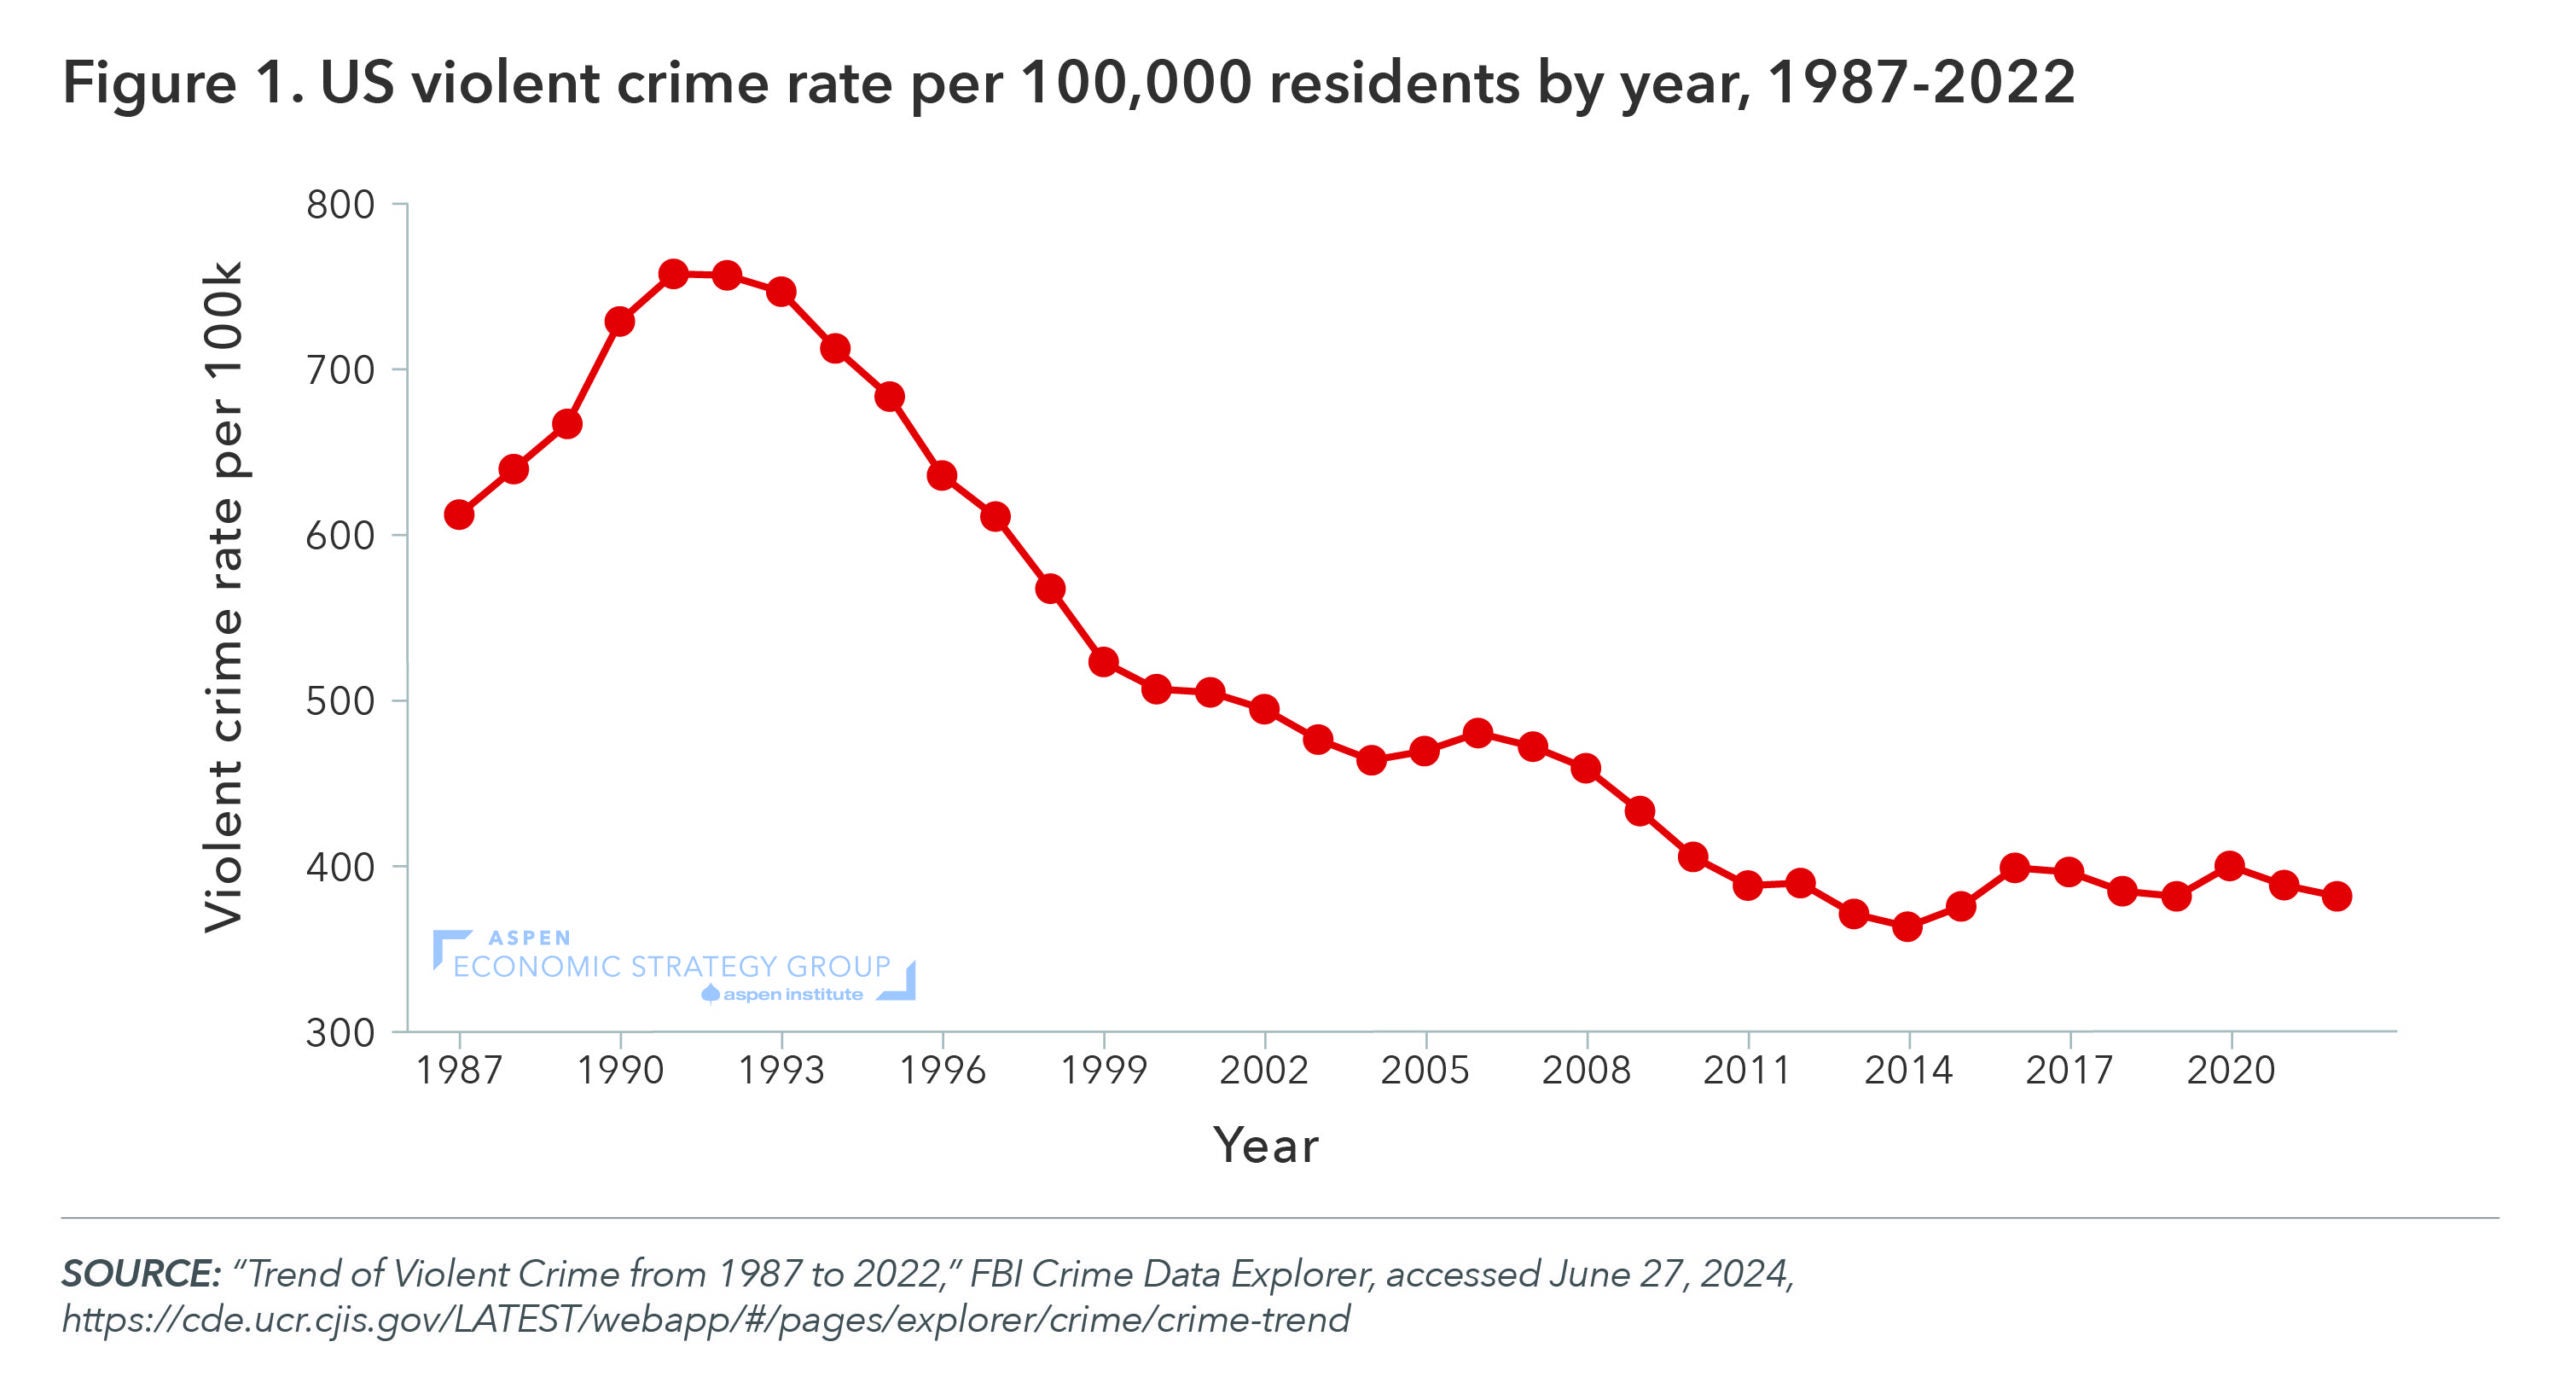
Figure 2. US Property Crime Rate per 100,000 Residents by Year, 1987-2022
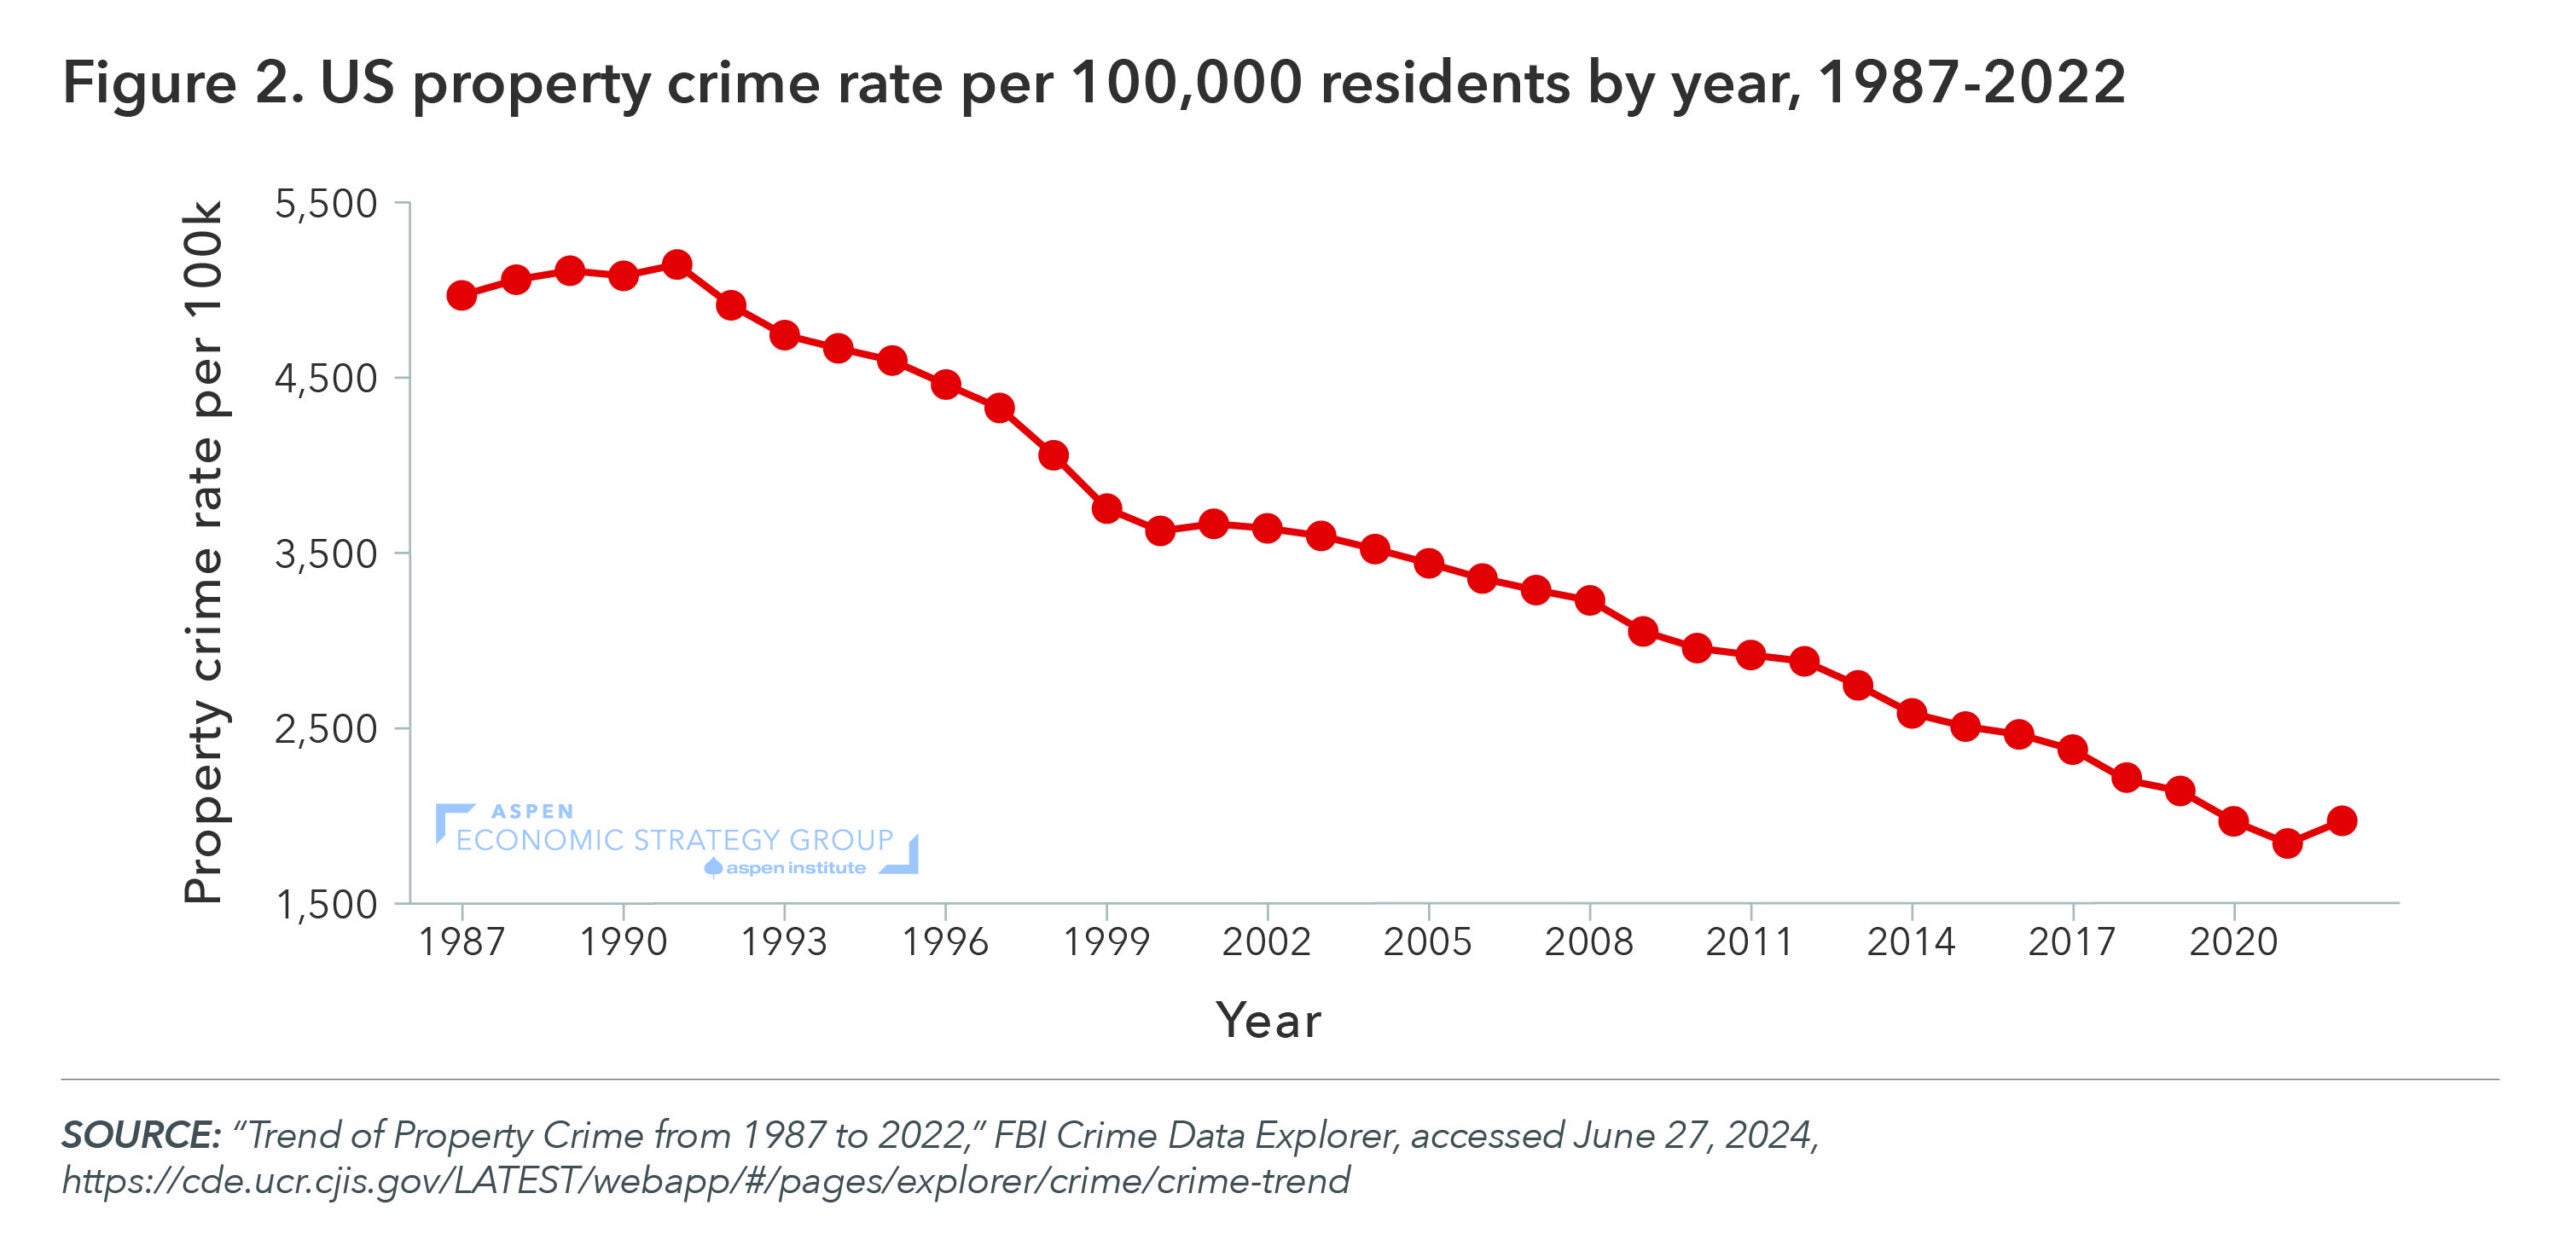
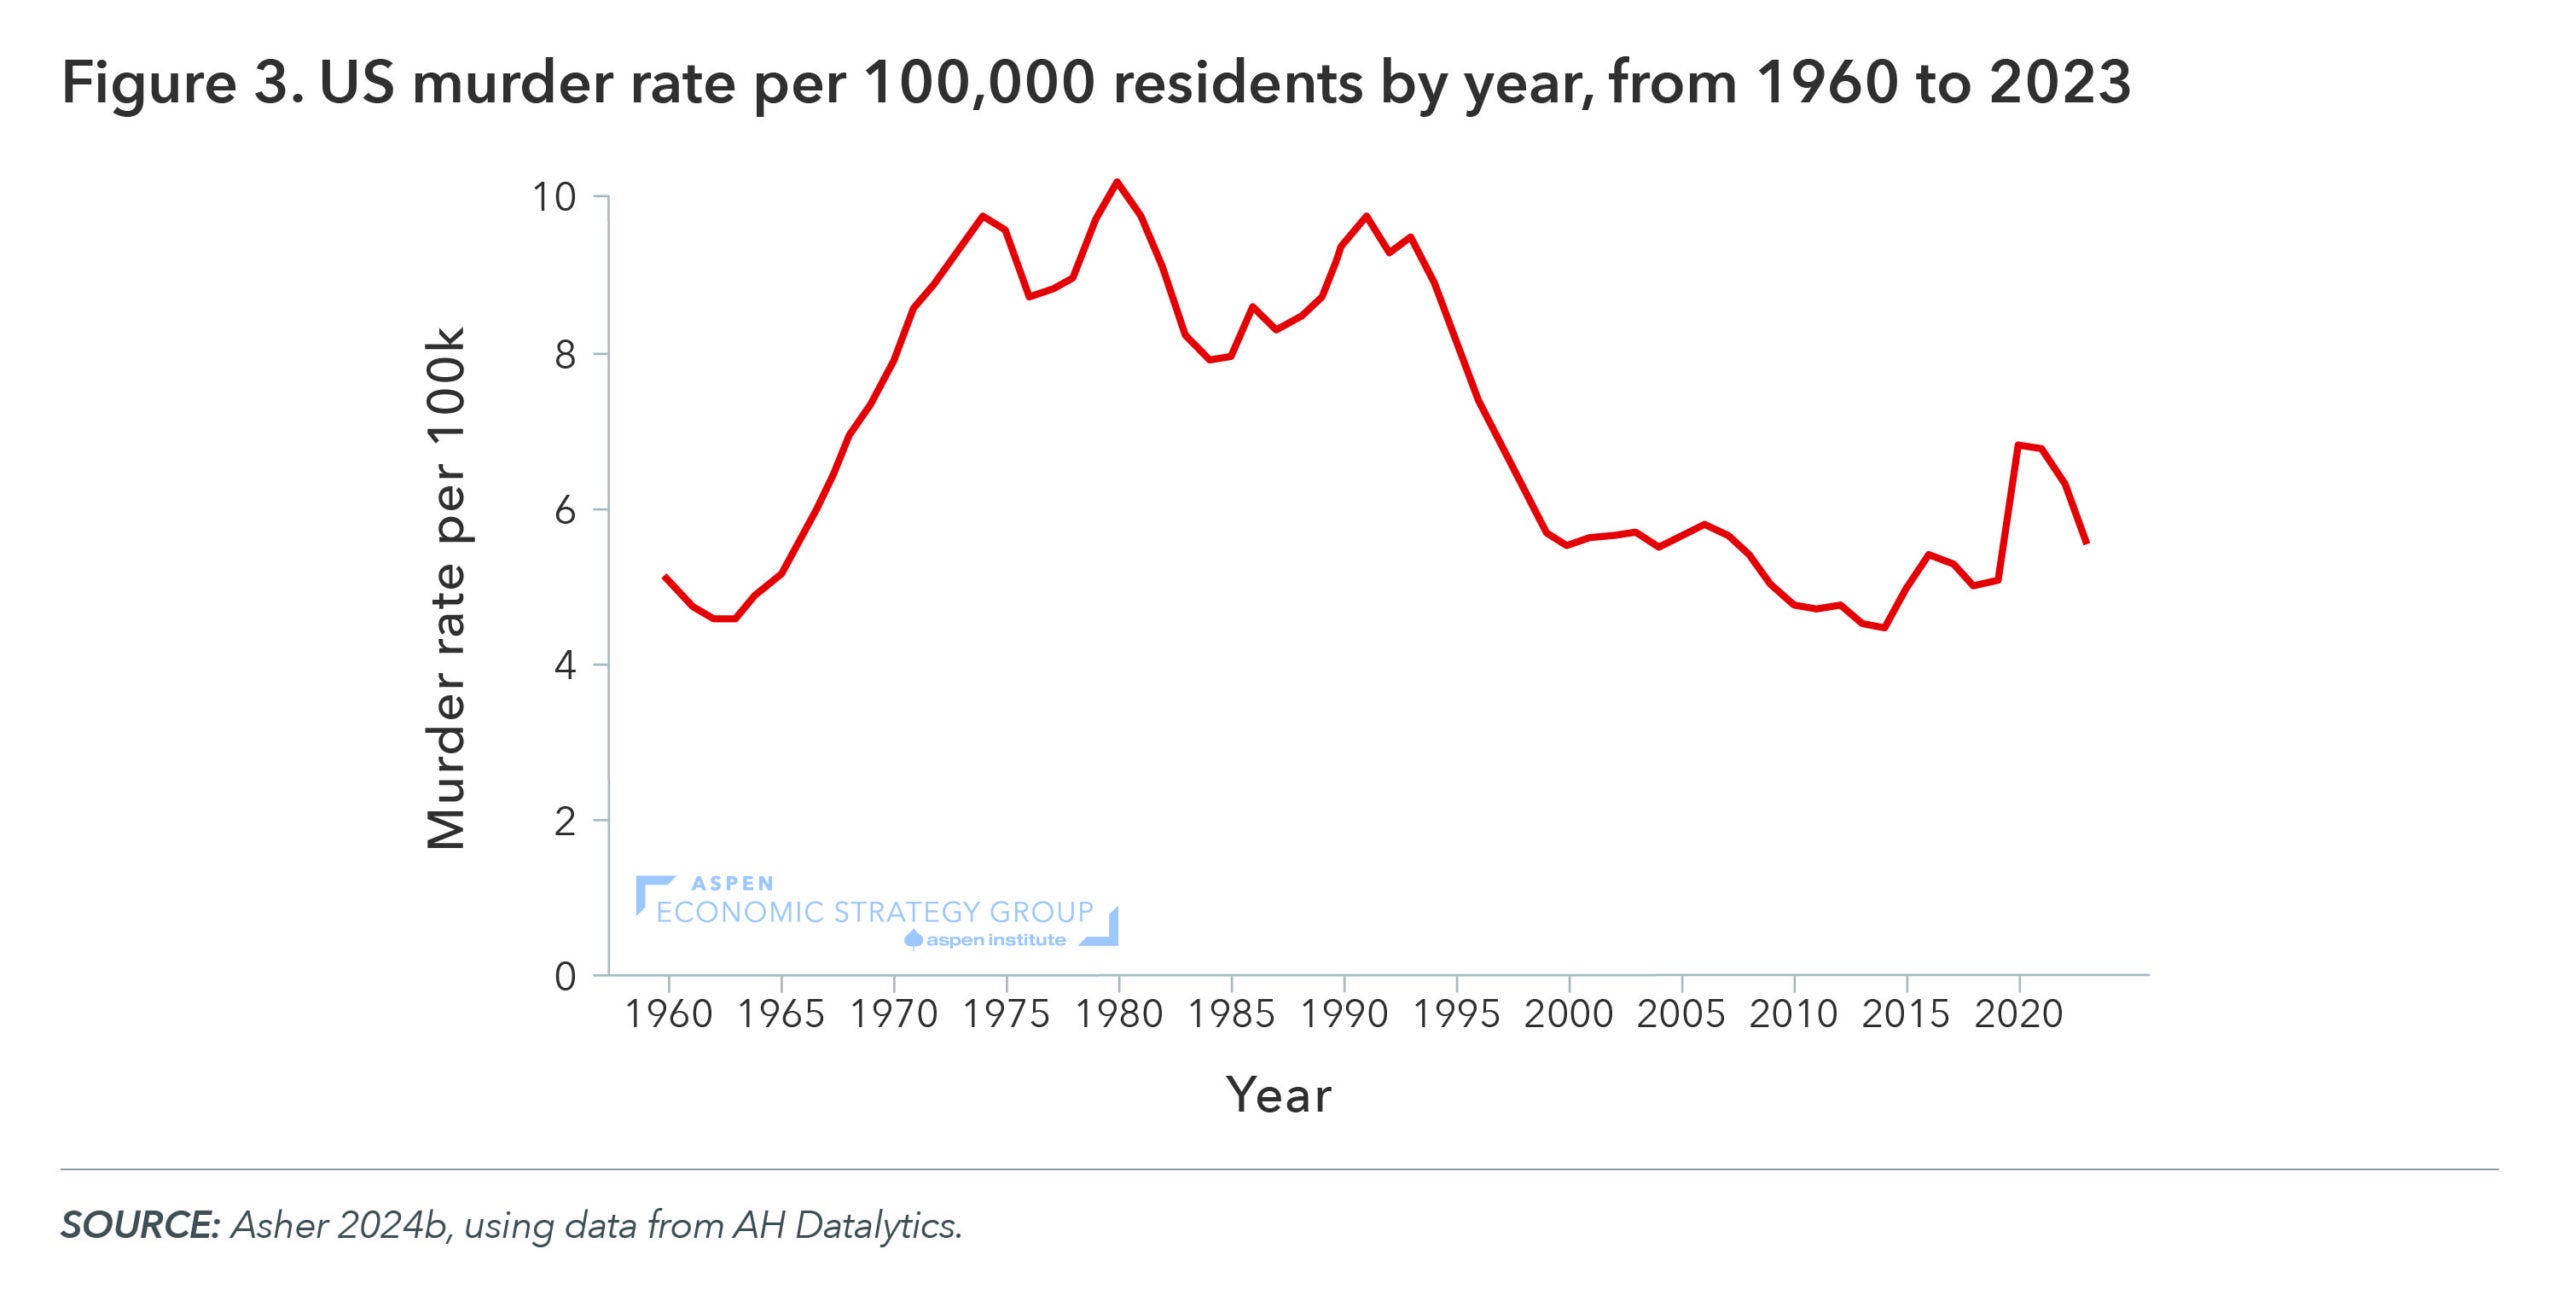
Figure 3. US Murder Rate per 100,000 Residents by Year, From 1960 to 2023
August 2024 Jobs Report: The Summer Slowdown Continues

The BLS estimated that the US economy added 142,000 jobs in August, and the unemployment rate ticked down slightly from 4.3% to 4.2%. This report is far from a worst-case-scenario many had feared, but does tell a consistent story of a labor market that is moving from a phase of post-pandemic normalization into outright weakness.
1. Job growth has slowed sharply over the past quarter
Today’s data first demonstrated that the weakness in last month’s report was not a fluke. Indeed, the estimate for employment growth in July was revised down a further 25,000 to just 89,000 jobs added. Taken with the revision for June, total job growth over the past two months was 86,000 lower than previously estimated. Over the past three months, we have seen a substantial slowdown in job growth compared to even just the beginning of 2024: in January, the three-month moving average of employment growth was 243,000 – now that average sits at just 116,000. For reference, the US economy averaged 190,000 jobs added per month pre-pandemic (over 2015 to 2019).
2. The labor market weakening is broad-based, with many industries losing jobs
Second, over the past several months, labor market weakness has spread to more industries and the signs of growth are increasingly restricted to a small number of sectors. In August, just two industries, Health Care and Construction accounted for more than half (80,000) of the 142,000 net increase in jobs. Moreover, for the first time since the onset of the pandemic, more industries have shed jobs over the past three months than have increased employment (from the BLS Employment Diffusion Index).
3. Job losers are having a more difficult time finding jobs
One bright spot in today’s report was that the unemployment rate ticked down from 4.3% to 4.2%, but this drop was almost entirely because the idiosyncratic factor driving last month’s uptick (a weather-related increase in workers on temporary layoff) fell back to normal levels. More importantly, over the past three months an increasing number of people are moving into the ranks of the unemployed when they enter the labor force (rather than immediately finding a job) and when they permanently lose their job (rather than finding new work). The US has avoided a more severe slowdown in large part because, when workers have lost their job, they have had a relatively easy time finding new work – but that has become increasingly difficult in recent months.
What it Means
The slowdown in the top-line job growth numbers, the broad-based weakening across most sectors, and the flow of workers from job loss into unemployment are all signs that the job market is significantly weaker than even just a few months ago – and is skirting the line between normalization and deterioration. All eyes will now be on whether the Federal Reserve lowers interest rates by 25 or 50 basis points later this month. What happens at the September meeting is much less important than where interest rates ultimately end up over the longer-term, but the underlying weakness in today’s report boosts the case for an aggressive start to the Fed’s rate-cutting cycle.
July 2024 CPI Report: Trending Towards Two

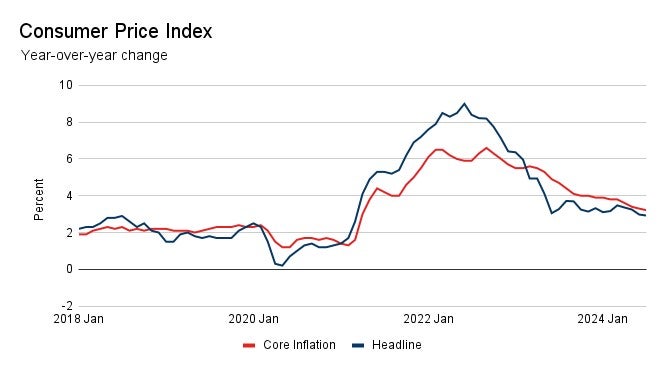
The steady cooldown in inflation that has marked much of 2024 continued in July. The Consumer Price Index rose at a 2.9% annual pace for all items, and at a 3.2% pace for all items excluding food and energy. These headline and core inflation rates are now at their lowest points since March 2021 and April 2021, respectively. Last month, the FOMC statement noted that members are looking for “greater confidence” that inflation is moving sustainably toward its 2% target before lowering interest rates, and the data in today’s CPI report should continue to build that confidence.
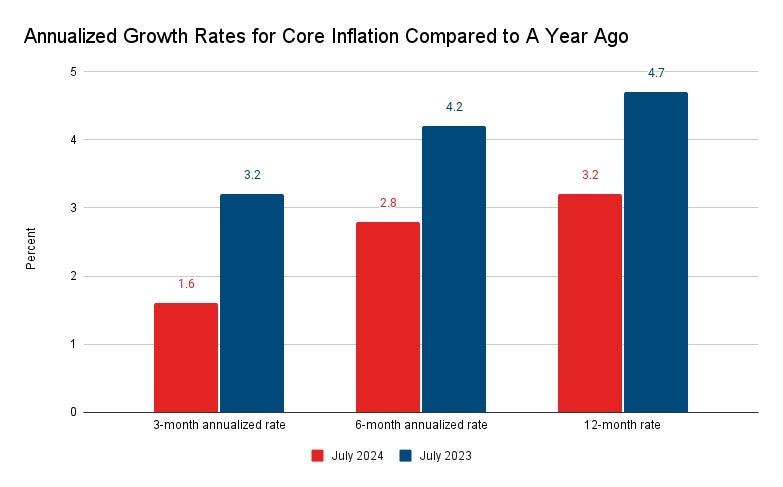
First, more encouraging than the top-line numbers for July are the indications of where inflation is headed. Although core inflation has risen by 3.2% over the past year – still above the Fed’s target – trends in the data over the past three and six months indicate that inflation will continue to fall: over the past six months, core inflation is trending at a 2.8% annual rate, and if we look at just the past three months, it has fallen to a 1.6% pace, below the Fed’s target.
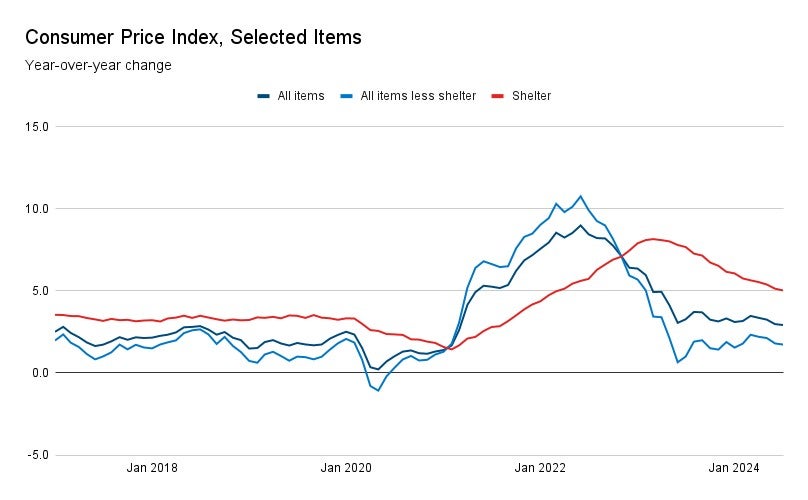
Second, rising housing costs are the largest contributor to price growth right now, and that too is slowly trending down. Shelter prices accounted for 90% of the overall price growth in July, and removing that category, headline inflation was just 1.7% over the past year. The positive news is that shelter inflation in the CPI has been continually falling since reaching a peak of 8% last year: price growth for shelter fell to 5.0% in July, the lowest level since March 2022, and has been trending at a 1.9% annual rate over the past three months.
Today’s inflation readings, along with recent employment data, paint the picture of an economy that has steadily cooled down throughout 2024. The pressures that contributed to high inflation over the past few years – including a tight labor market – have eased. Smaller job gains and rising unemployment have contributed to the slowdown in price growth, and those dynamics make it more likely that inflation will continue to fall sustainably towards 2%.
Rising Childlessness is Driving the Decline in Birth Rates in the United States

The United States has experienced a dramatic decline in birth rates, starting in 2007 and continuing through recent years. This post updates and expands on findings in Kearney, Levine, Pardue (2020), The Puzzle of Falling Birth Rates in the United States, which concludes that the decline in birth rates has been fueled more by a higher frequency of women having zero children than by women having smaller families.
As shown in Figure 1, the overall birth rate in the US, defined as the total number of births per thousand women aged 15-44, has fallen from a recent high of 69.3 in 2007 to 56.0 in 2022. In recent years, the birth rate dropped from 58.3 births in 2019 to 56.0 in 2020 (a drop that Kearney and Levine (2021) contribute to COVID and that seems to be bigger for second births), before rebounding slightly to 56.3 in 2021 and ultimately returning to that multi-decade low of 56.0 in 2022.
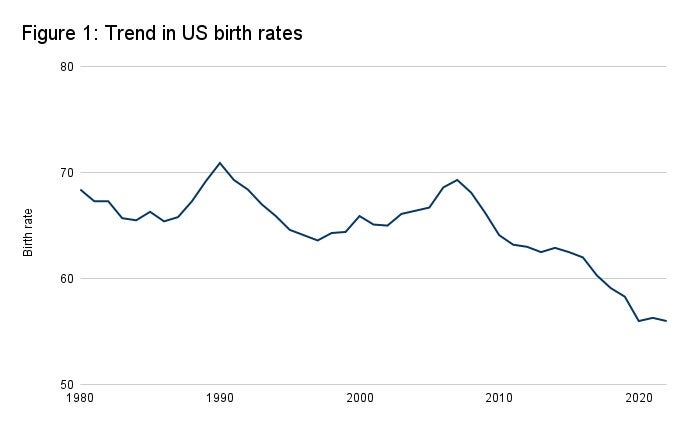
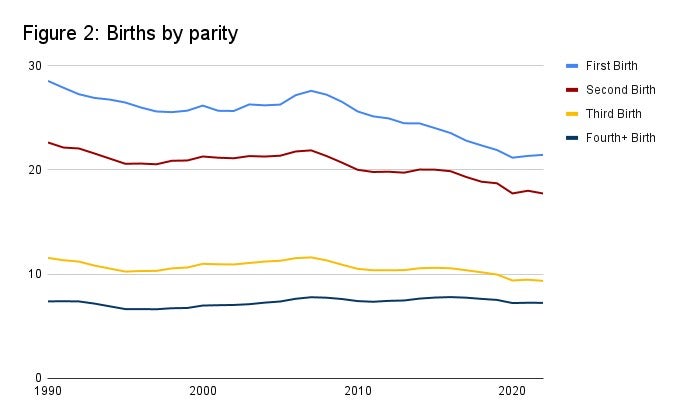
Figure 2 extends data in Kearney, Levine, Pardue (2020), charting birth rates by parity (birth order). From 2007 to 2022, first births declined from a rate of 27.6 per 1,000 women aged 15-44 to 21.5, a drop of 6.2 births. Second births declined from 21.9 to 17.7, a drop of 4.1 births. The birth rate for third-order declined by 2.3 from 11.6 to 9.3. Fourth or higher order births fell by 0.5 births. Although first, second, and third-order births declined by similar proportions (22%, 19%, and 20% drops, respectively), in absolute terms the drop of 6.2 first births can account for about half of the 13.3 total decline in birth rates over that period.
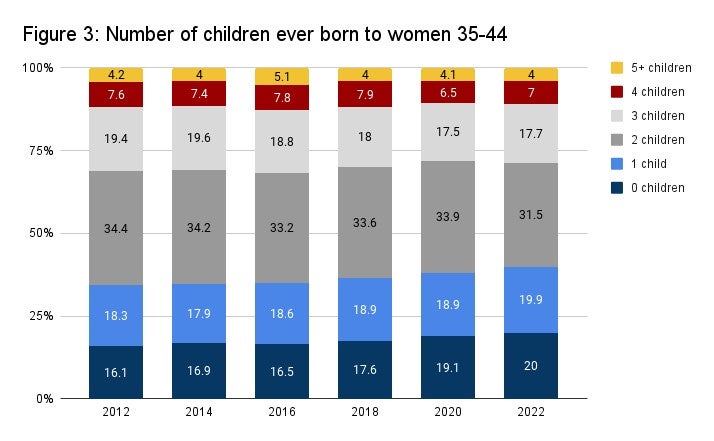
The rise of childlessness is also apparent in recent survey data. Figure 3 plots data from the Current Population Survey’s June Fertility Supplement. The share of women ages 35-44 reporting zero children ever born has risen from 16.1% in 2012 to 20% in 2022. Women reporting 1 or more children born rose 1.6 percentage points, and every other group (2 children, 3 children, 4 children, and 5 or more children) declined or were relatively flat over this period. Furthermore, the rise in women 35-44 reporting no children ever born is seen across nearly every demographic group – by family income, race and ethnicity, geography, and employment status.
Kearney, Levine, and Pardue (2020) find little evidence of a relationship between the decline in fertility and recent policy or economic changes over that period. This shift, instead, is likely a reflection of changing priorities of recent cohorts of US women, including life aspirations and preferences for having children.
Regardless of the cause, Kearney and Levine note in a 2020 AESG policy paper that these demographic trends pose a significant headwind to future economic growth. Should the drop in fertility continue, the US working-age population will decline within the next decade, leading to a smaller labor force and slower growth; second, an older workforce could drive lower innovation and productivity growth; finally, the imbalance between younger and older workers would further strain entitlement programs, such as Social Security and Medicare, which rely on taxes paid by current workers to fund benefits for older retirees.
June 2024 CPI Report: The Summer Cooldown Continues
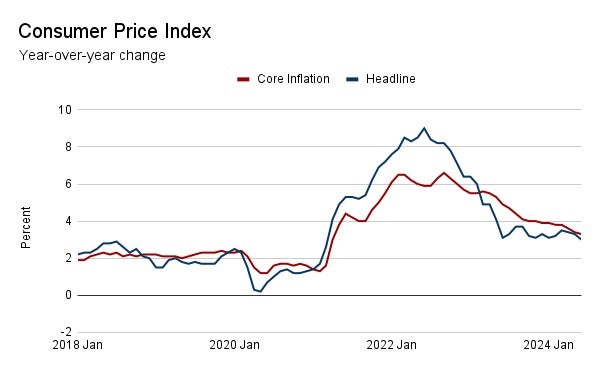
The Consumer Price Index rose at a 3.0% annual pace in June 2024, and 3.2% for all items excluding food and energy. Three things stood out from this report.
1. Core CPI Hits Lowest Level in Three Years
While markets expected a small increase in prices from May to June, the Consumer Price Index declined by -0.1%, and over the past year prices have risen by 3.0%. Among items in the core CPI, which excludes food and energy, prices rose by 0.2% since last month and by 3.3% over the past year. The 3.3% increase in the Core CPI is the smallest gain since April 2021.
2. Recent Trends Paint a More Encouraging Picture
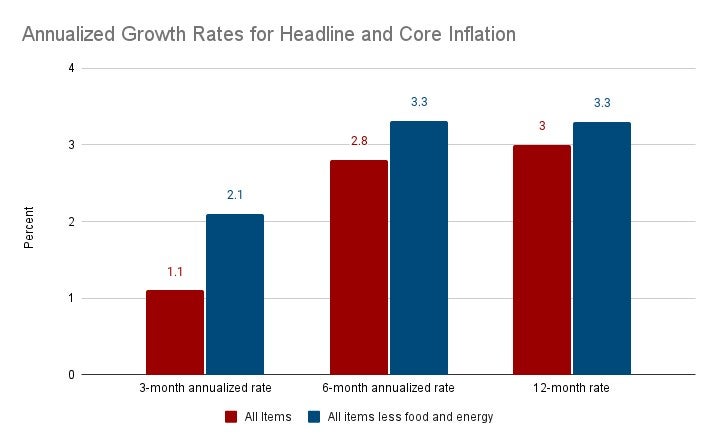
After inflation started this year much hotter than expected, prices in recent months have been falling steadily, and more frequent measures of inflation trends reflect this progress. Headline inflation fell to 3% in June, from a recent high of 3.5% in March. If price trends in the three months since March continue for 12 months, annual inflation would hit 1.1% – far below the Fed’s 2% inflation target. Core inflation, which is a more reliable indicator of underlying trends, shows similar progress: the past three months show annual inflation is trending just near target at 2.1%.
3. Declining Prices Have Been Broad-Based
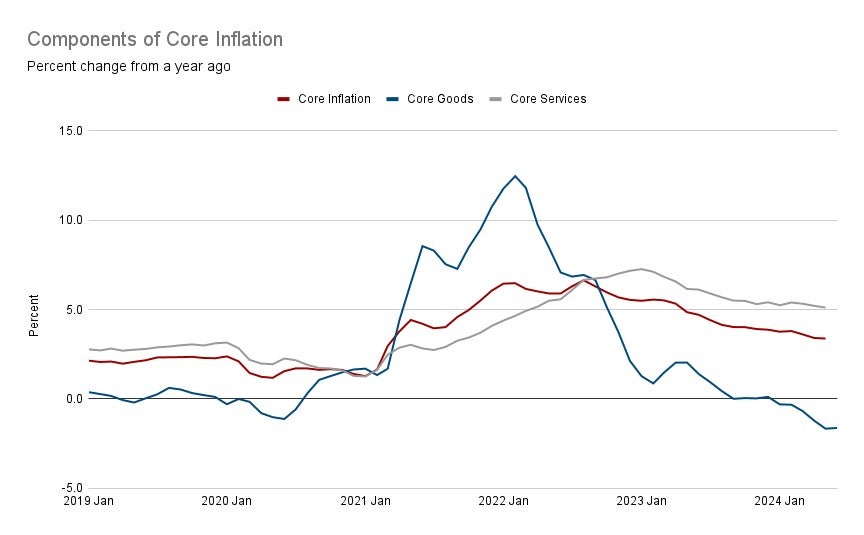
One of the most encouraging signs in today’s report was the decline across several groups within the Core CPI, suggesting this data represents the start of a sustained fall in inflation rather than a one-month blop. Within core goods, prices for used cars continue to fall, dropping by 1.5% since last month. WIthin services, airfare prices registered a 5% drop.Most notably, shelter prices rose by just 0.2% over the last month, the smallest increase in that category since August 2021.
What this means:
The June employment report indicated that the labor market is entering a new period of slower growth, and the inflation report for that month should lead to the same conclusion about prices. It has become clear by now that the uptick in inflation at the beginning of the year was more noise than signal, and data since March has shown prices getting back on their disinflationary track. Core inflation is now at its lowest level in three years and, if the last three months are an indication, is sitting right now just at the Fed’s target. Taking these inflation trends together with the slower pace of job growth and rising unemployment, the question now becomes whether this summer cooldown turns into a fall chill.