Top 12 Charts of 2025 from the AESG

Happy holidays from the Aspen Economic Strategy Group! Thank you for your continued interest and support of our work. As a group devoted to advancing evidence-based economic policy, we appreciate the powerful role that charts play in telling the story of our economy. Enjoy twelve figures that showcase the AESG’s work in 2025!
Figure 1: Compared to half a century ago, inflation-adjusted wages have risen across the income distribution.
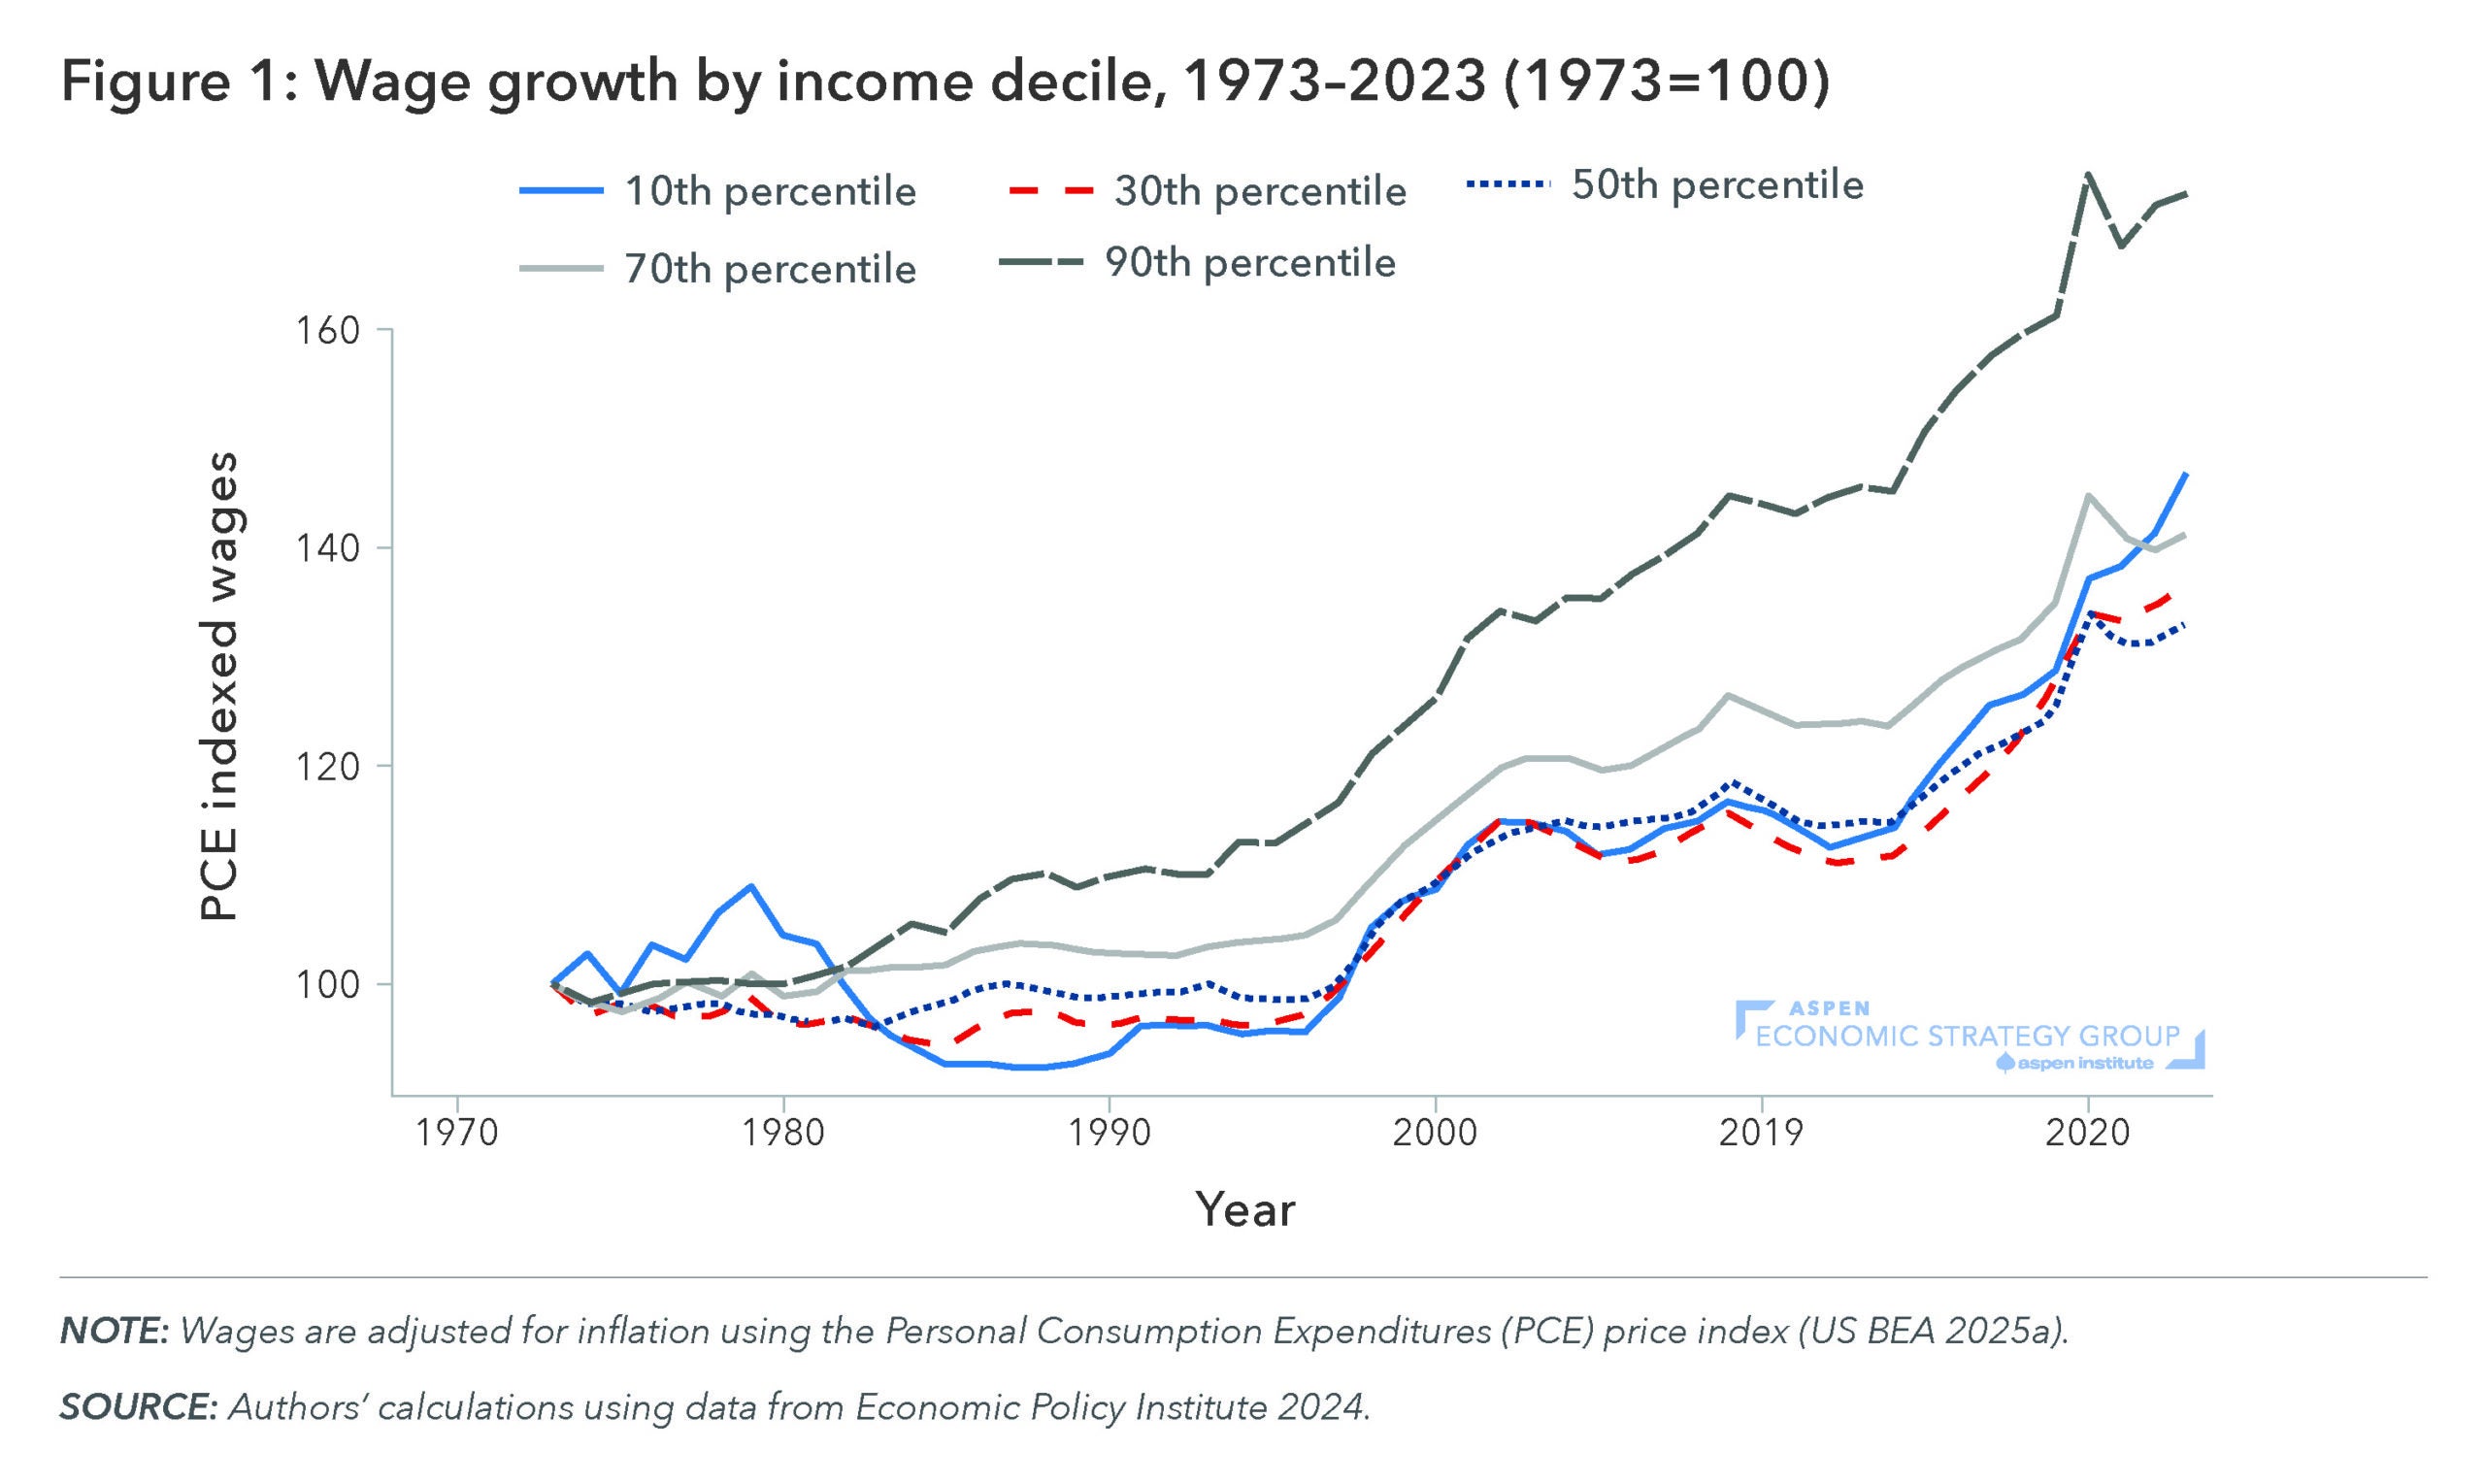
In the AESG staff report, Current Evidence on Household Financial Wellbeing, Policy Director Luke Pardue and Research Assistant Ella Grant bring clarity to the question of how American households are faring and attempt to reconcile often-heard conflicting claims about whether American households are thriving or barely surviving. They find that, while wage growth has not been uniform across time or across the wage distribution, the overall story of the American worker is one of substantial wage growth over the past half century and particularly over the past 30 years.
FIgure 2: Poverty has fallen substantially since the 1980s—by roughly half according to income-based measures and by more than 80 percent using consumption-based measures.
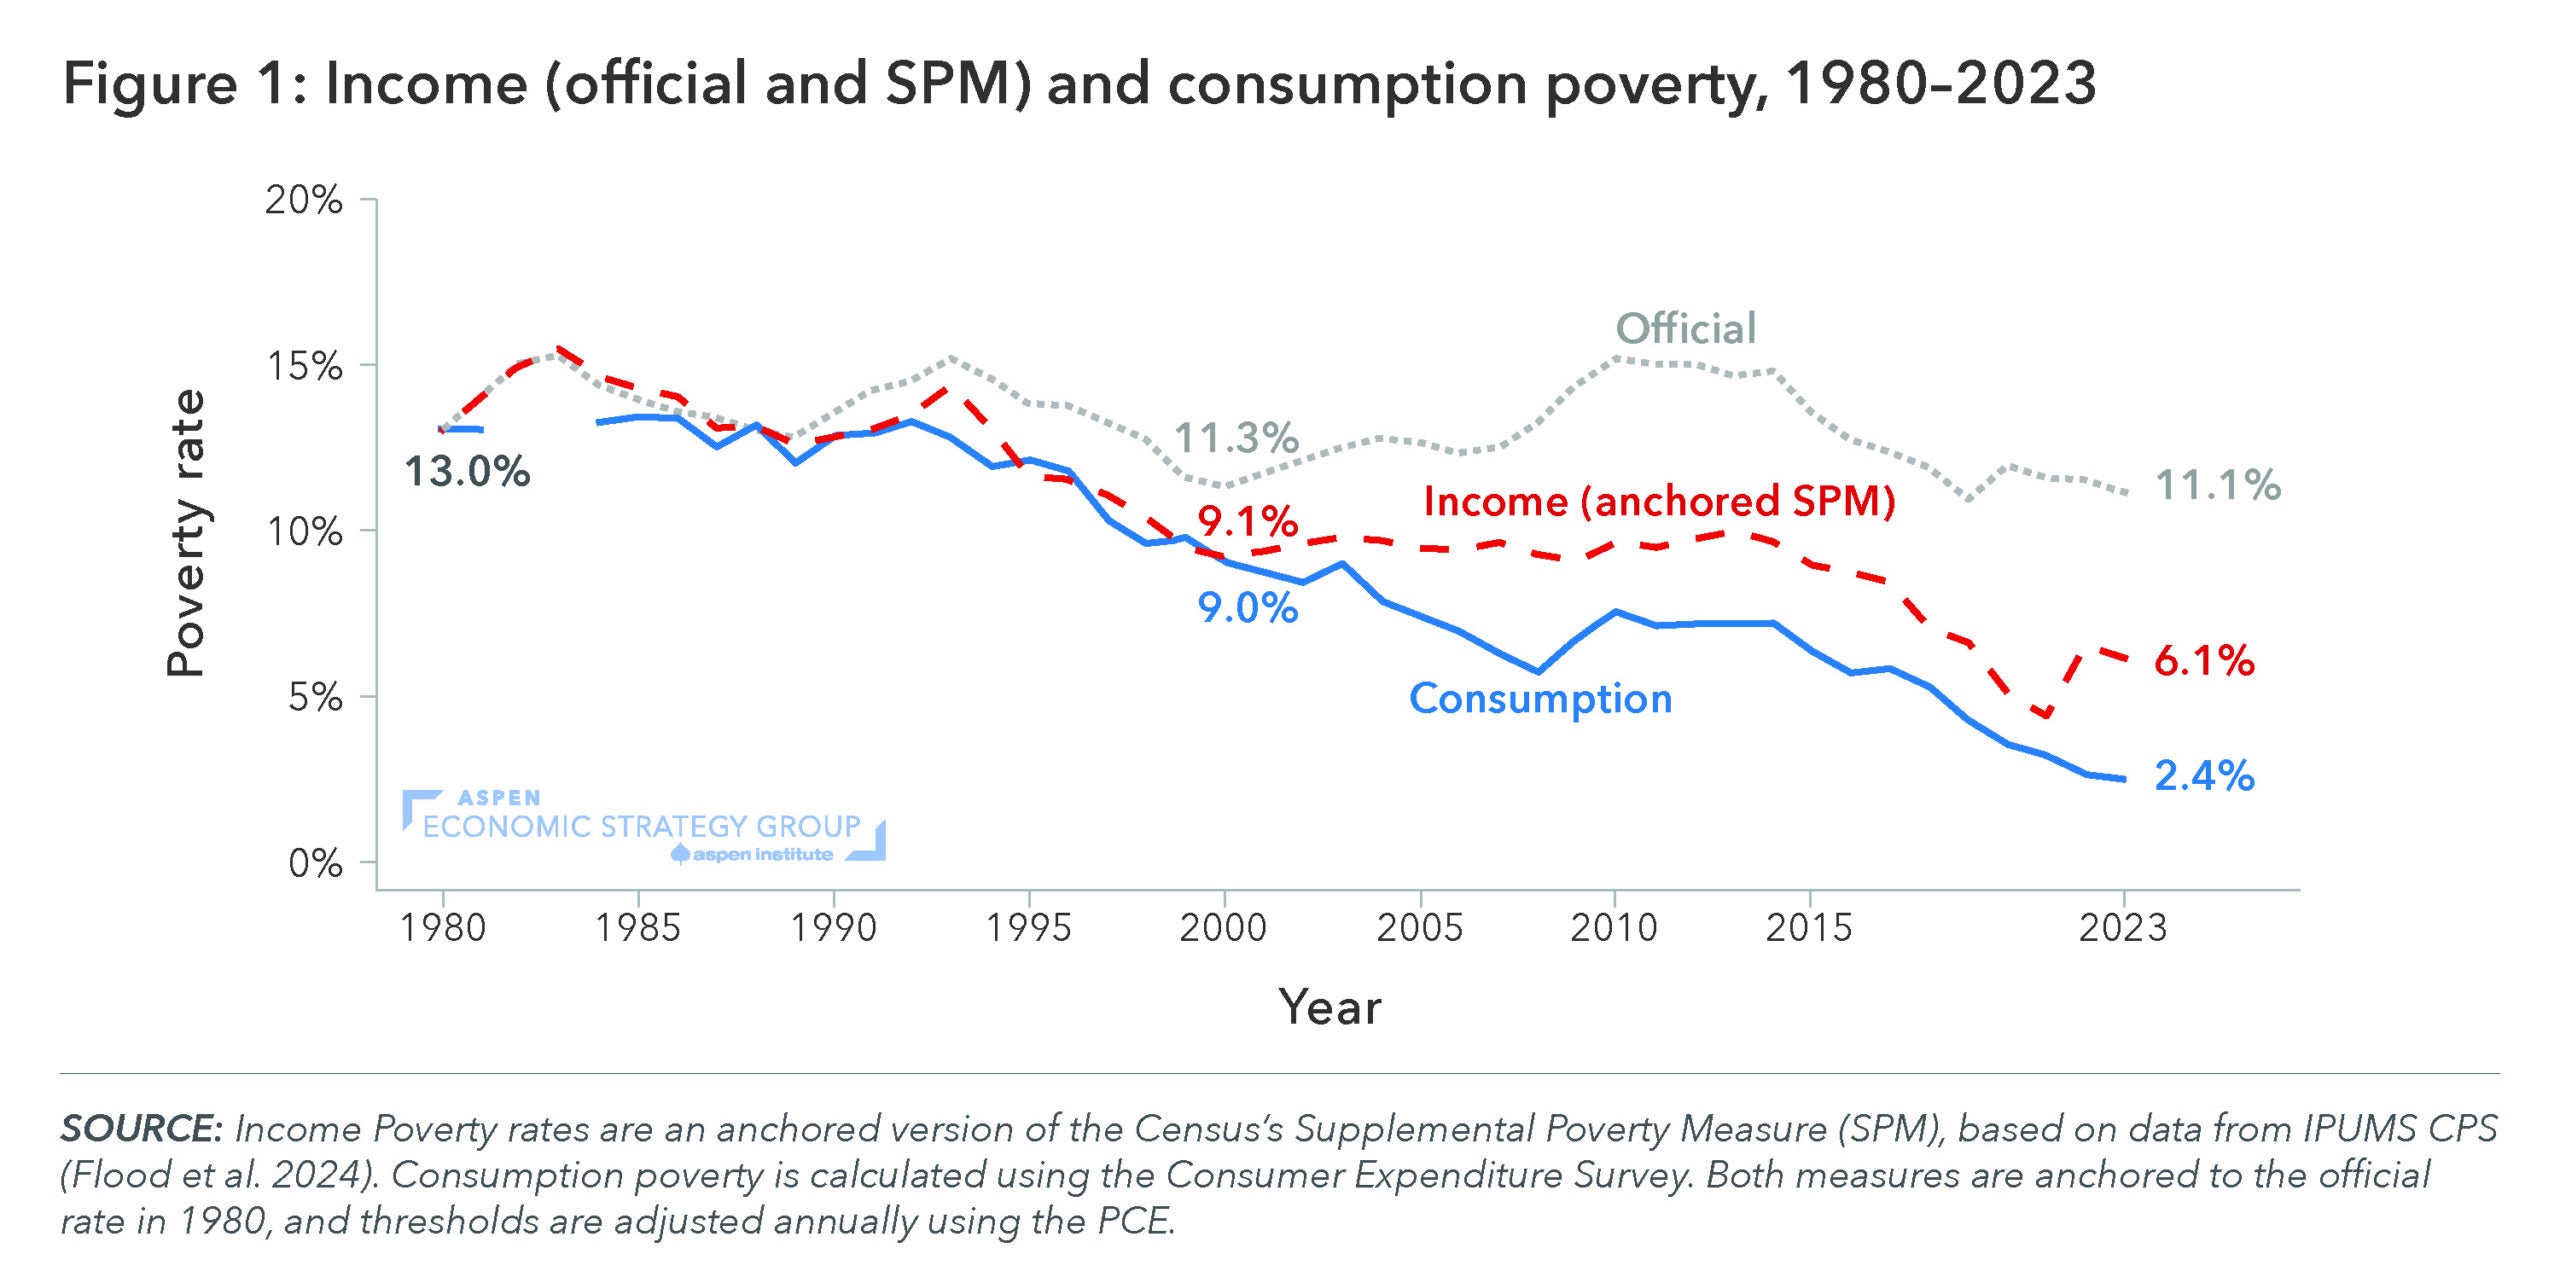
For many years, policymakers and pundits have claimed that US poverty has not fallen. In their paper, Beyond the Myths: A Clearer Path to Poverty Alleviation in America, Melissa S. Kearney and James Sullivan dispel that myth and document that poverty has, in fact, declined substantially over the past four decades. They show that anti-poverty programs have played an important role in this progress, along with increased earnings.
Figure 3: Poverty rates are elevated among families headed by unmarried parents without a four-year college degree. The link between poverty and family structure exists for all major race and ethnic groups in the US.

In their paper, Kearney and Sullivan emphasize that sustained progress towards alleviating poverty requires investing in people’s capacity to succeed, with particular attention to four areas: developing skills, strengthening families, removing barriers to individual flourishing, and expanding upward mobility for children born into disadvantaged circumstances.
Figure 4: Medicaid has grown from a small, targeted safety net program into a major national health-insurance provider, covering nearly one in four Americans.
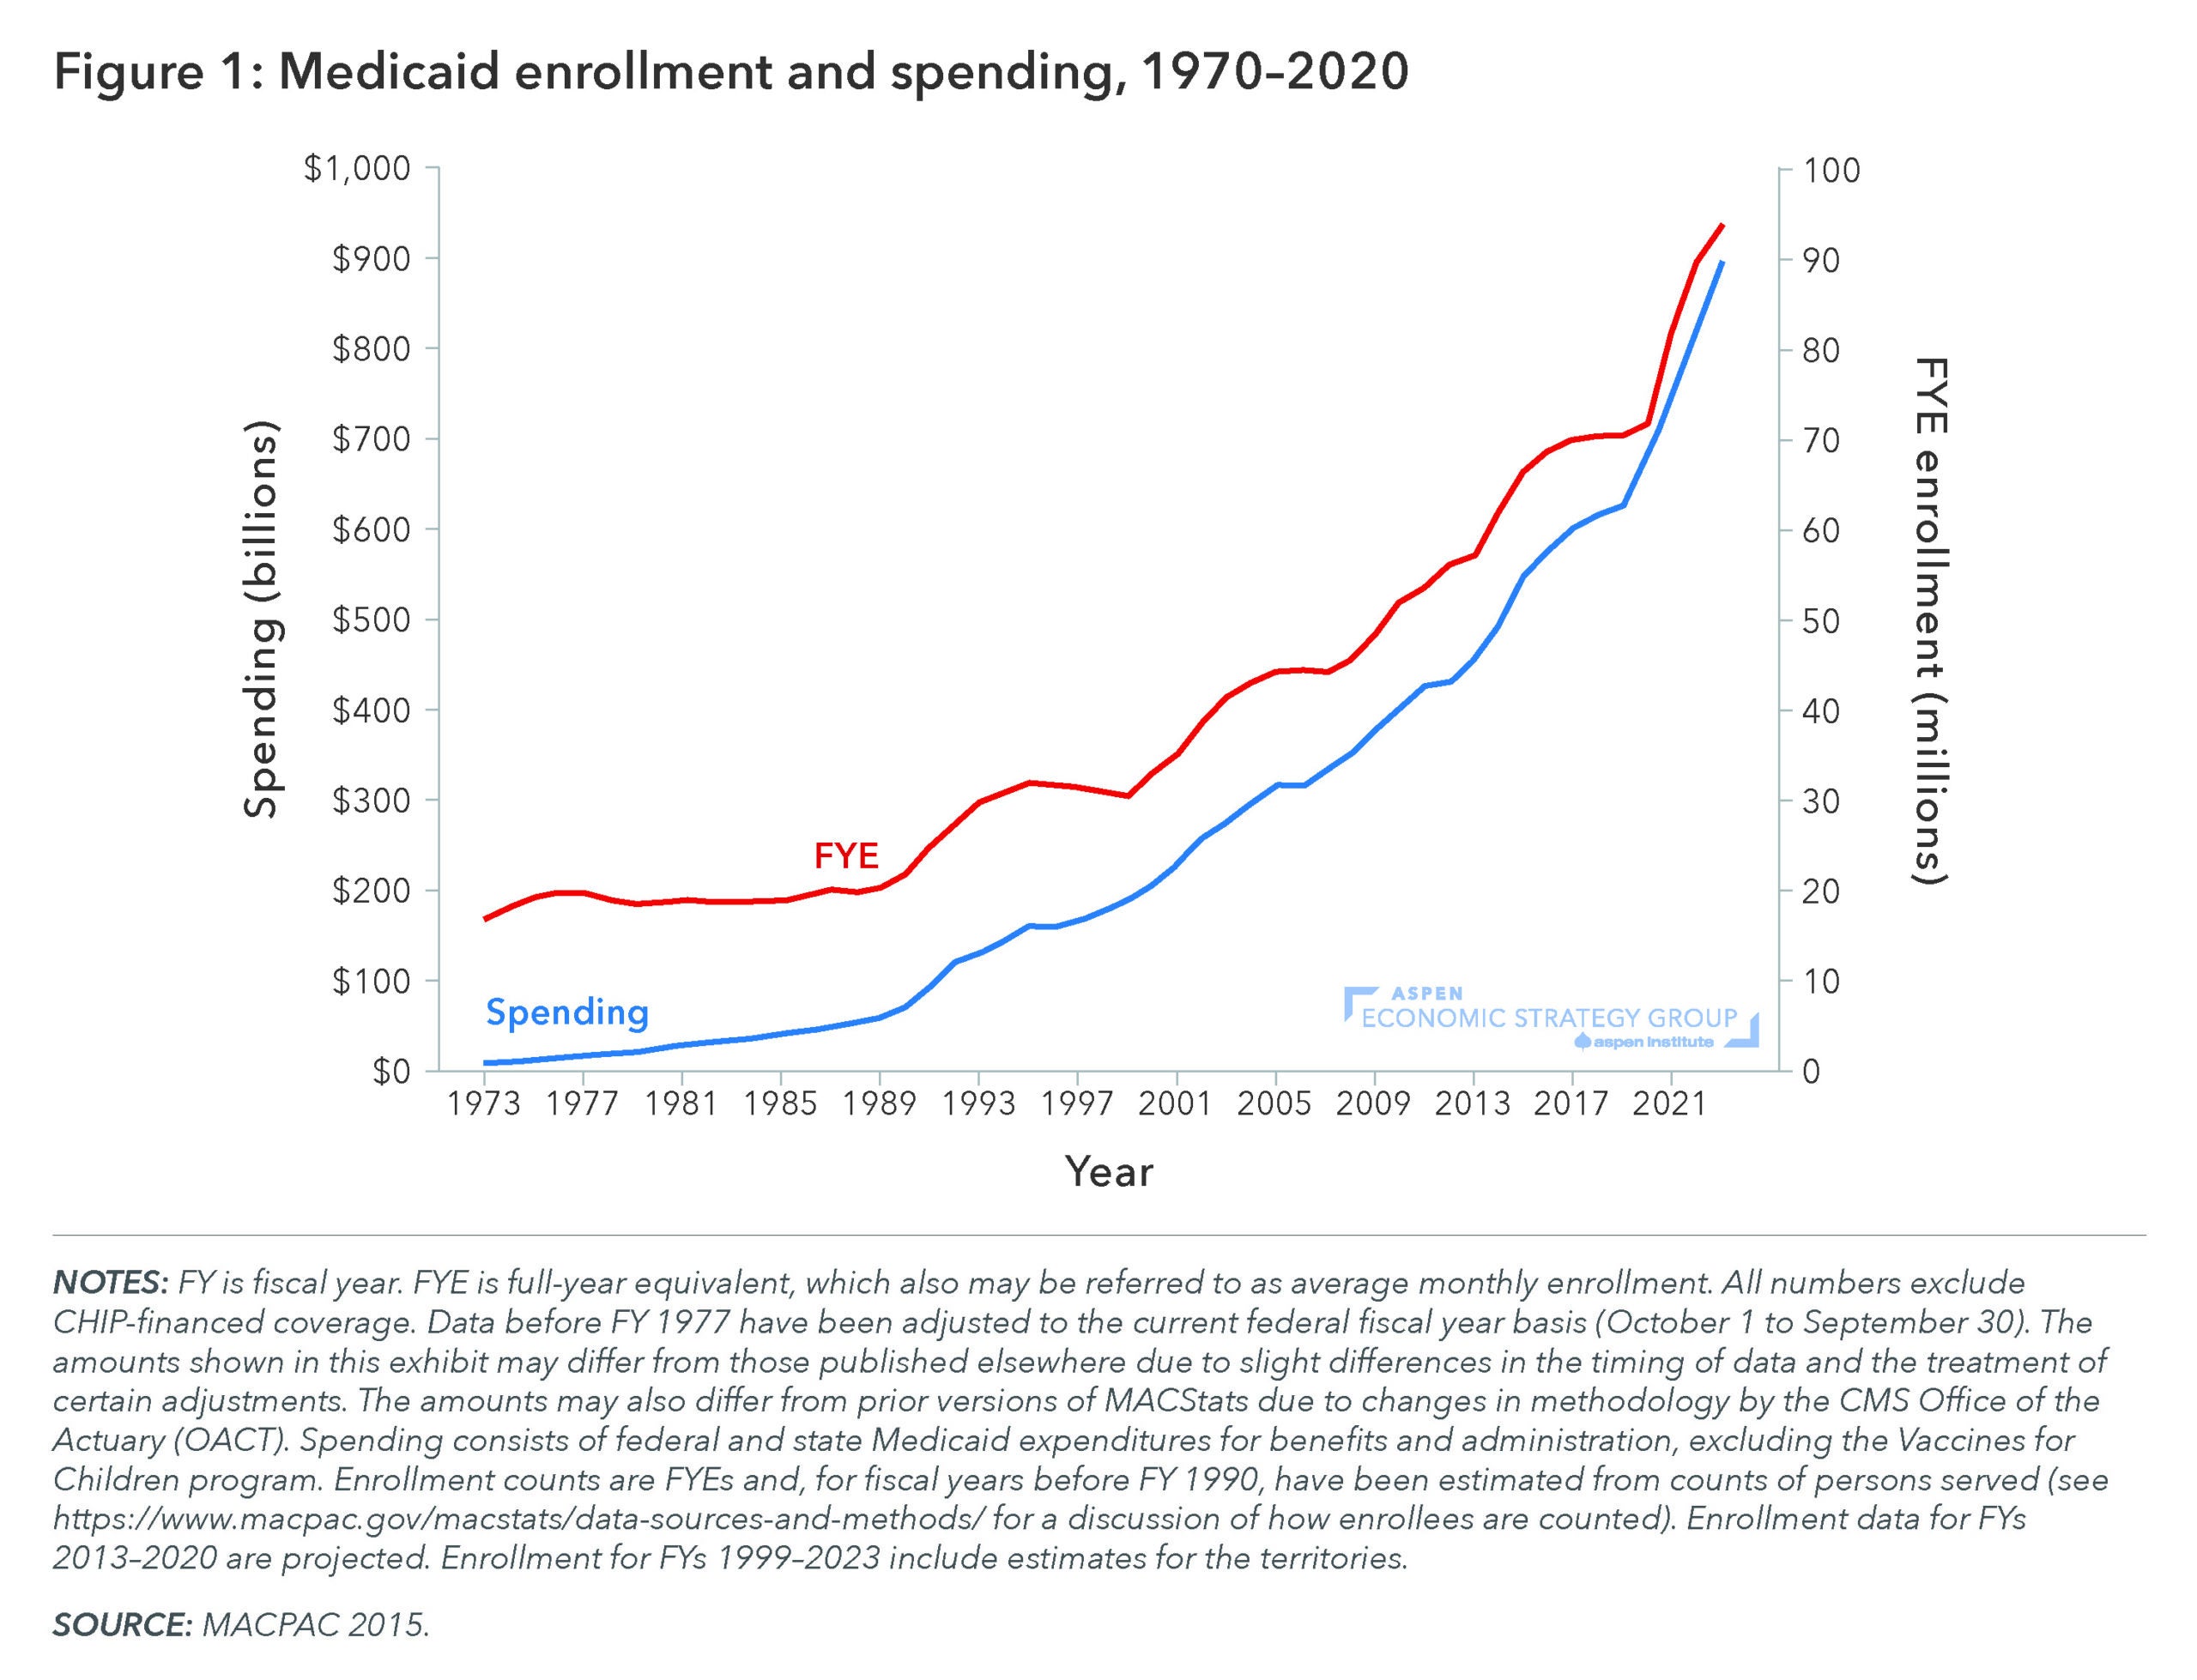
In Coverage Isn’t Care: An Abundance Agenda for Medicaid, Craig Garthwaite and Timothy Layton provide an overview of the Medicaid program; put forward a framework for thinking about the appropriate structure of the program; and propose a set of fundamental reforms aimed at improving the efficiency of the program.
Figure 5: Nearly 50 percent of renters in the US pay more than 30 percent of their income toward rent.
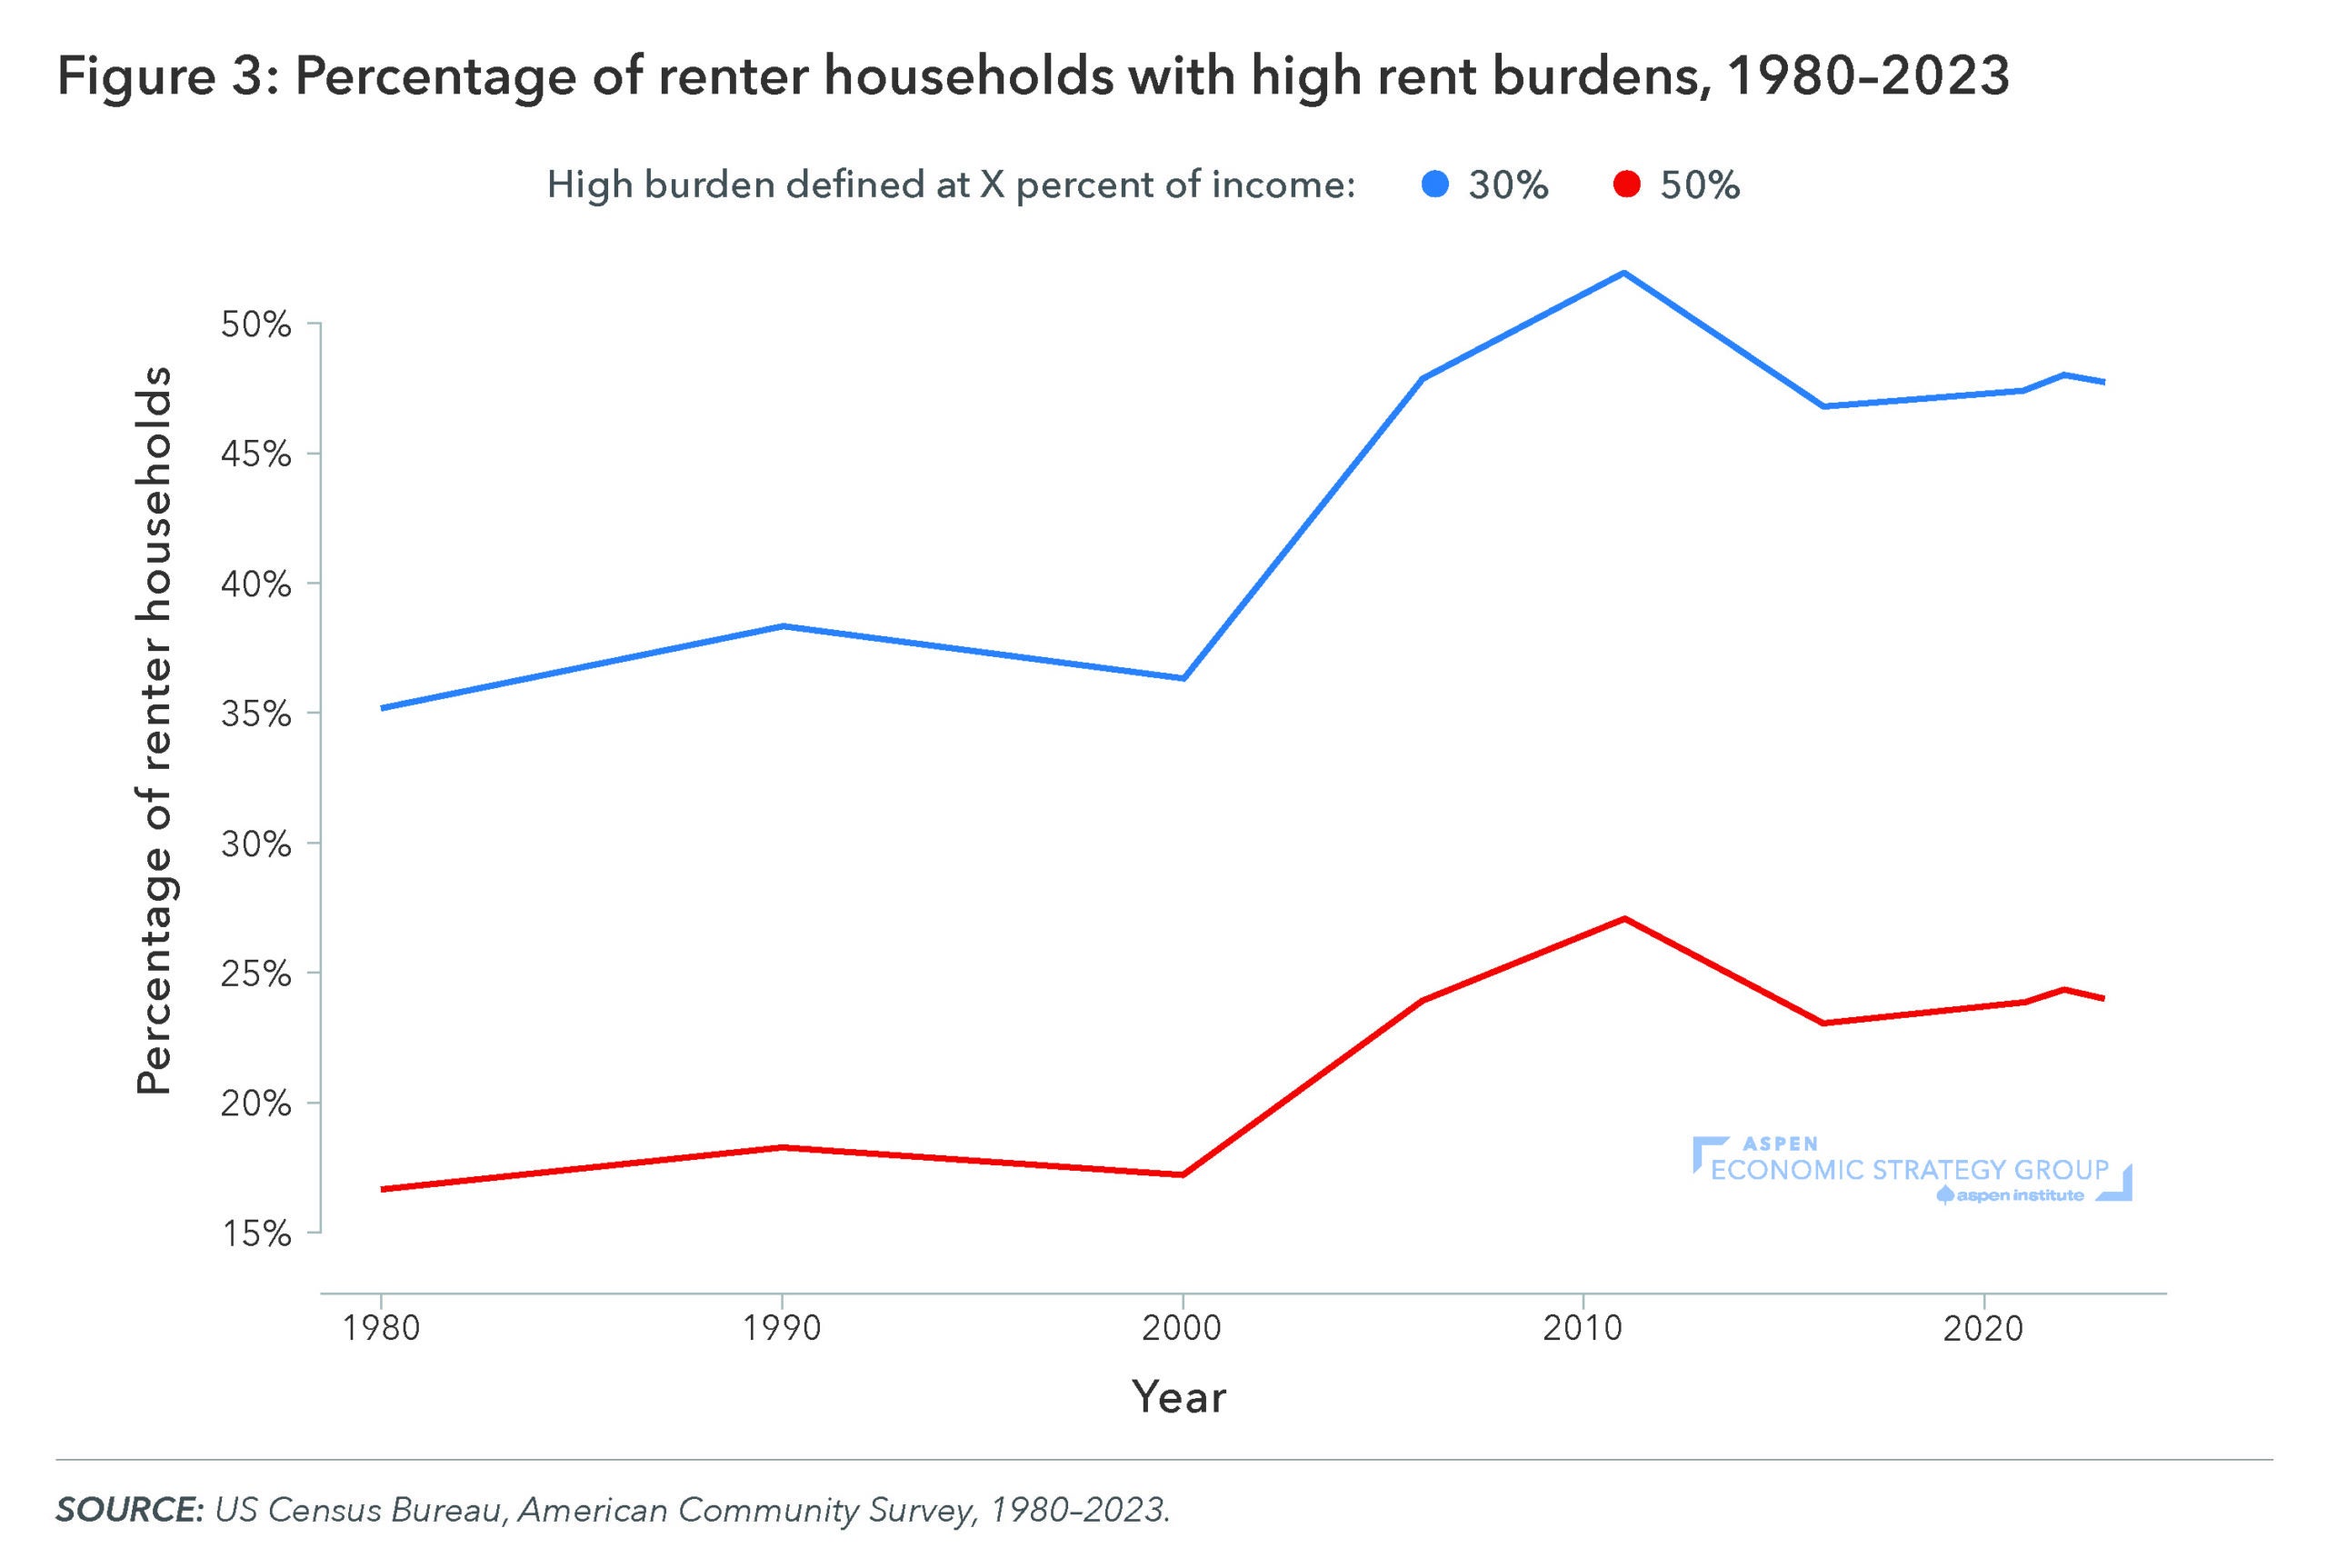
Vincent Reina and Benjamin Keys lay out key facts about the decline in housing affordability in the US and assess the drivers of this challenge in Improving Housing Affordability. They find that from 1980 to 2023, median inflation-adjusted rent has nearly doubled, while the share of renters who are “rent burdened” – spending over 30 percent of their income on housing – has risen from 35 to 48 percent.
Figure 6: At the same time, homeownership has become increasingly out of reach in US metro areas.
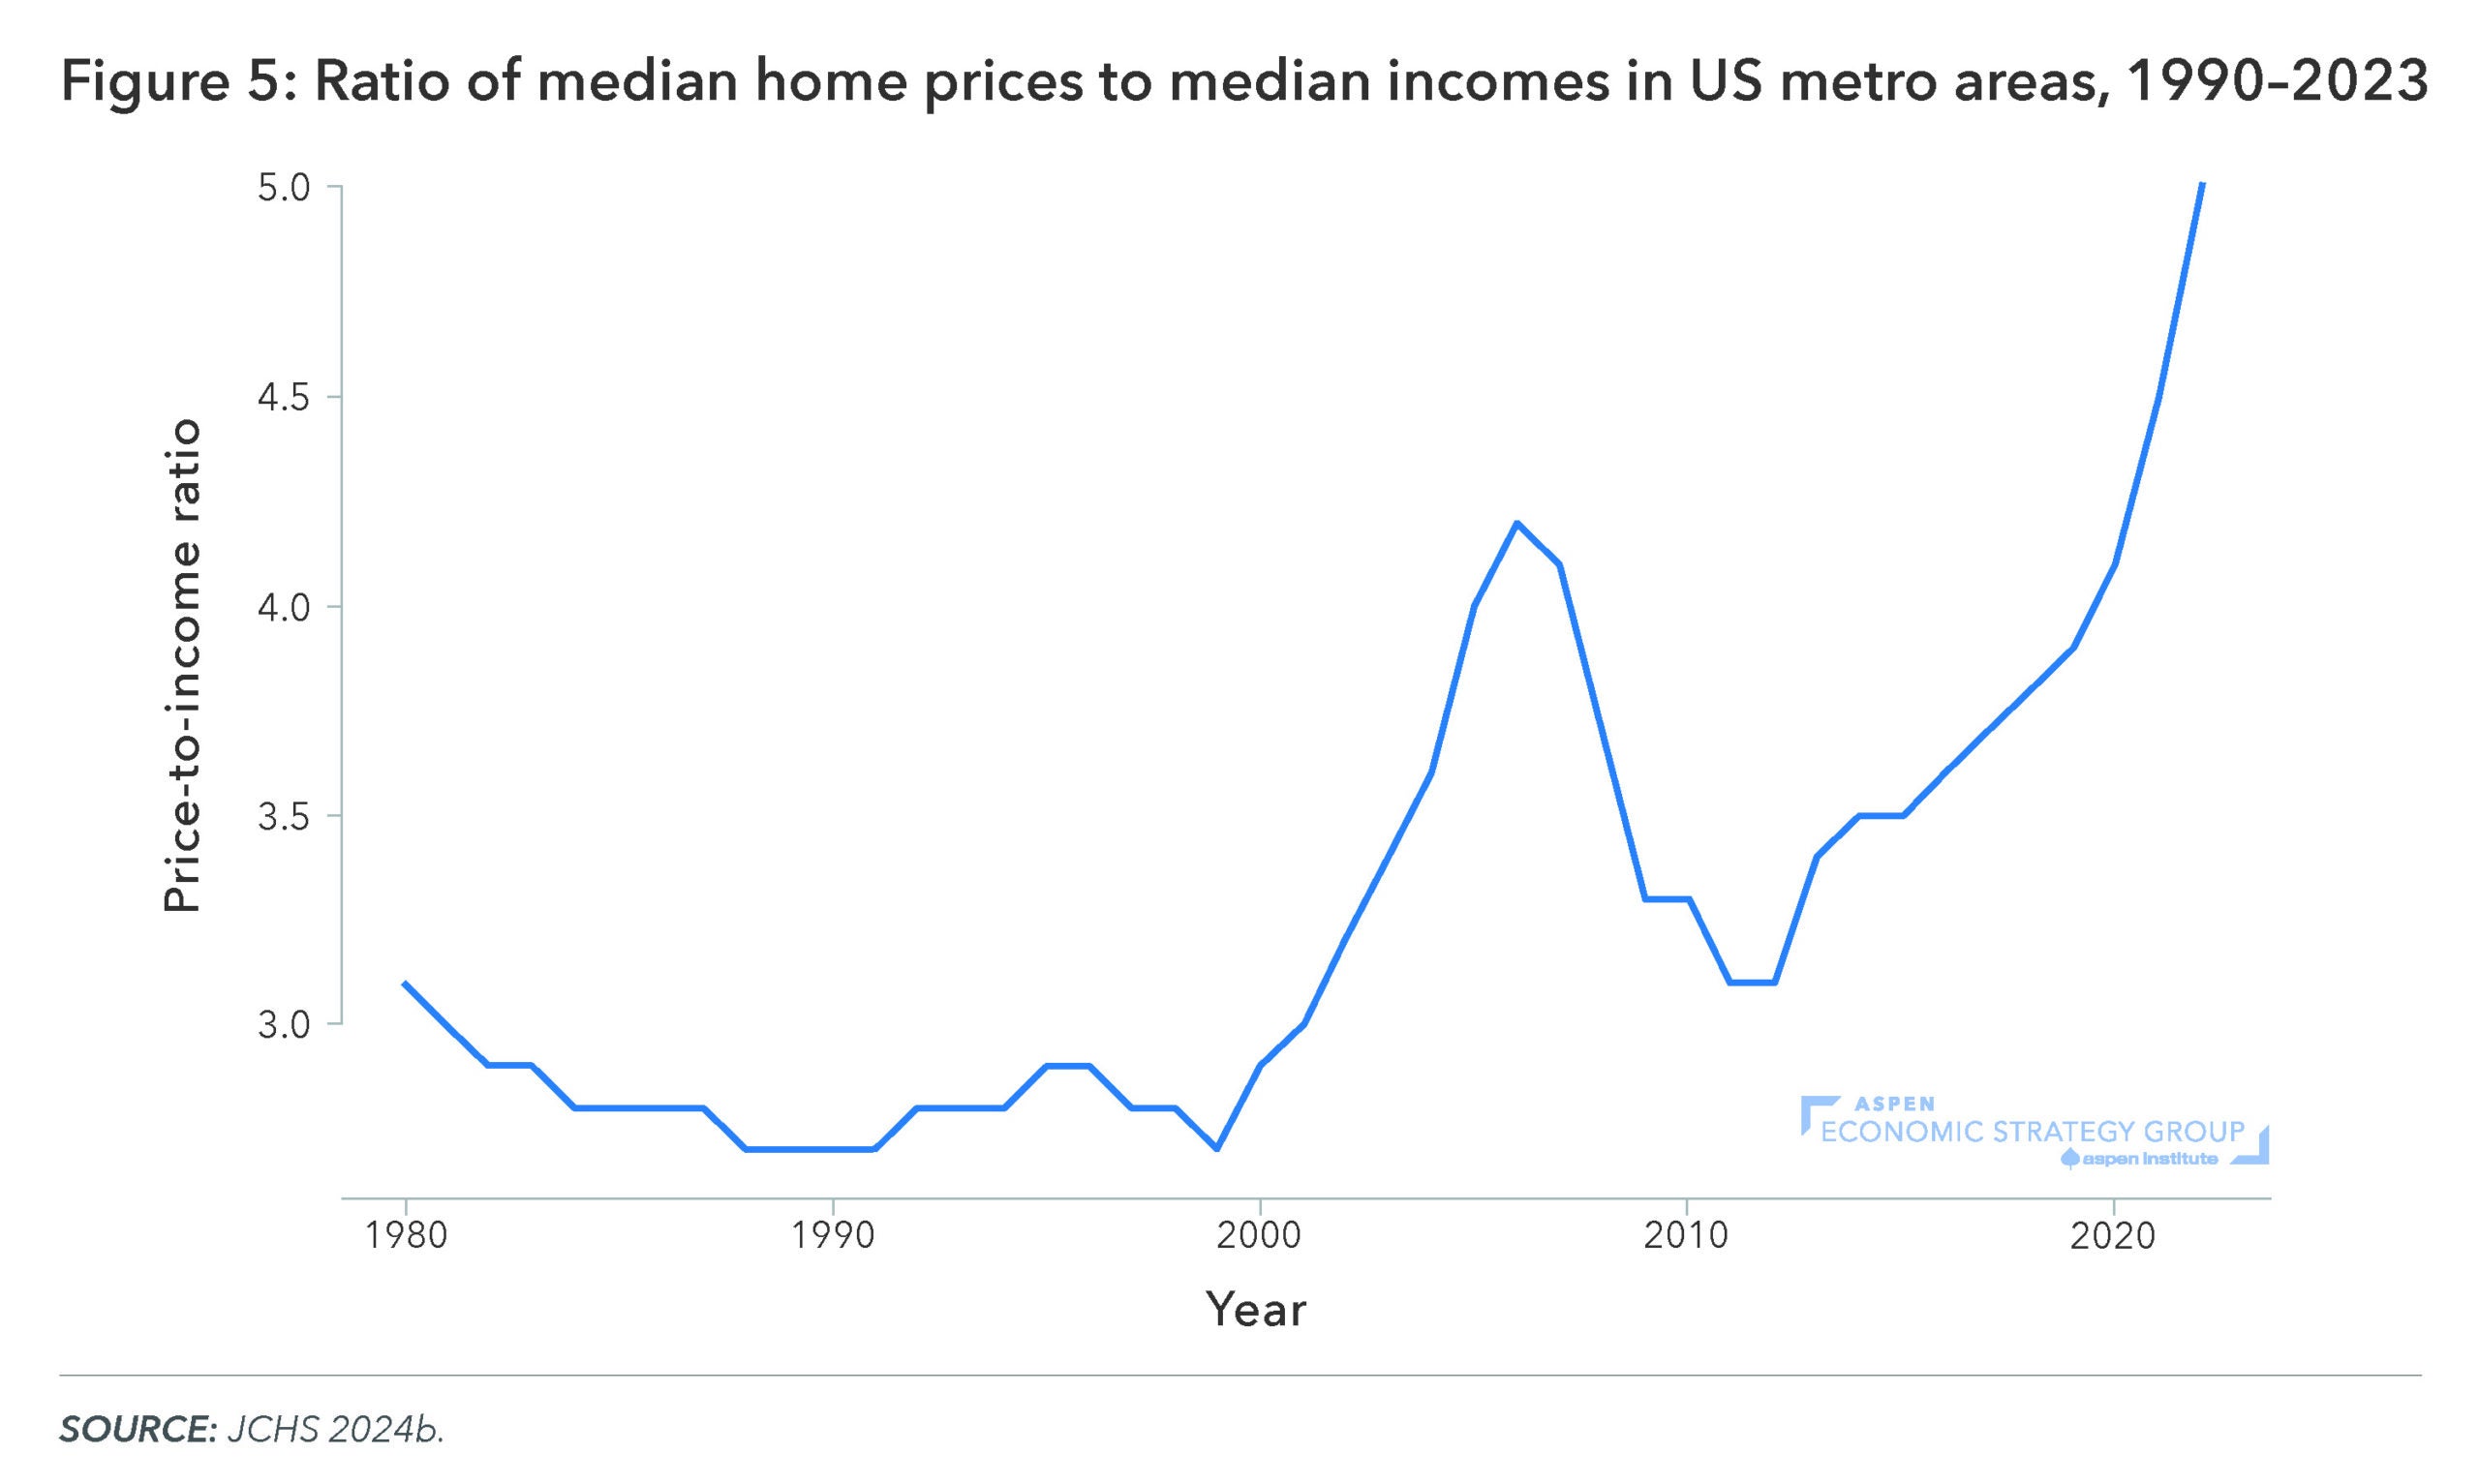
Keys and Reina point out that the ratio of median home sale price to median income in the US increased from 2.4 in 1990 to 5 in 2023, surpassing the prior high at the peak of the housing boom in the first decade of the 2000s.
Figure 7: After decades of low energy costs and flat consumption, the US is now poised for a surge in power demand.
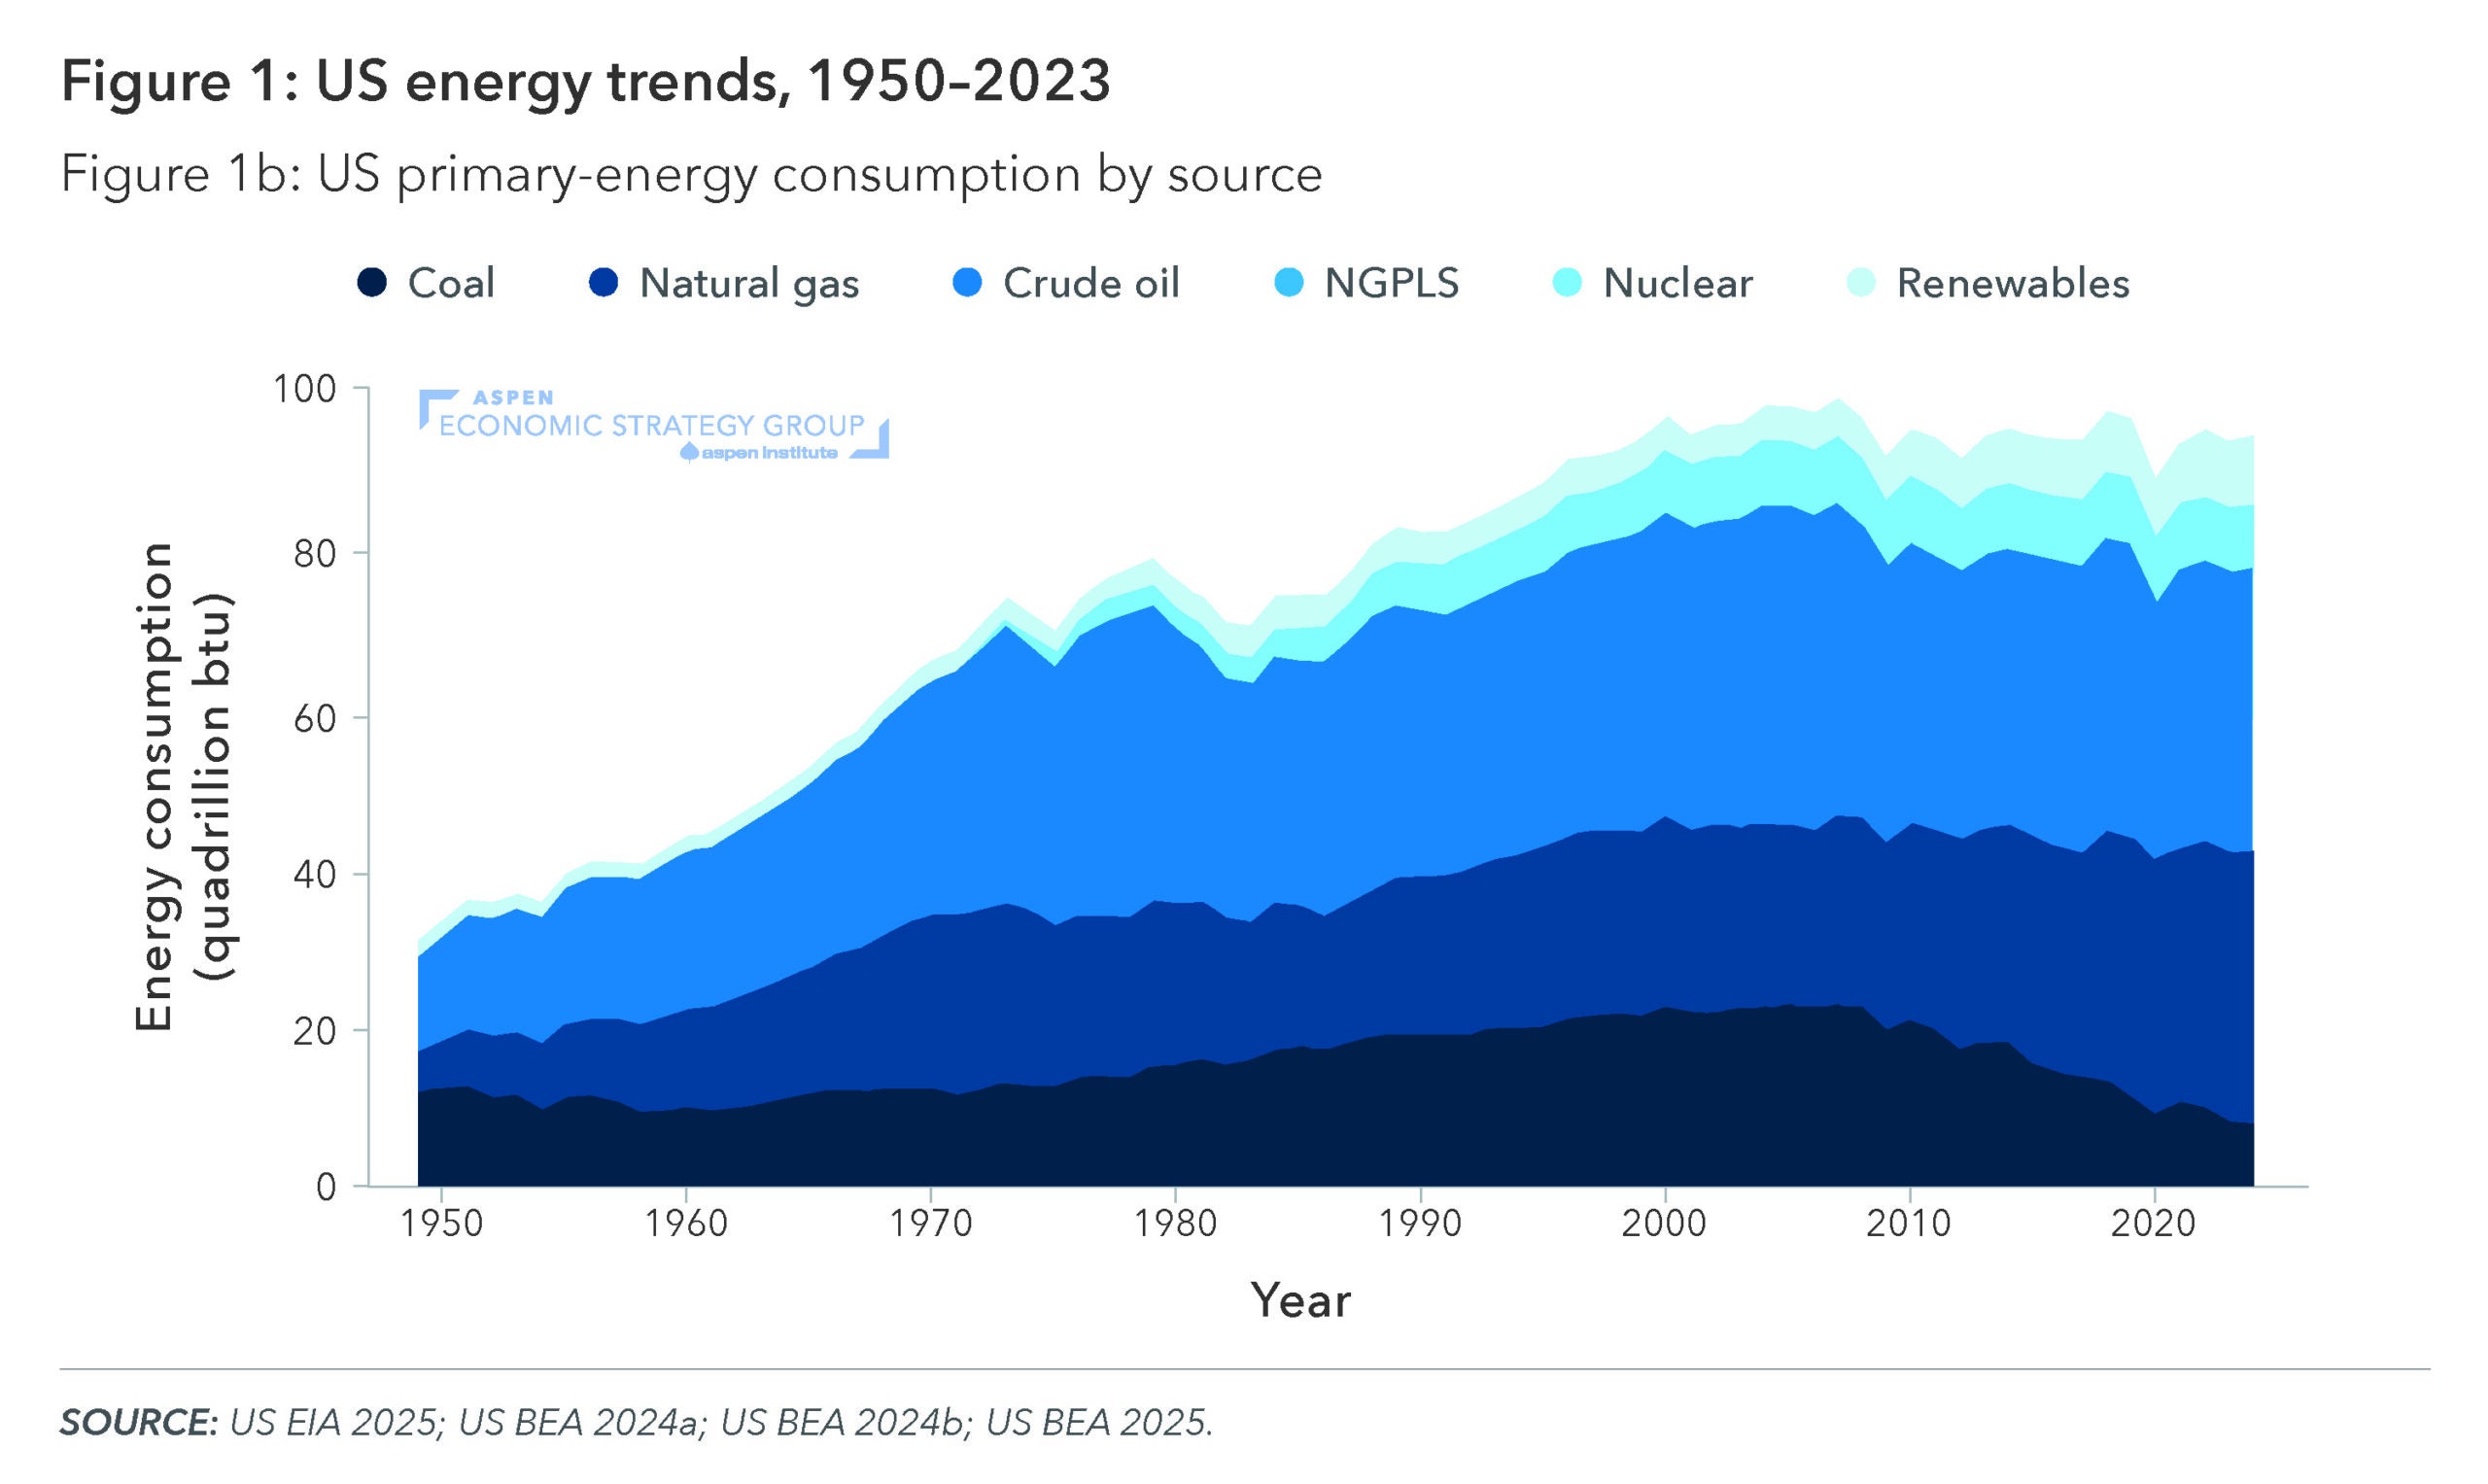
The increase in power demand, driven by developments in artificial intelligence, domestic manufacturing, and continued electrification, will challenge an already-constrained electricity grid. In An Energy Strategy for National Renewal, Joseph Majkut outlines a strategy to boost energy generation, build transmission infrastructure, and approach greenhouse-gas emissions reductions while prioritizing global economic competitiveness.
Figure 8: The laws that govern high-skilled immigration are outdated and misaligned with the needs of today’s economy.

Each year, the US issues about one million green cards, but only 7 percent go to individuals selected on the basis of their skills or job offers. In Aligning High-Skilled Immigration Policy with National Strategy, Jeremy Neufeld outlines the shortcomings of the current high-skill immigration system and offers policy reforms that would advance the United States’s ability to attract, select, and retain the world’s most promising workers.
Figure 9: Confusion about college pricing stems from the gap between the “sticker price,” and the lower net amount that many students pay after receiving financial aid.
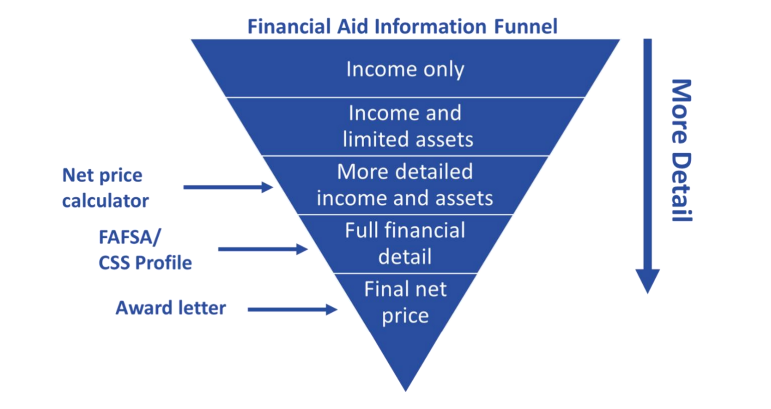
As of the 2019–2020 academic year, only 26 percent of in-state students at public colleges and 16 percent of students at private, nonprofit colleges paid the full sticker price. In his AESG policy brief, Transparency in College Pricing: Still More Work to Do, Phillip Levine proposes the creation of a “financial aid information funnel,” as a way to help families better understand the true cost of college.
Figure 10: The structure of the US tax code often disincentivizes marriage among low-income partners and reduces the return to work for a lower-earning spouse.
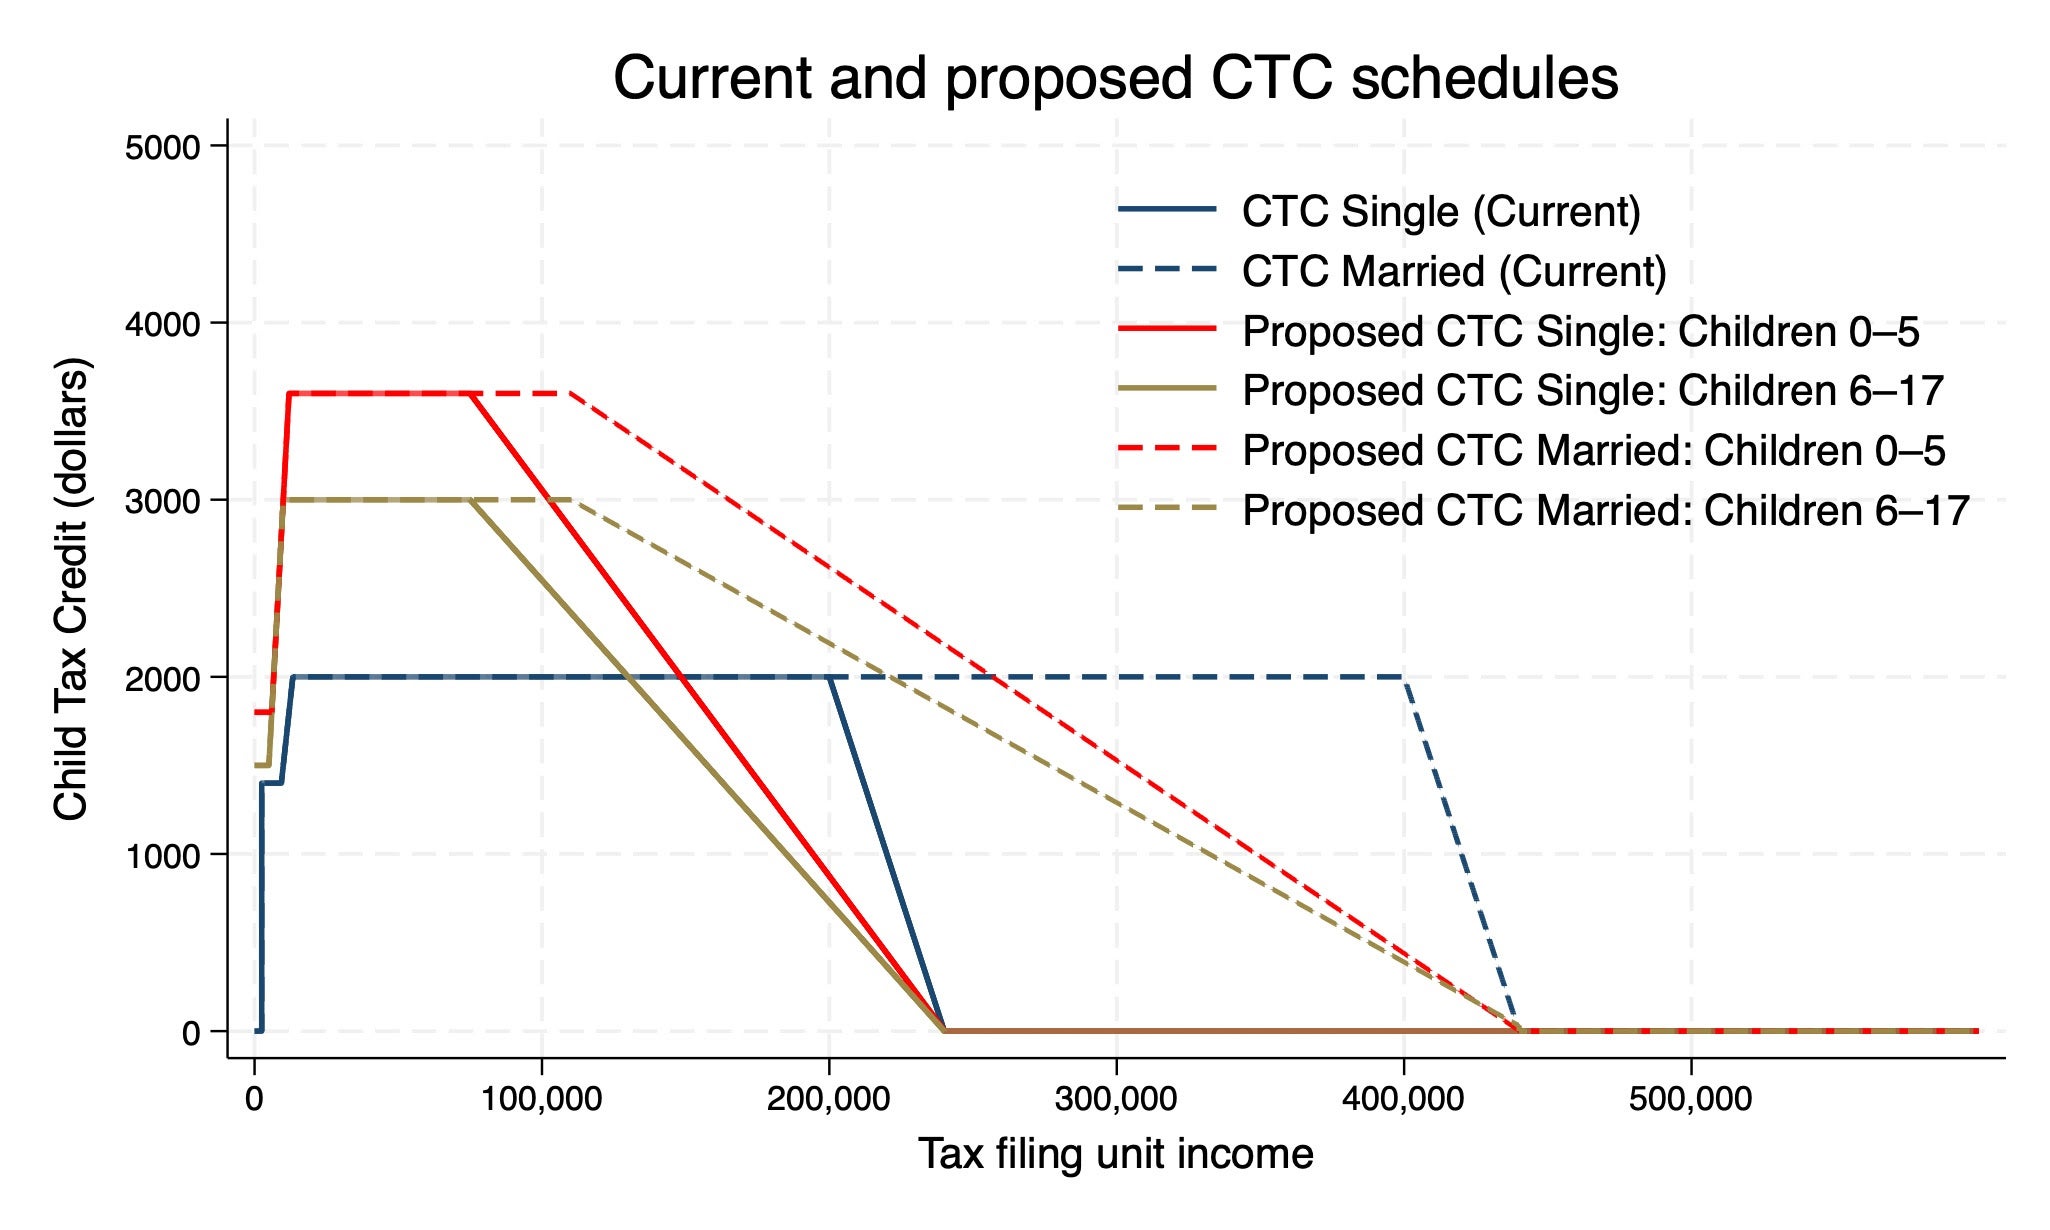
AESG Director Melissa S. Kearney, Policy Director Luke Pardue, and Research Assistant Ella Grant’s policy brief, Supporting Families, Rewarding Work: A Proposal to Reform and Enhance the EITC and the CTC, outlines potential incremental reforms to the Earned Income Tax Credit and Child Tax Credit that would reorient the EITC around its primary purpose of subsidizing wages of low earners, while using the CTC as the primary tool to support families with children.
Figure 11: The US faces long-term demographic headwinds caused in part by a falling birthrate.

Fertility rates in the US have fallen from a recent peak of 69.5 births per 1,000 women 15-44 years old in 2007 to 54.4 in 2023. Recent proposals such as “baby bonuses” and expansions to the Child Tax Credit have cast increased attention on the issue of declining birth rates in the US. The AESG and its director Melissa S. Kearney have highlighted the significant social and economic consequences of the country’s falling birth rate and considered what it will take to reverse current trends.
Figure 12: Shifting demographics and declining fertility have significant long-term economic consequences, particularly on the size of the future working-age population.
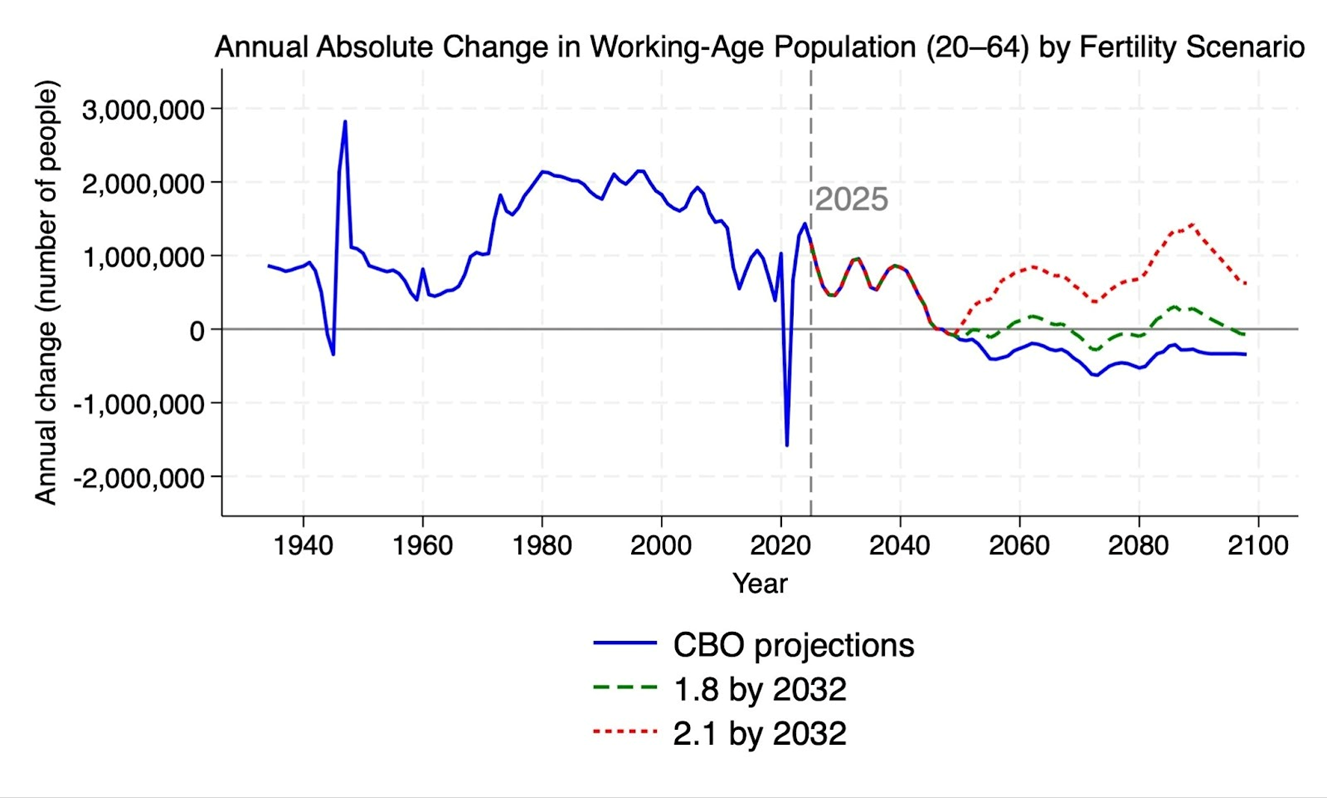
At a panel discussion hosted by the American Enterprise Institute entitled Can We Get Through the Demographic Crunch? The Implications of the 2025 OECD Employment Report, AESG Policy Director Luke Pardue provided remarks on the economic implications of shifting demographics. He pointed out that, absent other changes to population trends, it would take a return to a replacement-level Total Fertility Rate of 2.1 children per 1,000 women by 2032 to maintain the current pace of growth in the working-age population.