Archives: Publications
These are AIESG Publications
Figure 4: Business Wealth as a Component of Top Wealth Portfolios
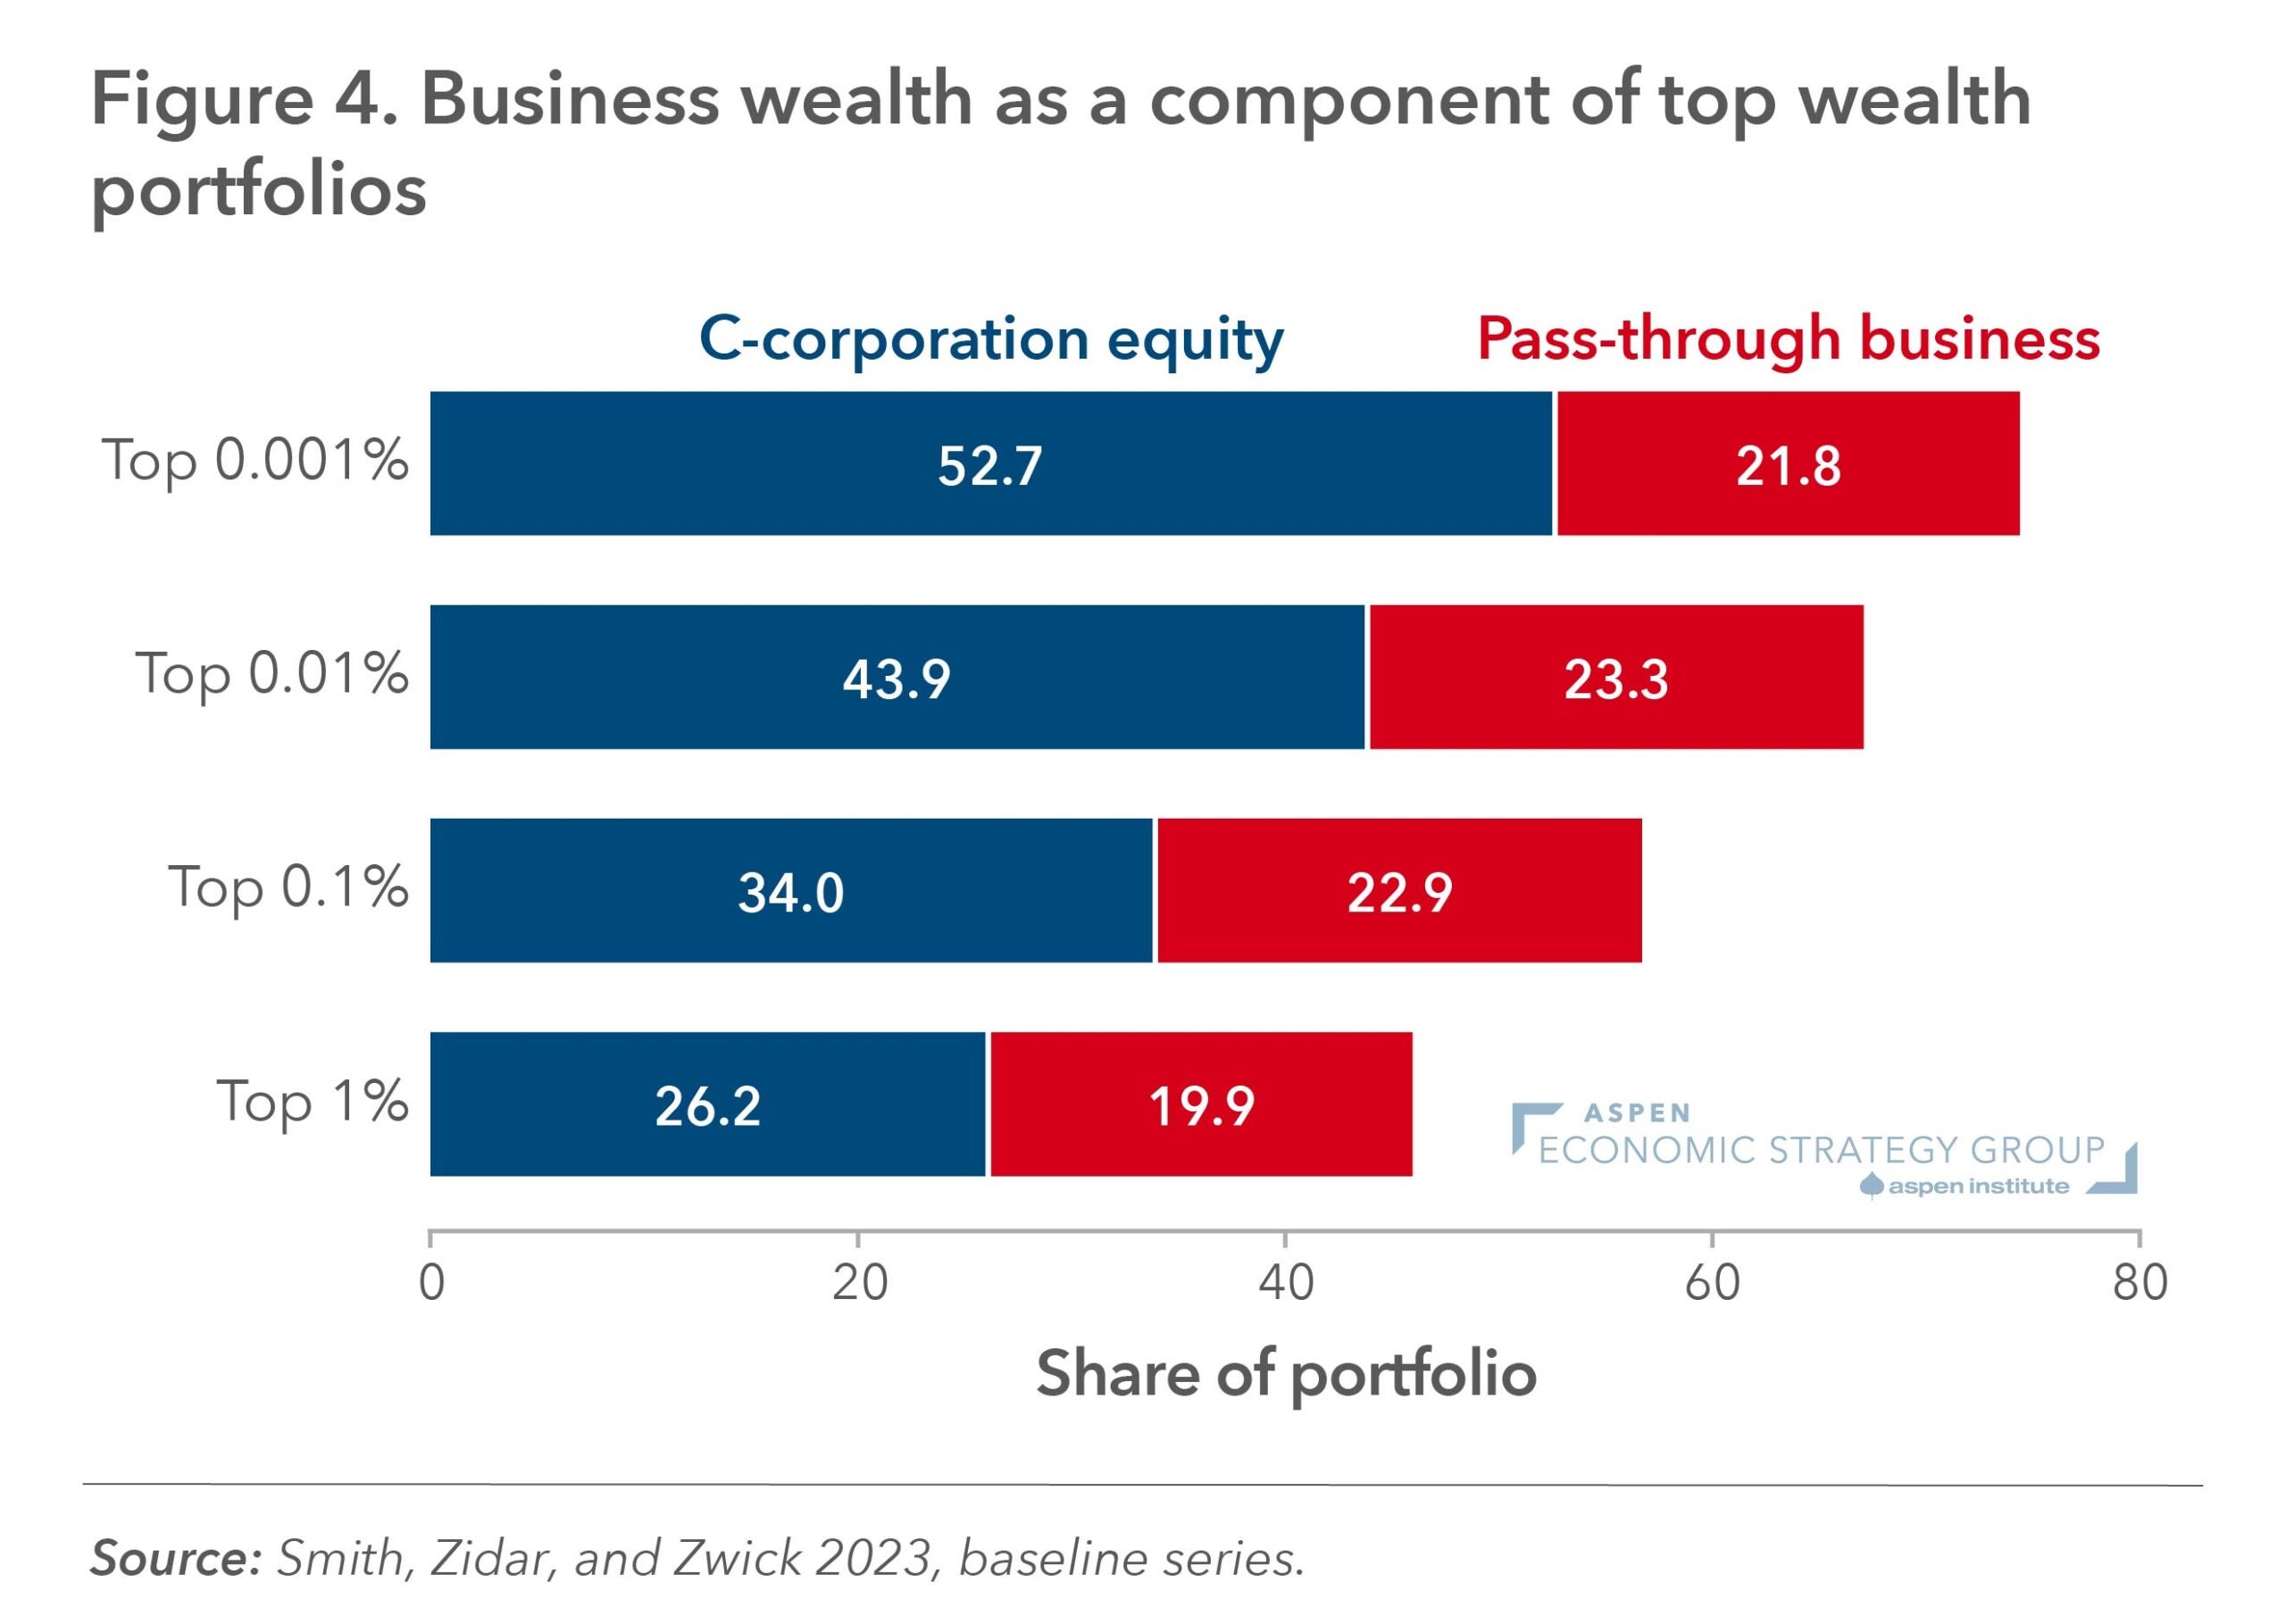
Figure 2: Share of Federal Outlays by Category, 2019
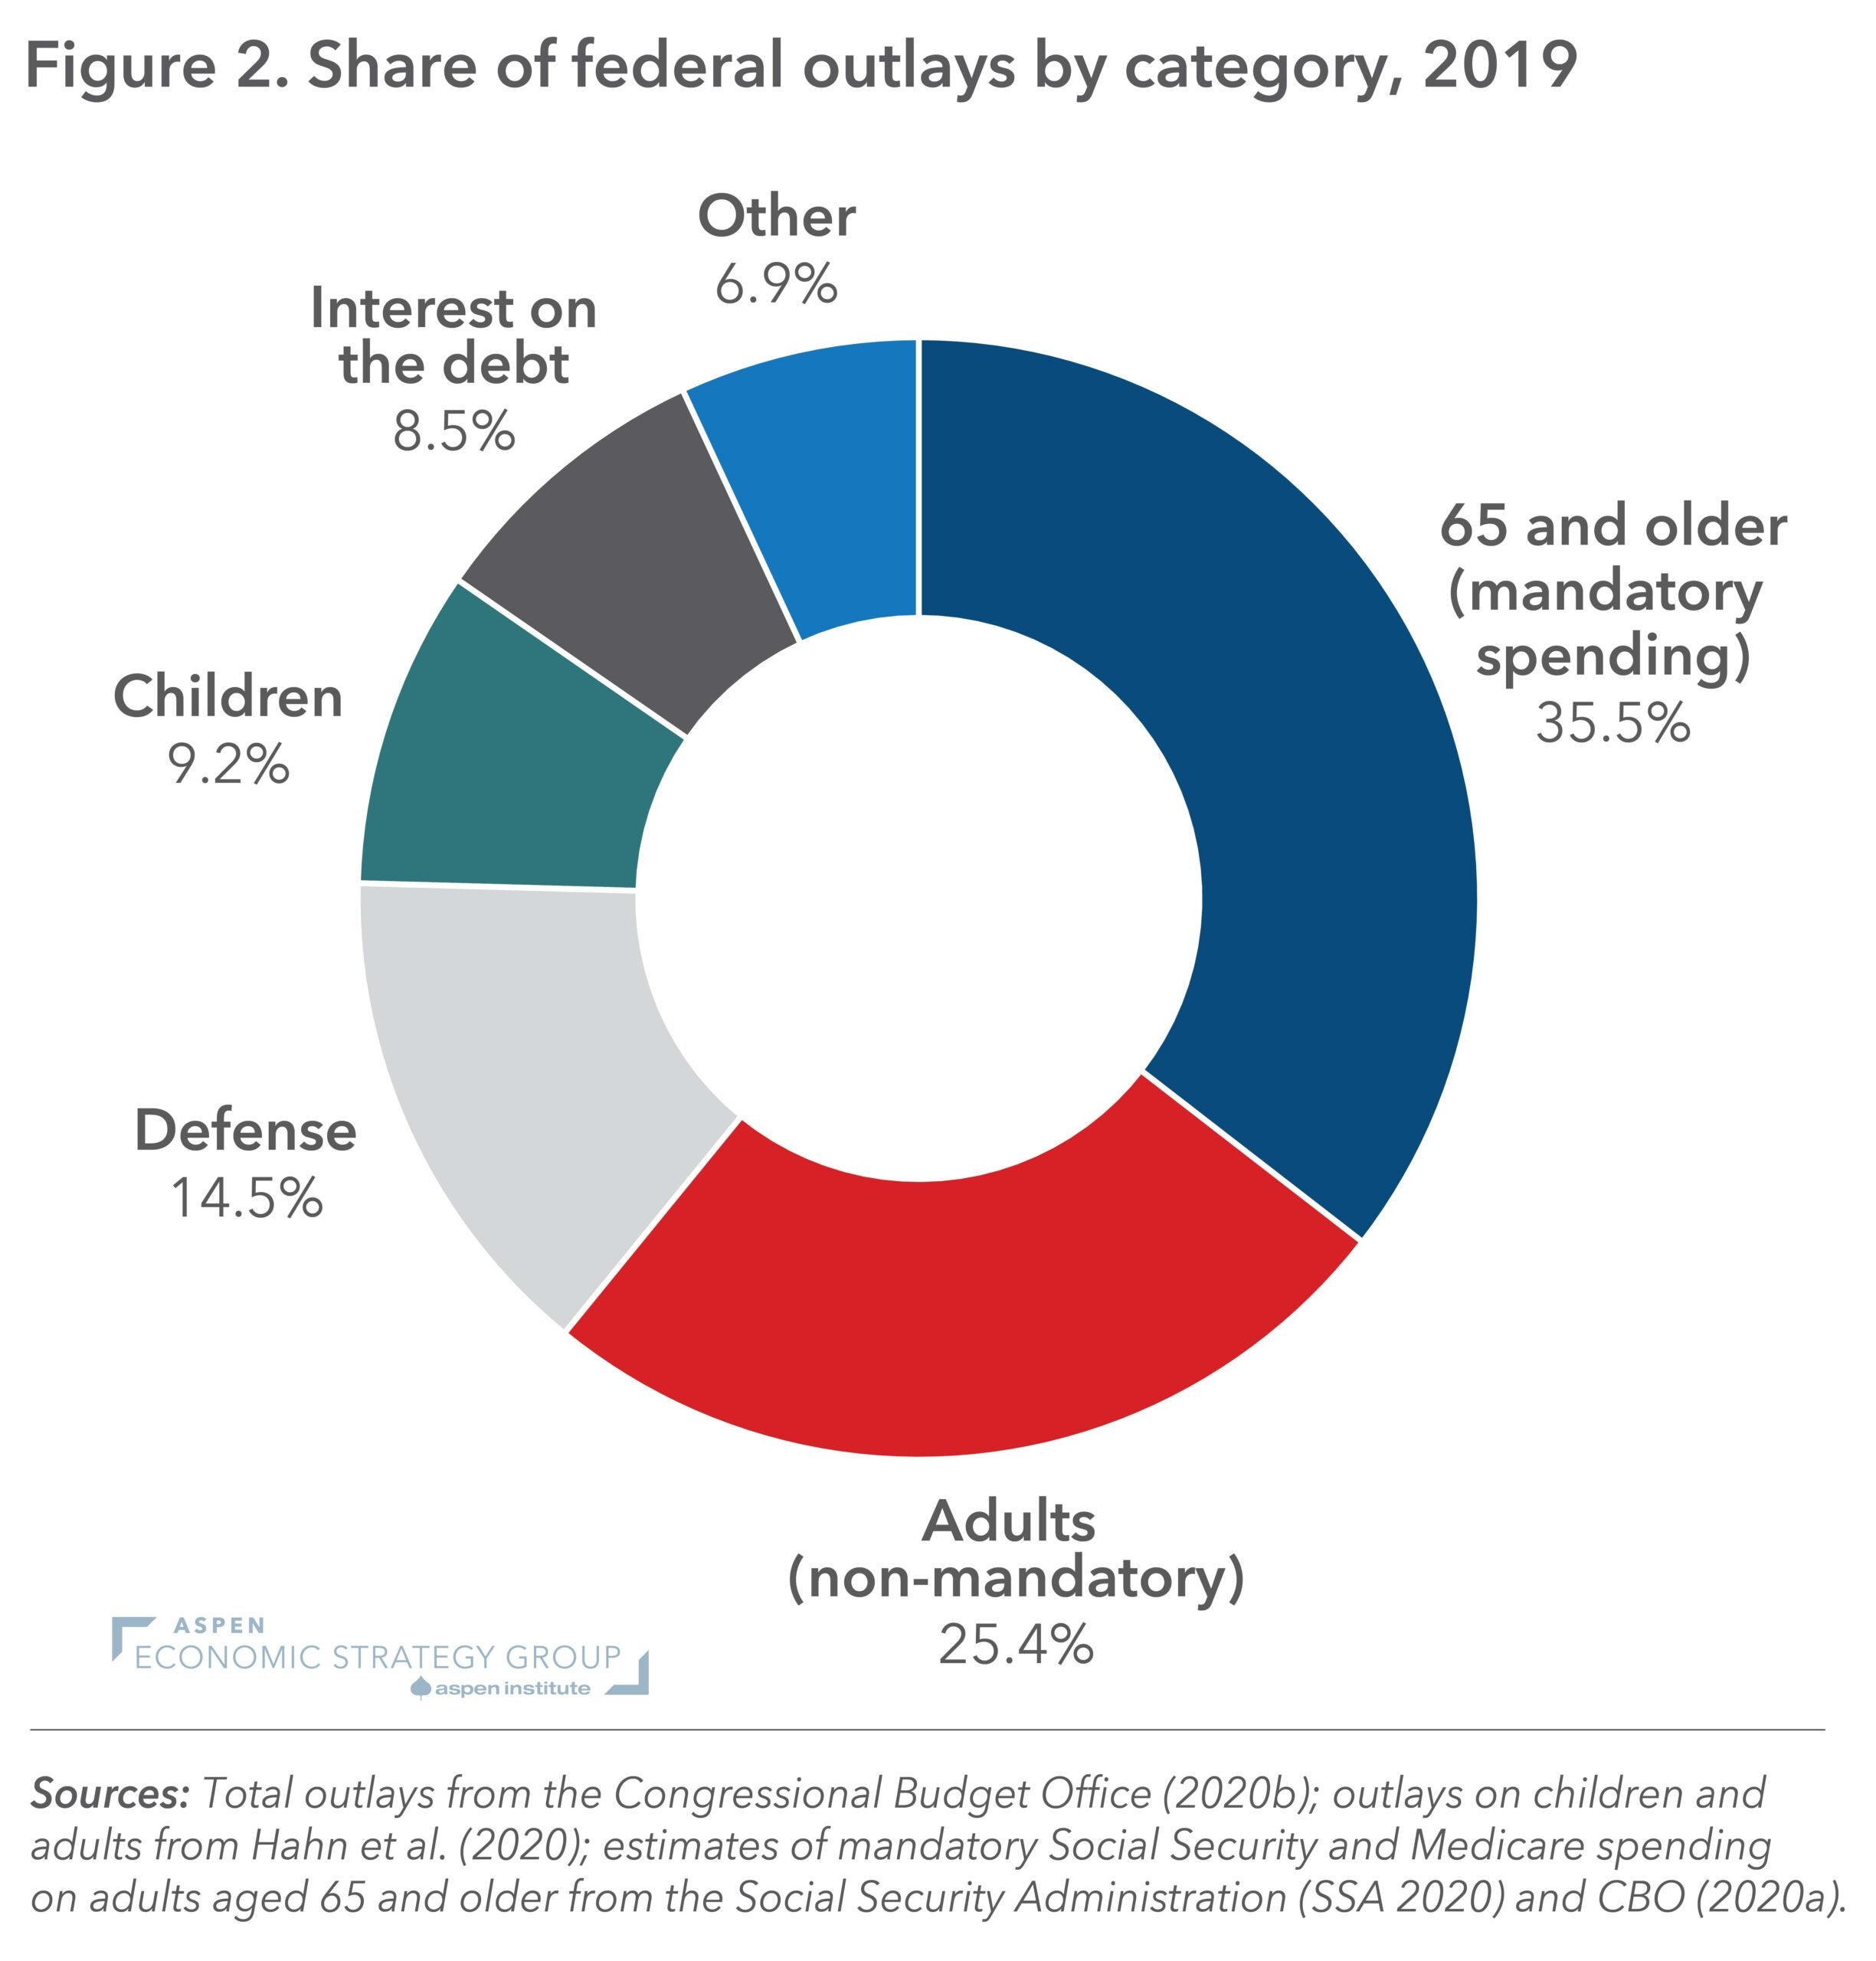
Figure 5: Different vintages of federal debt projections, 2000-2053
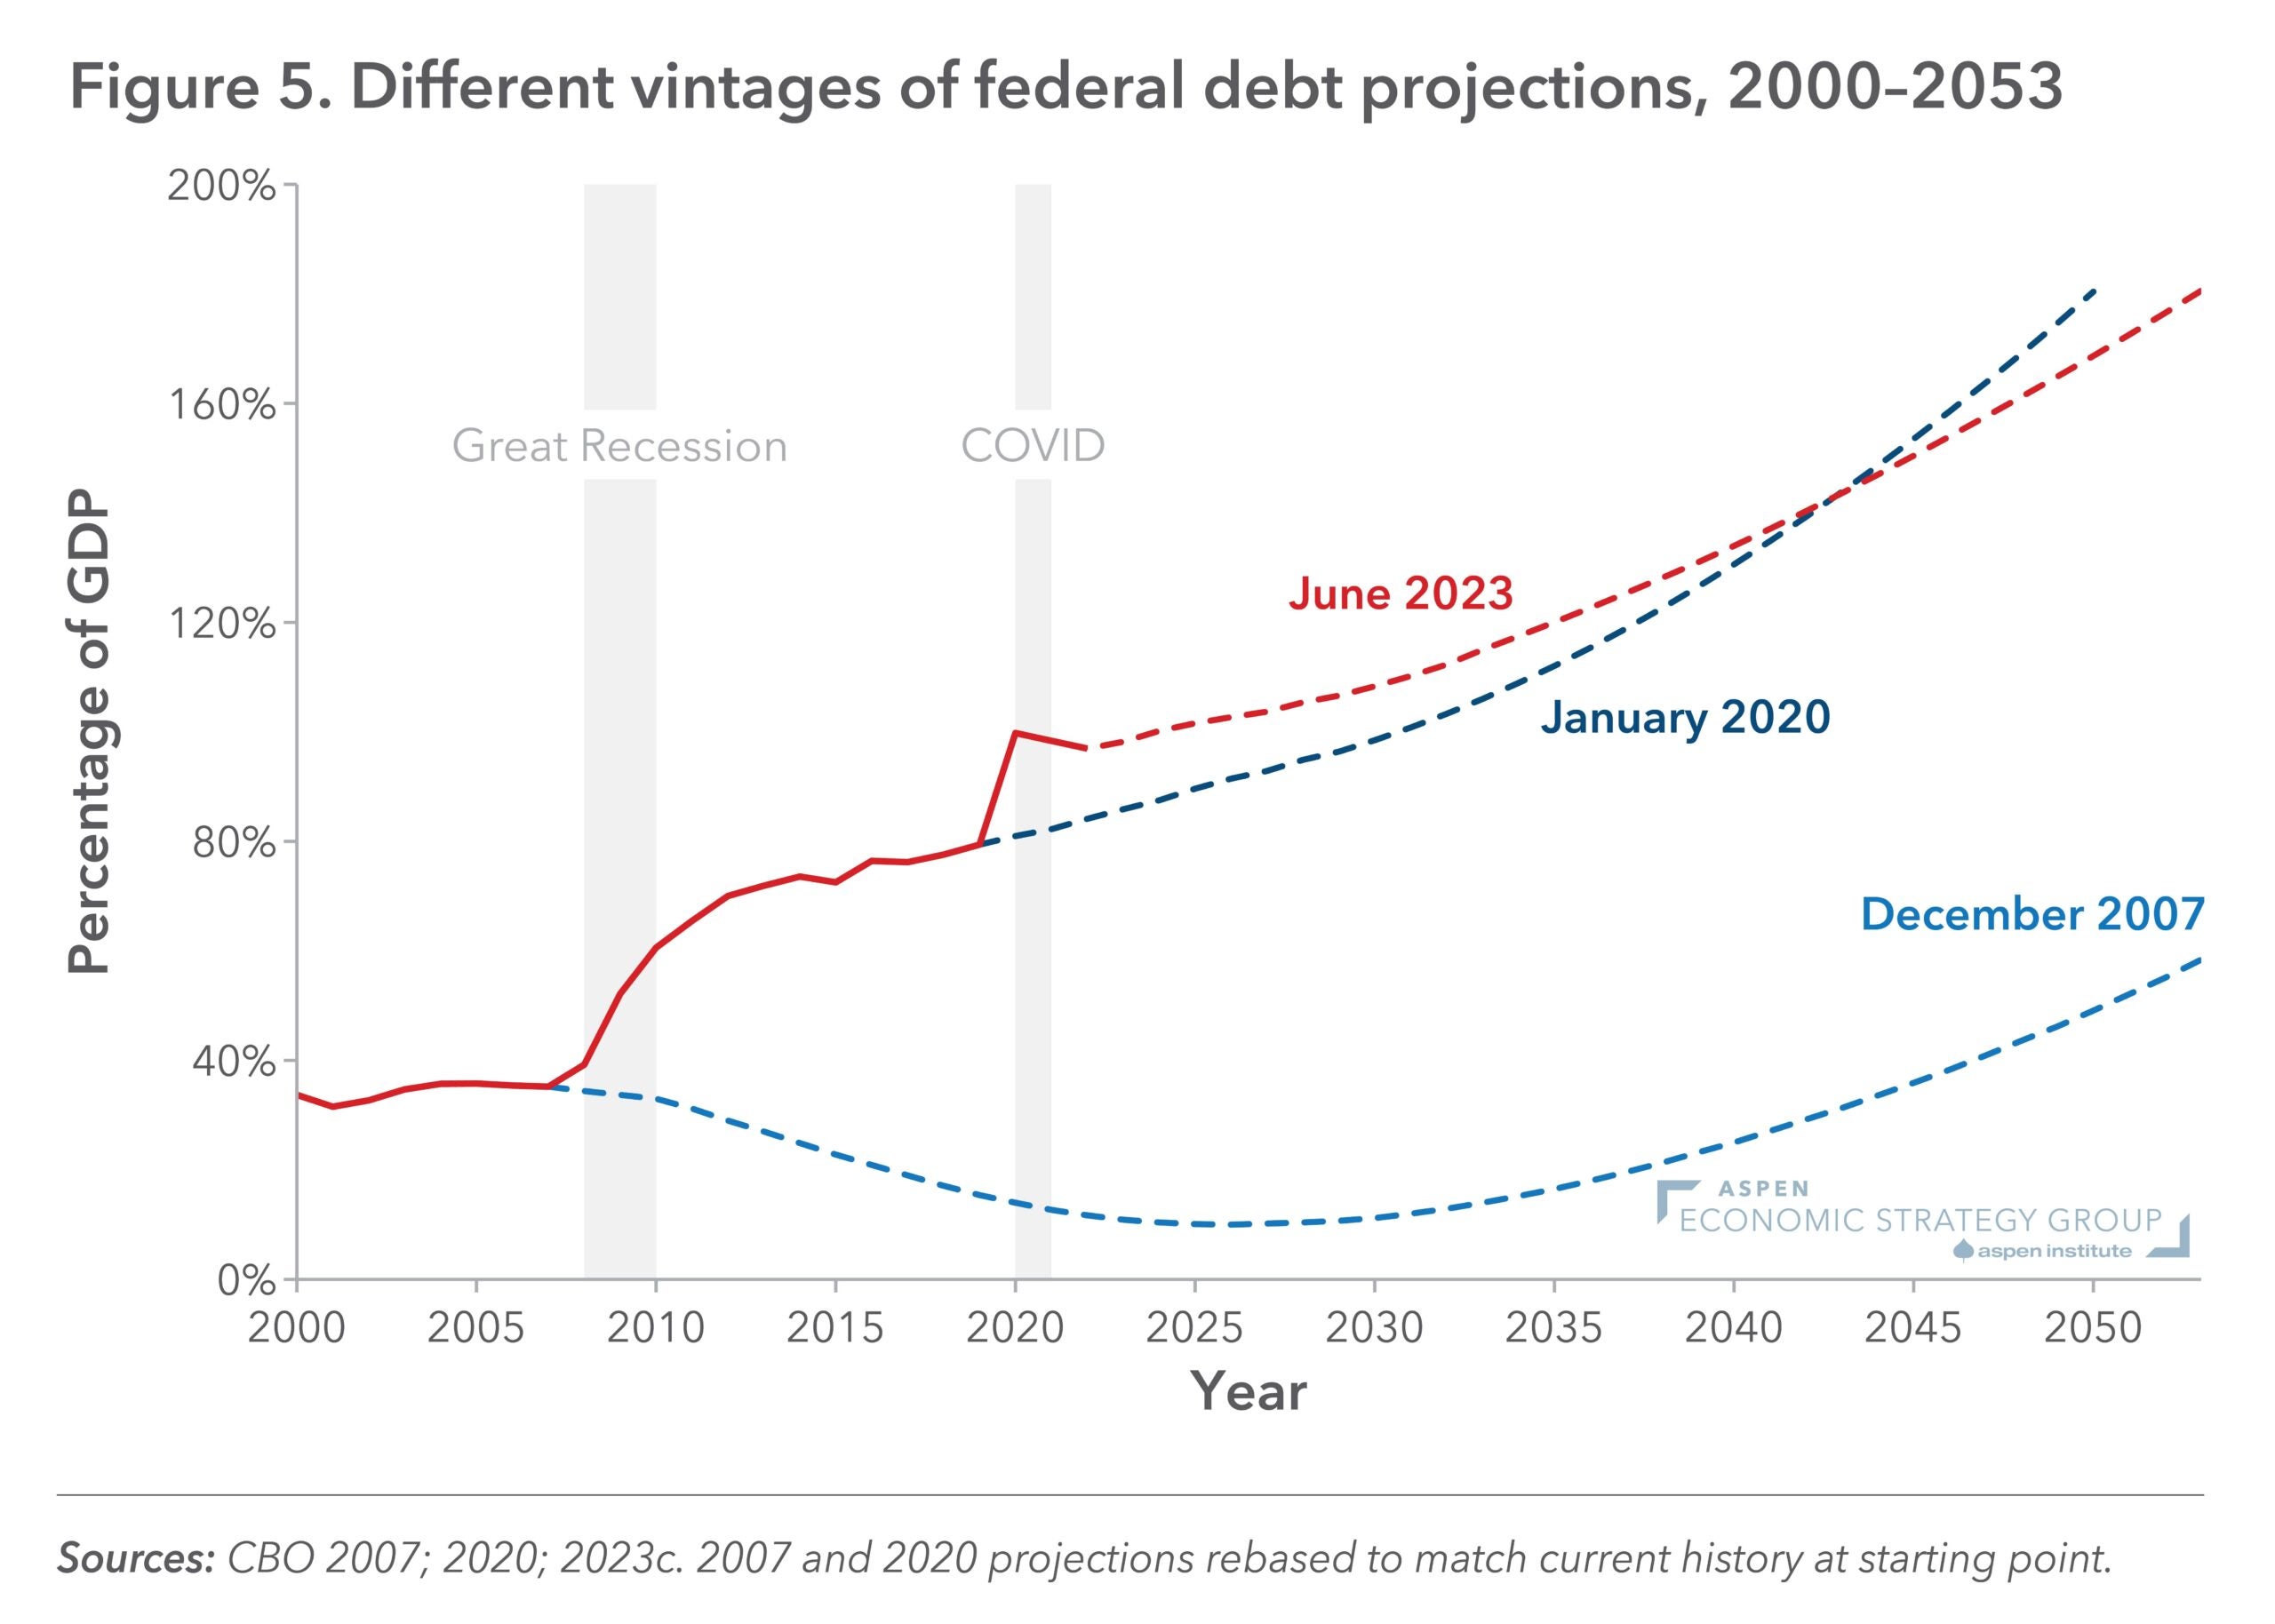
Figure 2: United States vs. China by GDP, 1990-2006
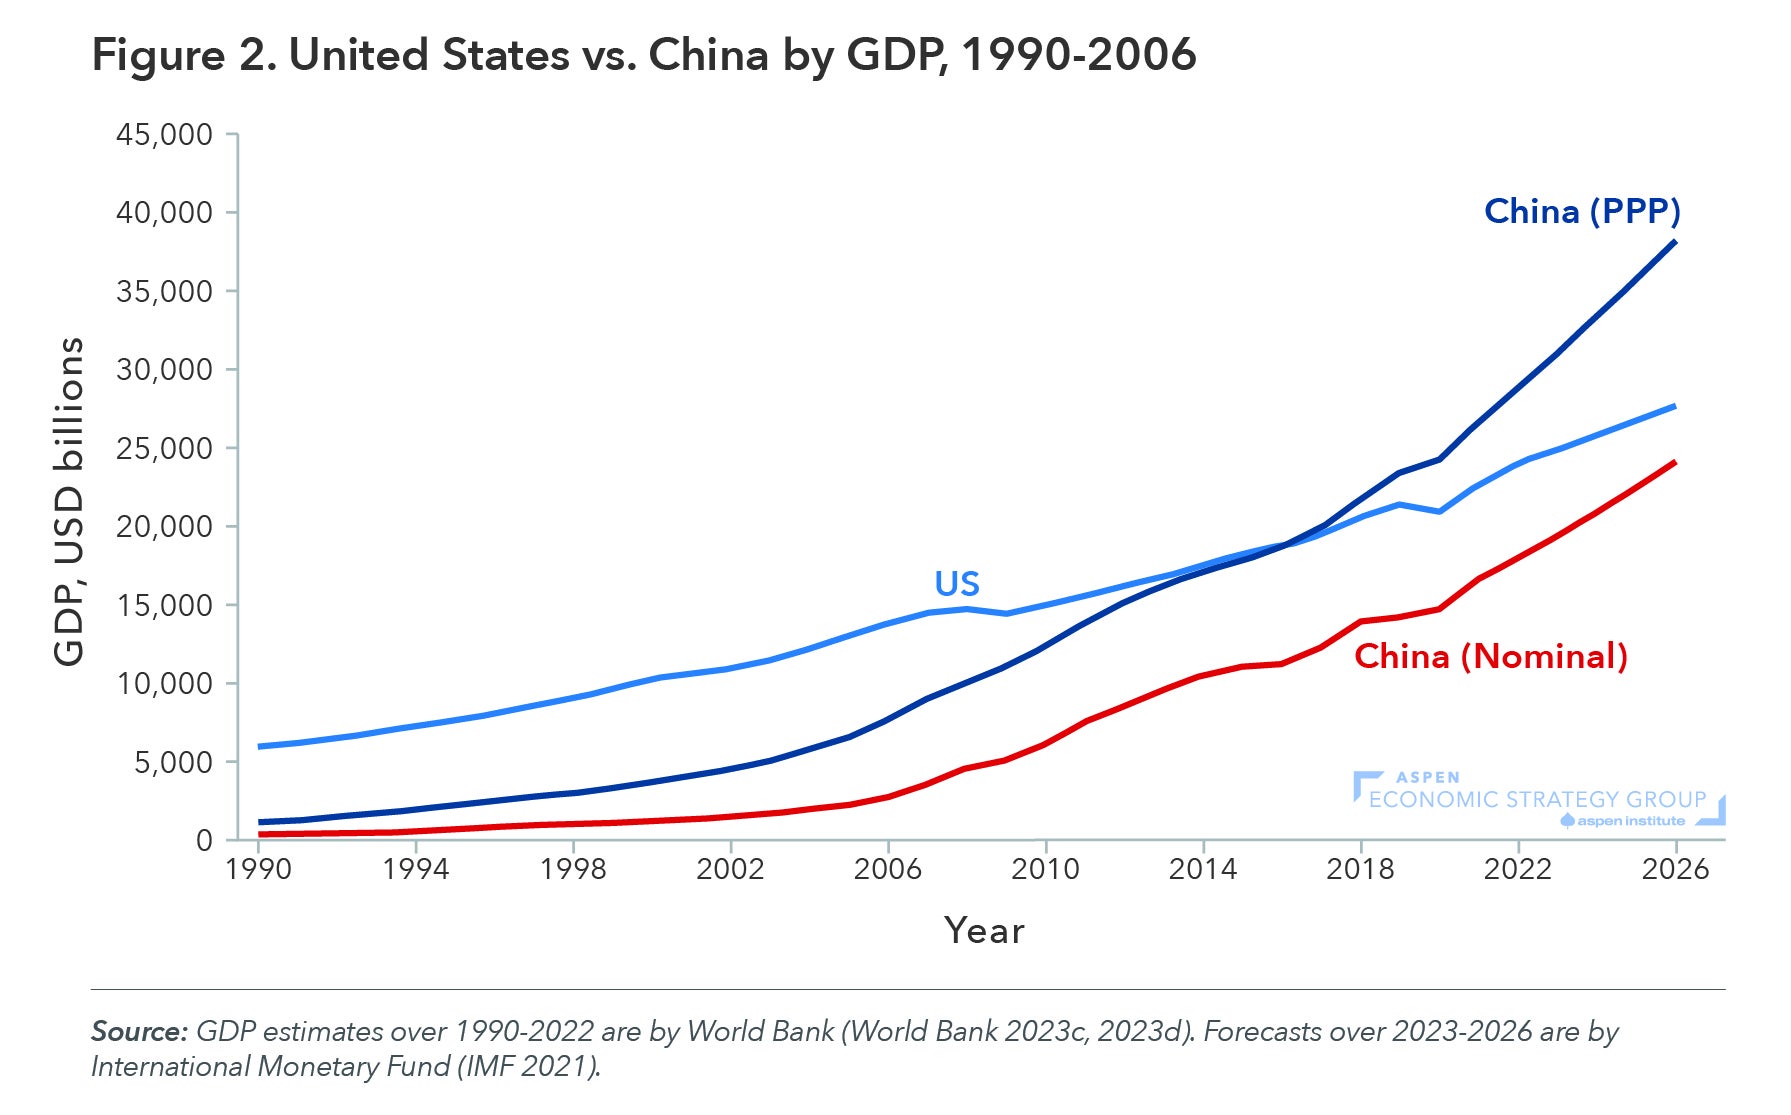
Figure 7: Annual Value of Foreign Direct Investment Transactions Between the US and China, 2000-2020
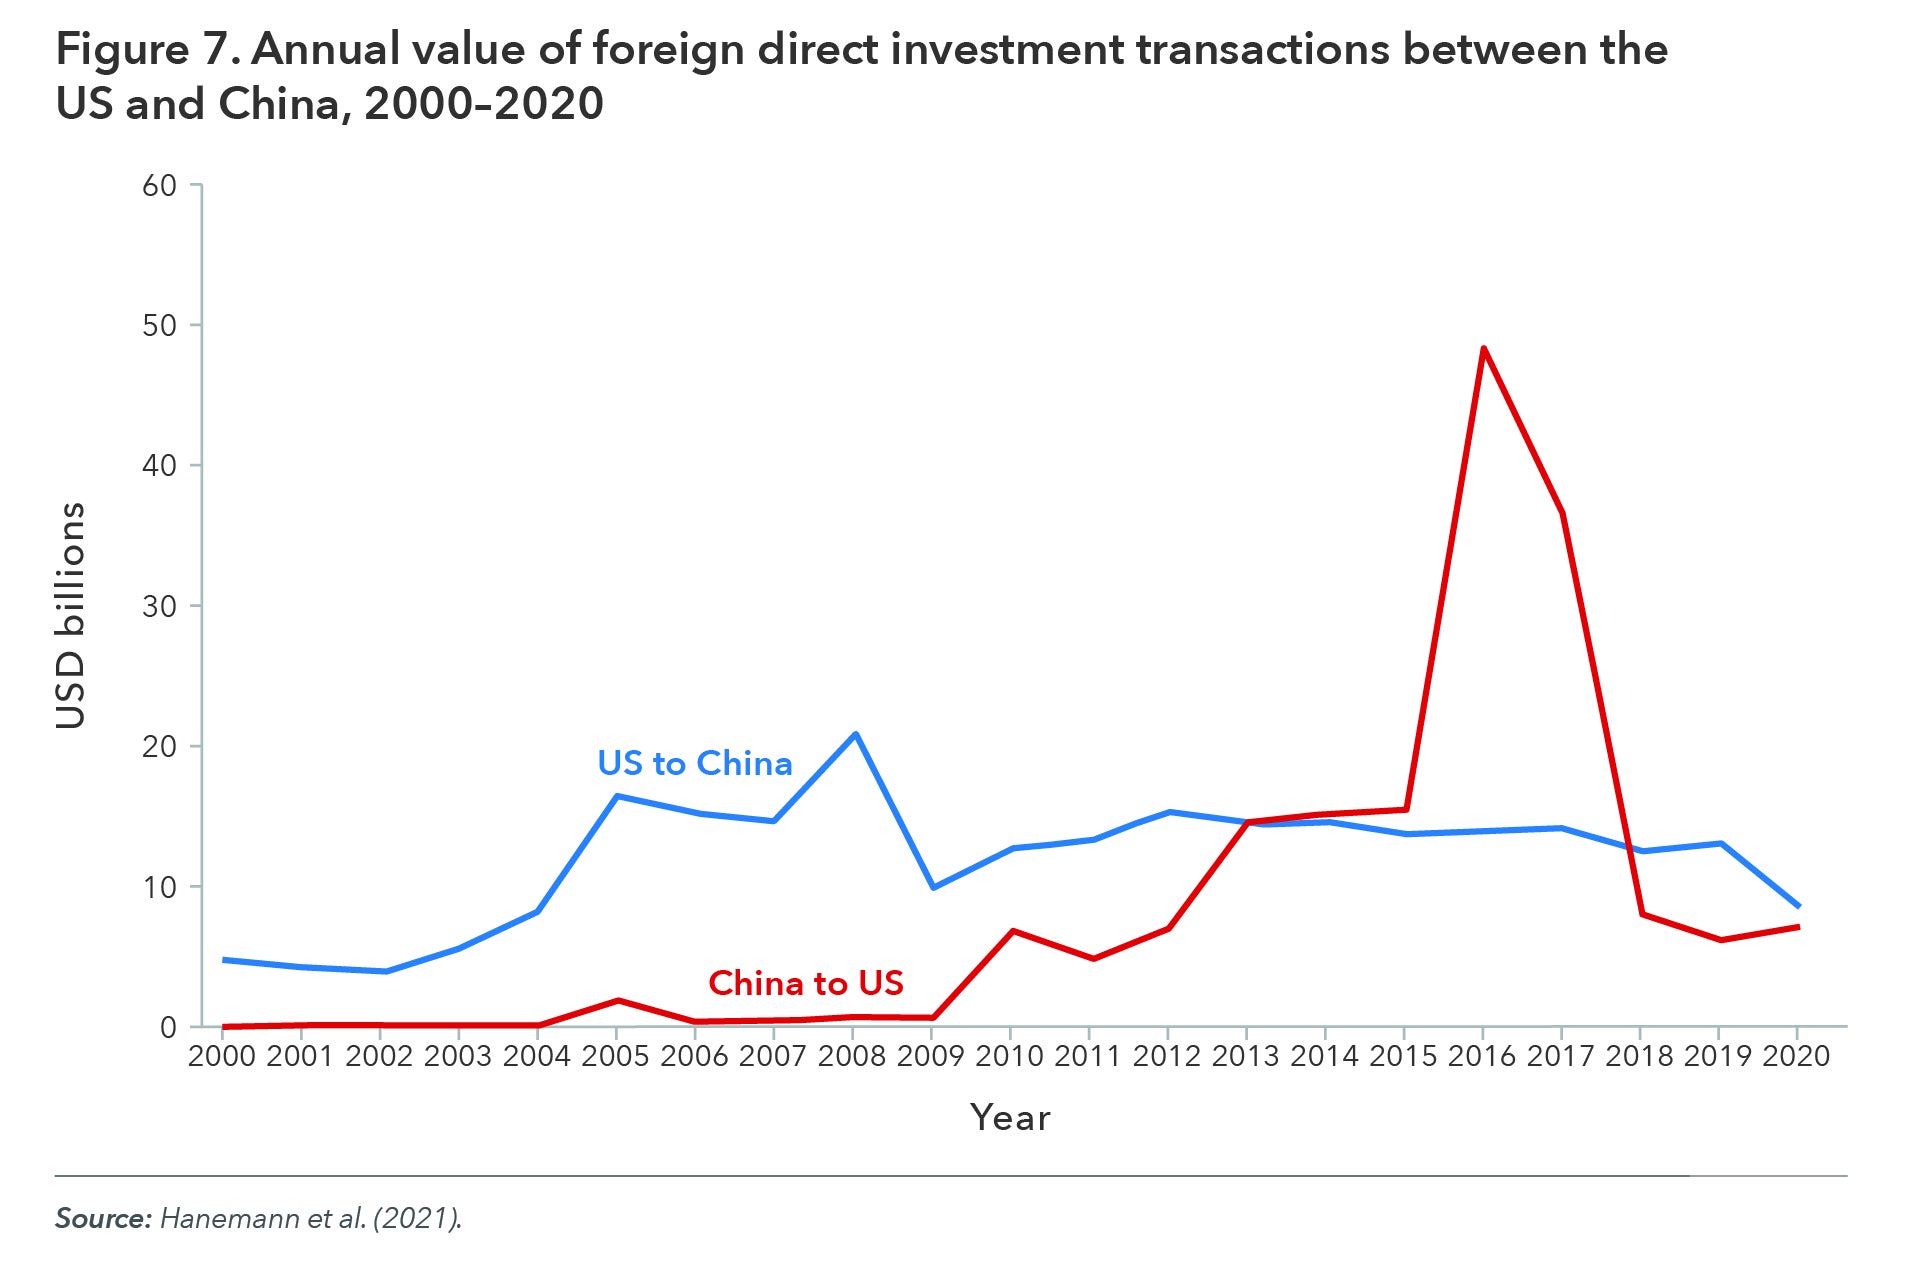
Figure 4: Social Security PIA versus AIME benefit formula in 2022
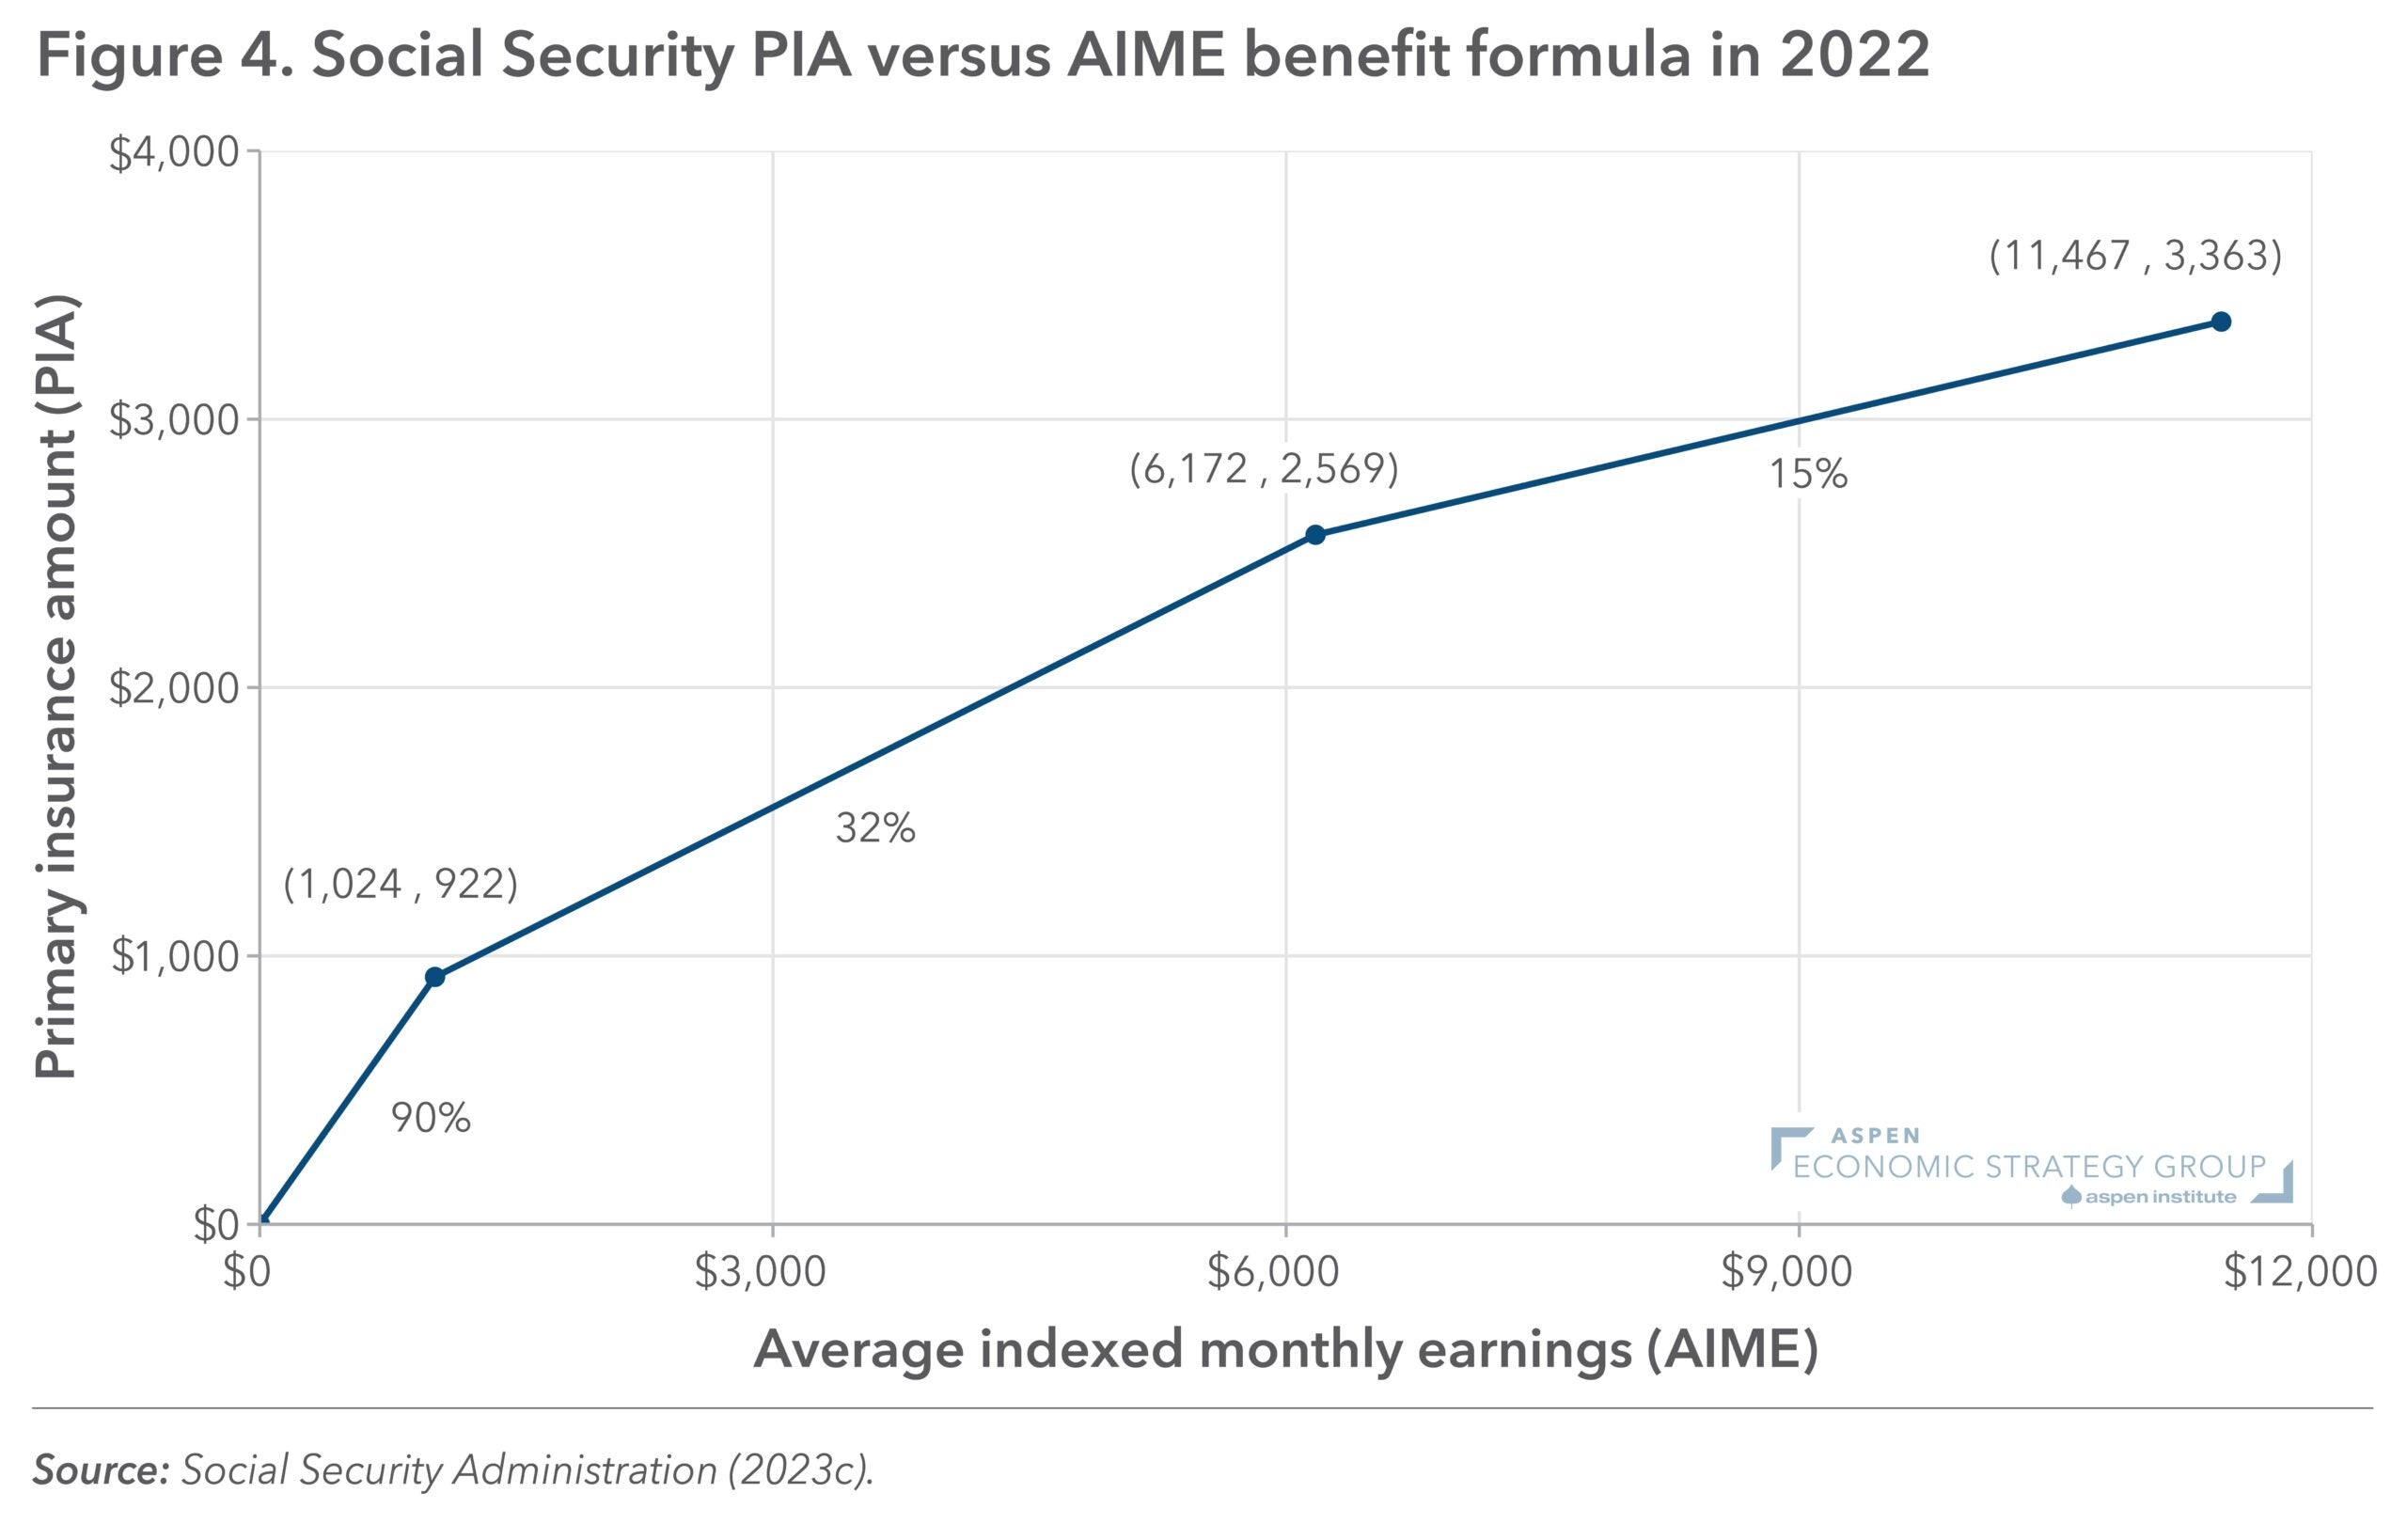
Figure 1: 2019-2022 NAEP Math Score Changes vs. Free or Reduced-Price Lunch Rates
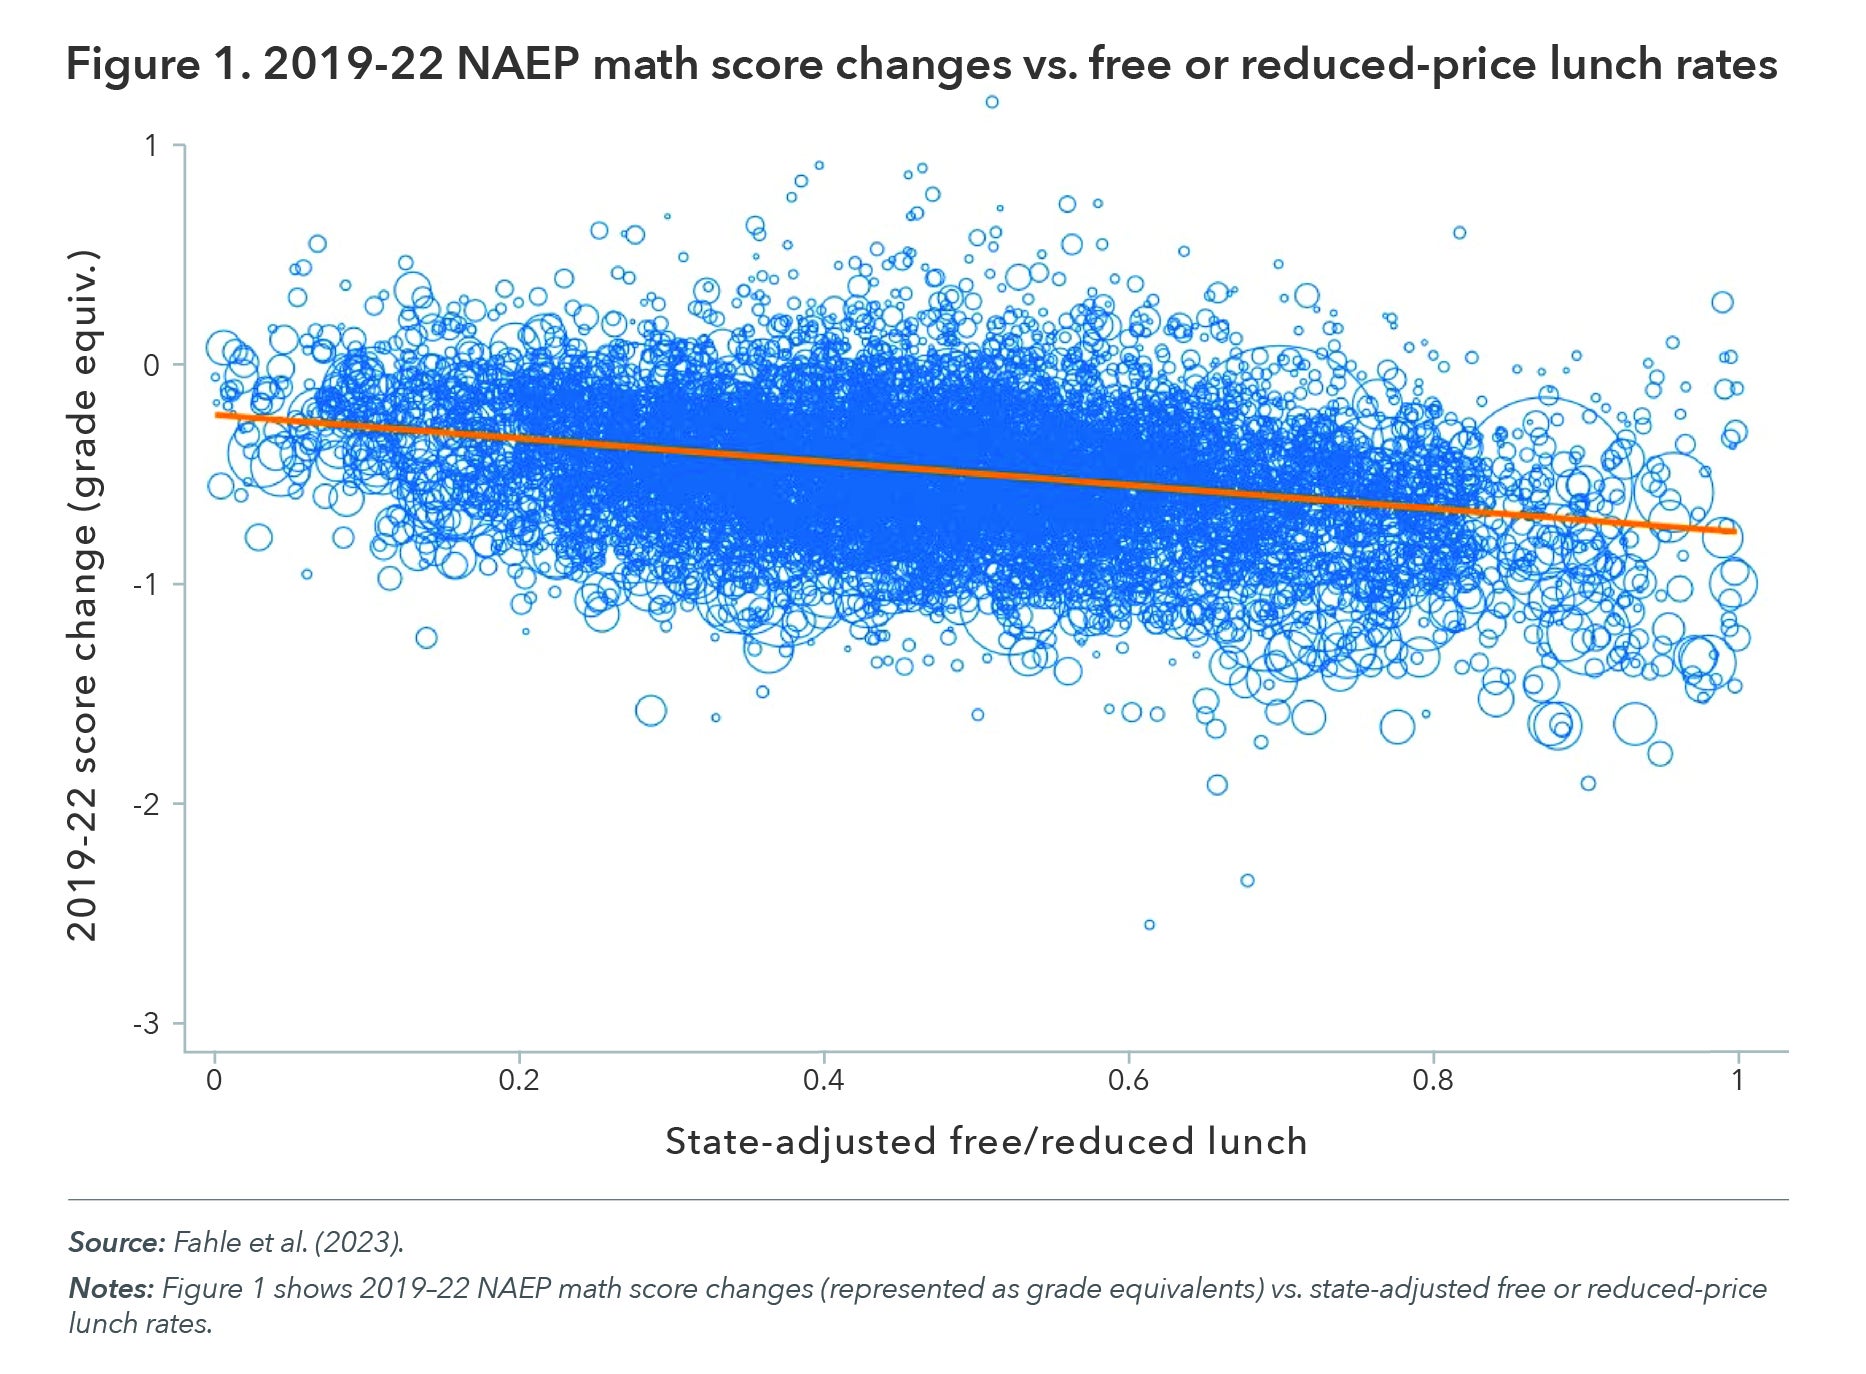
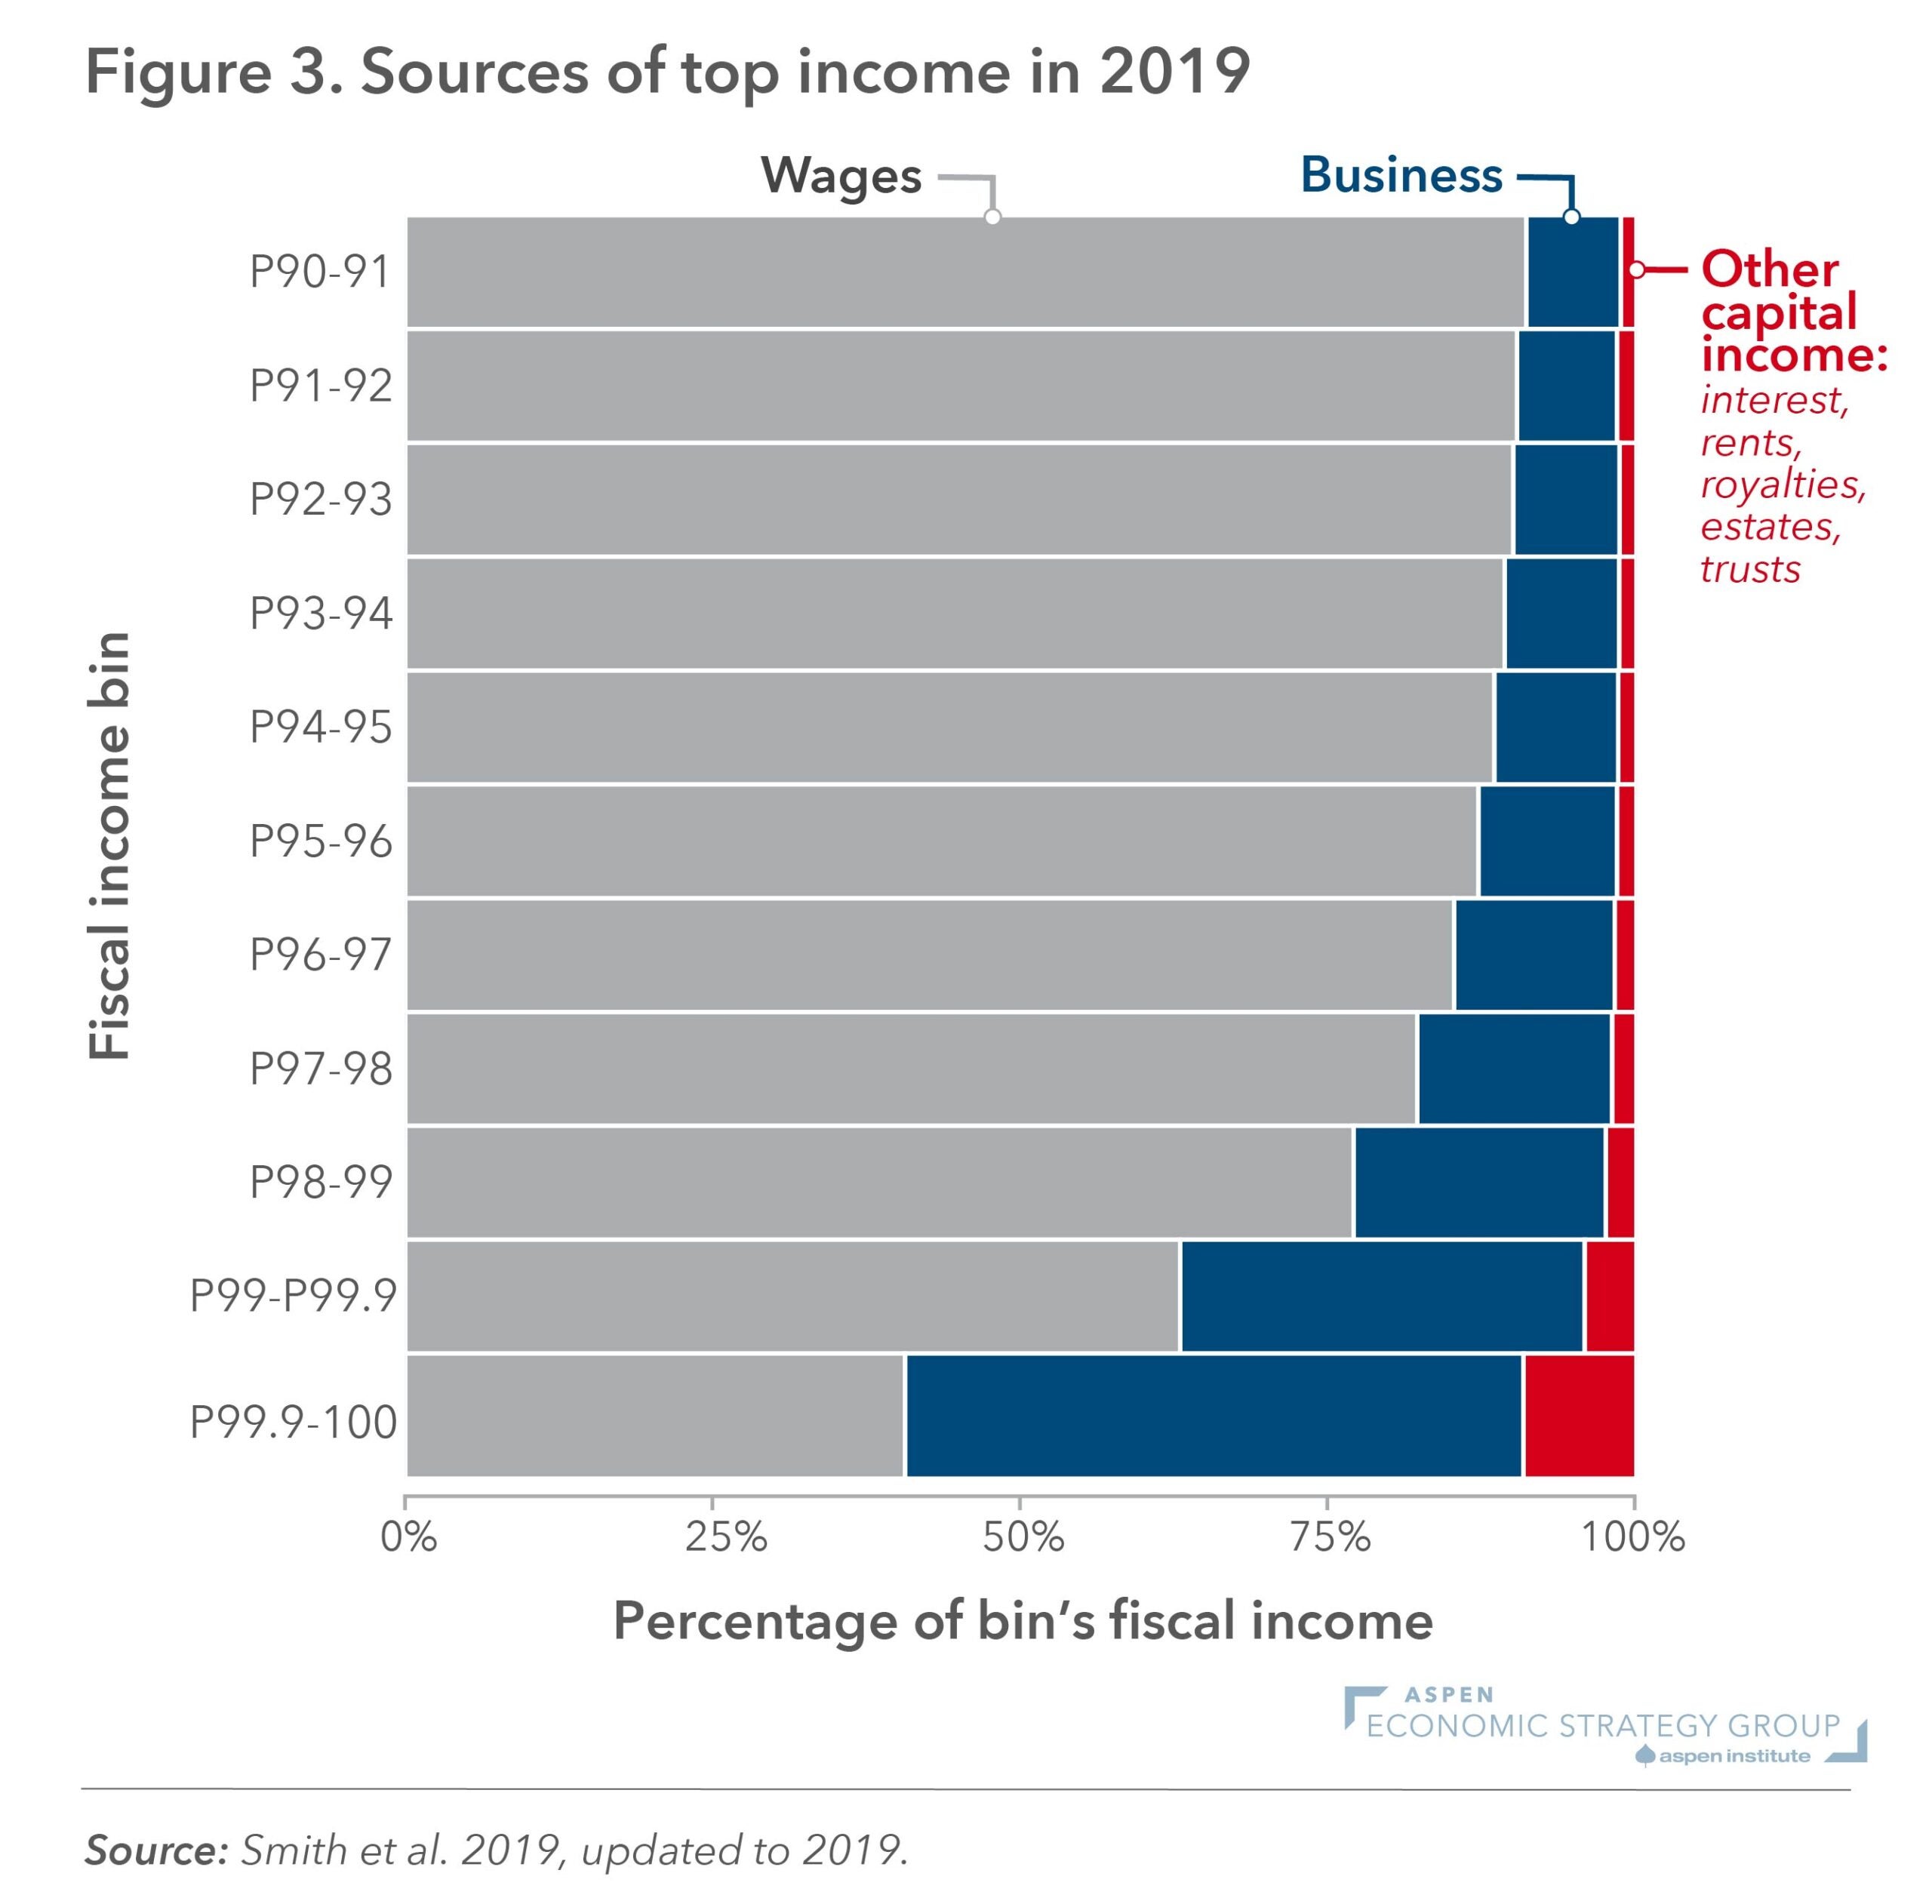
Figure 3: Top Income Sources in 2019