Archives: Publications
These are AIESG Publications
Figure 5: Indexed tax base shortfalls and surpluses based on simple linear forecasts

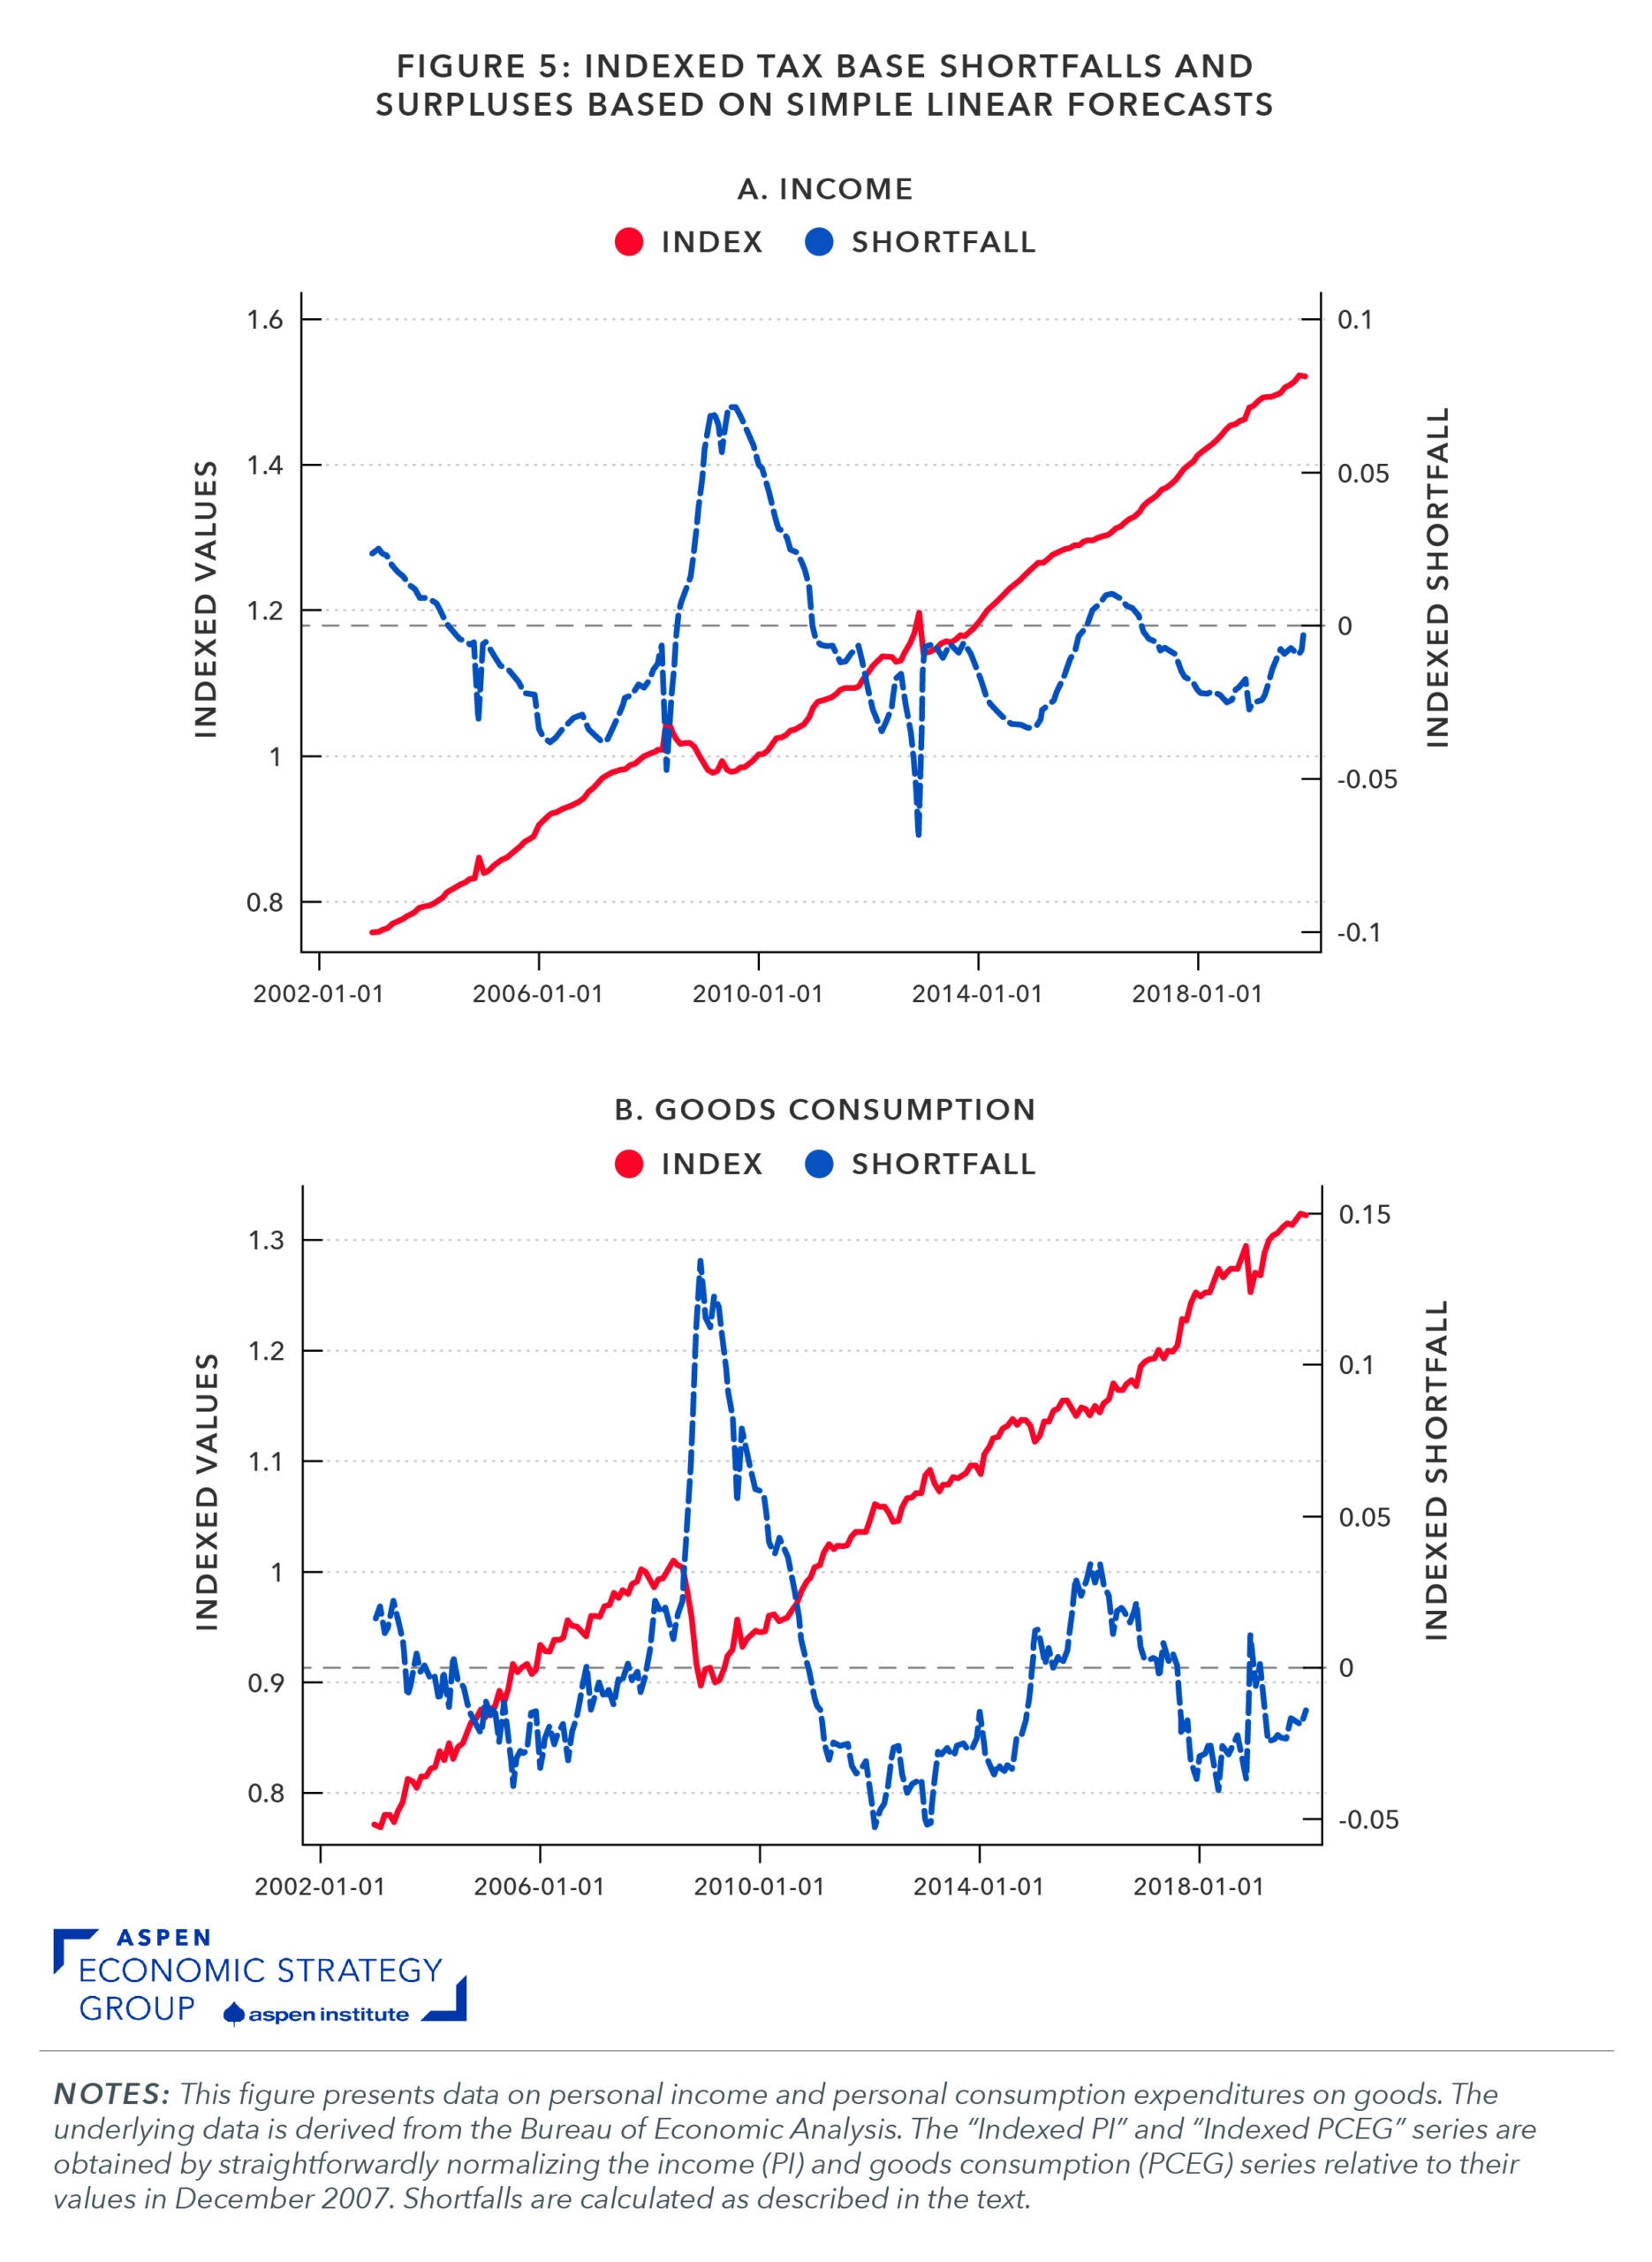
Figure 4: Estimated shortfall from 2020 (Q2) – 2022 (Q2)
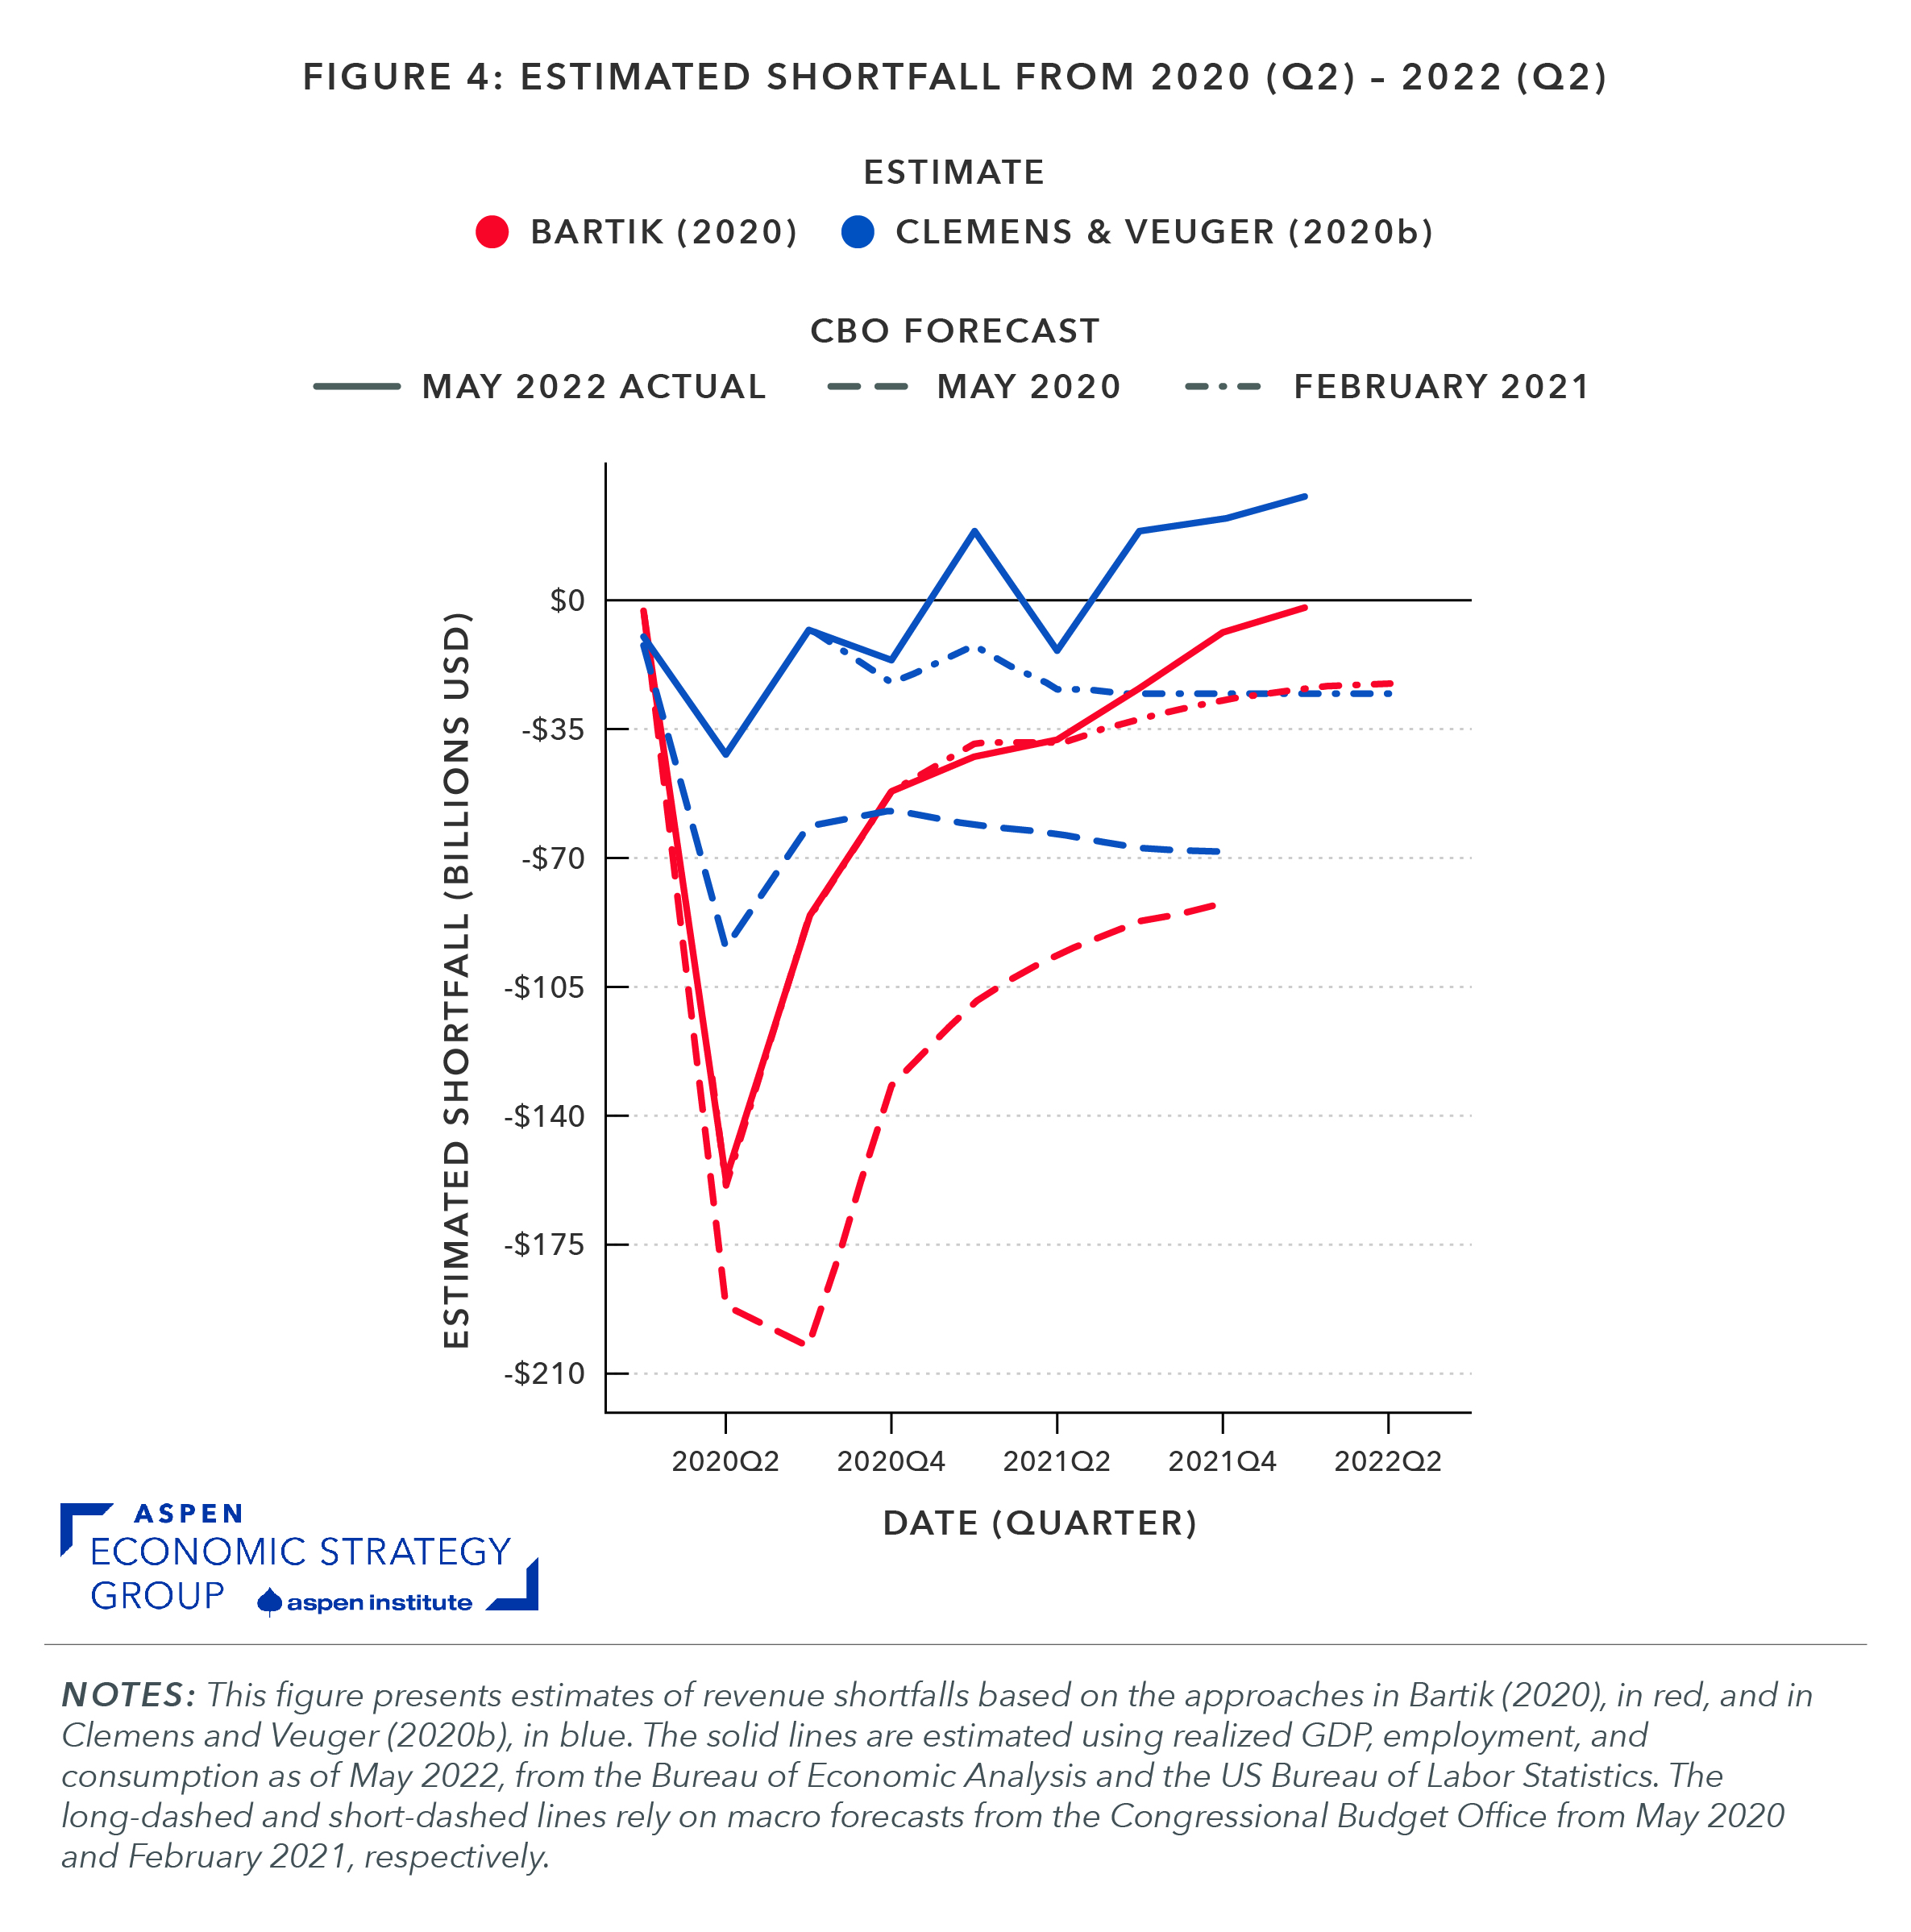
Figure 3: Average funds per capita versus Congressional Representation and Congressional Democratic party share

Figure 2: Income and Expenditures over the Great Recession
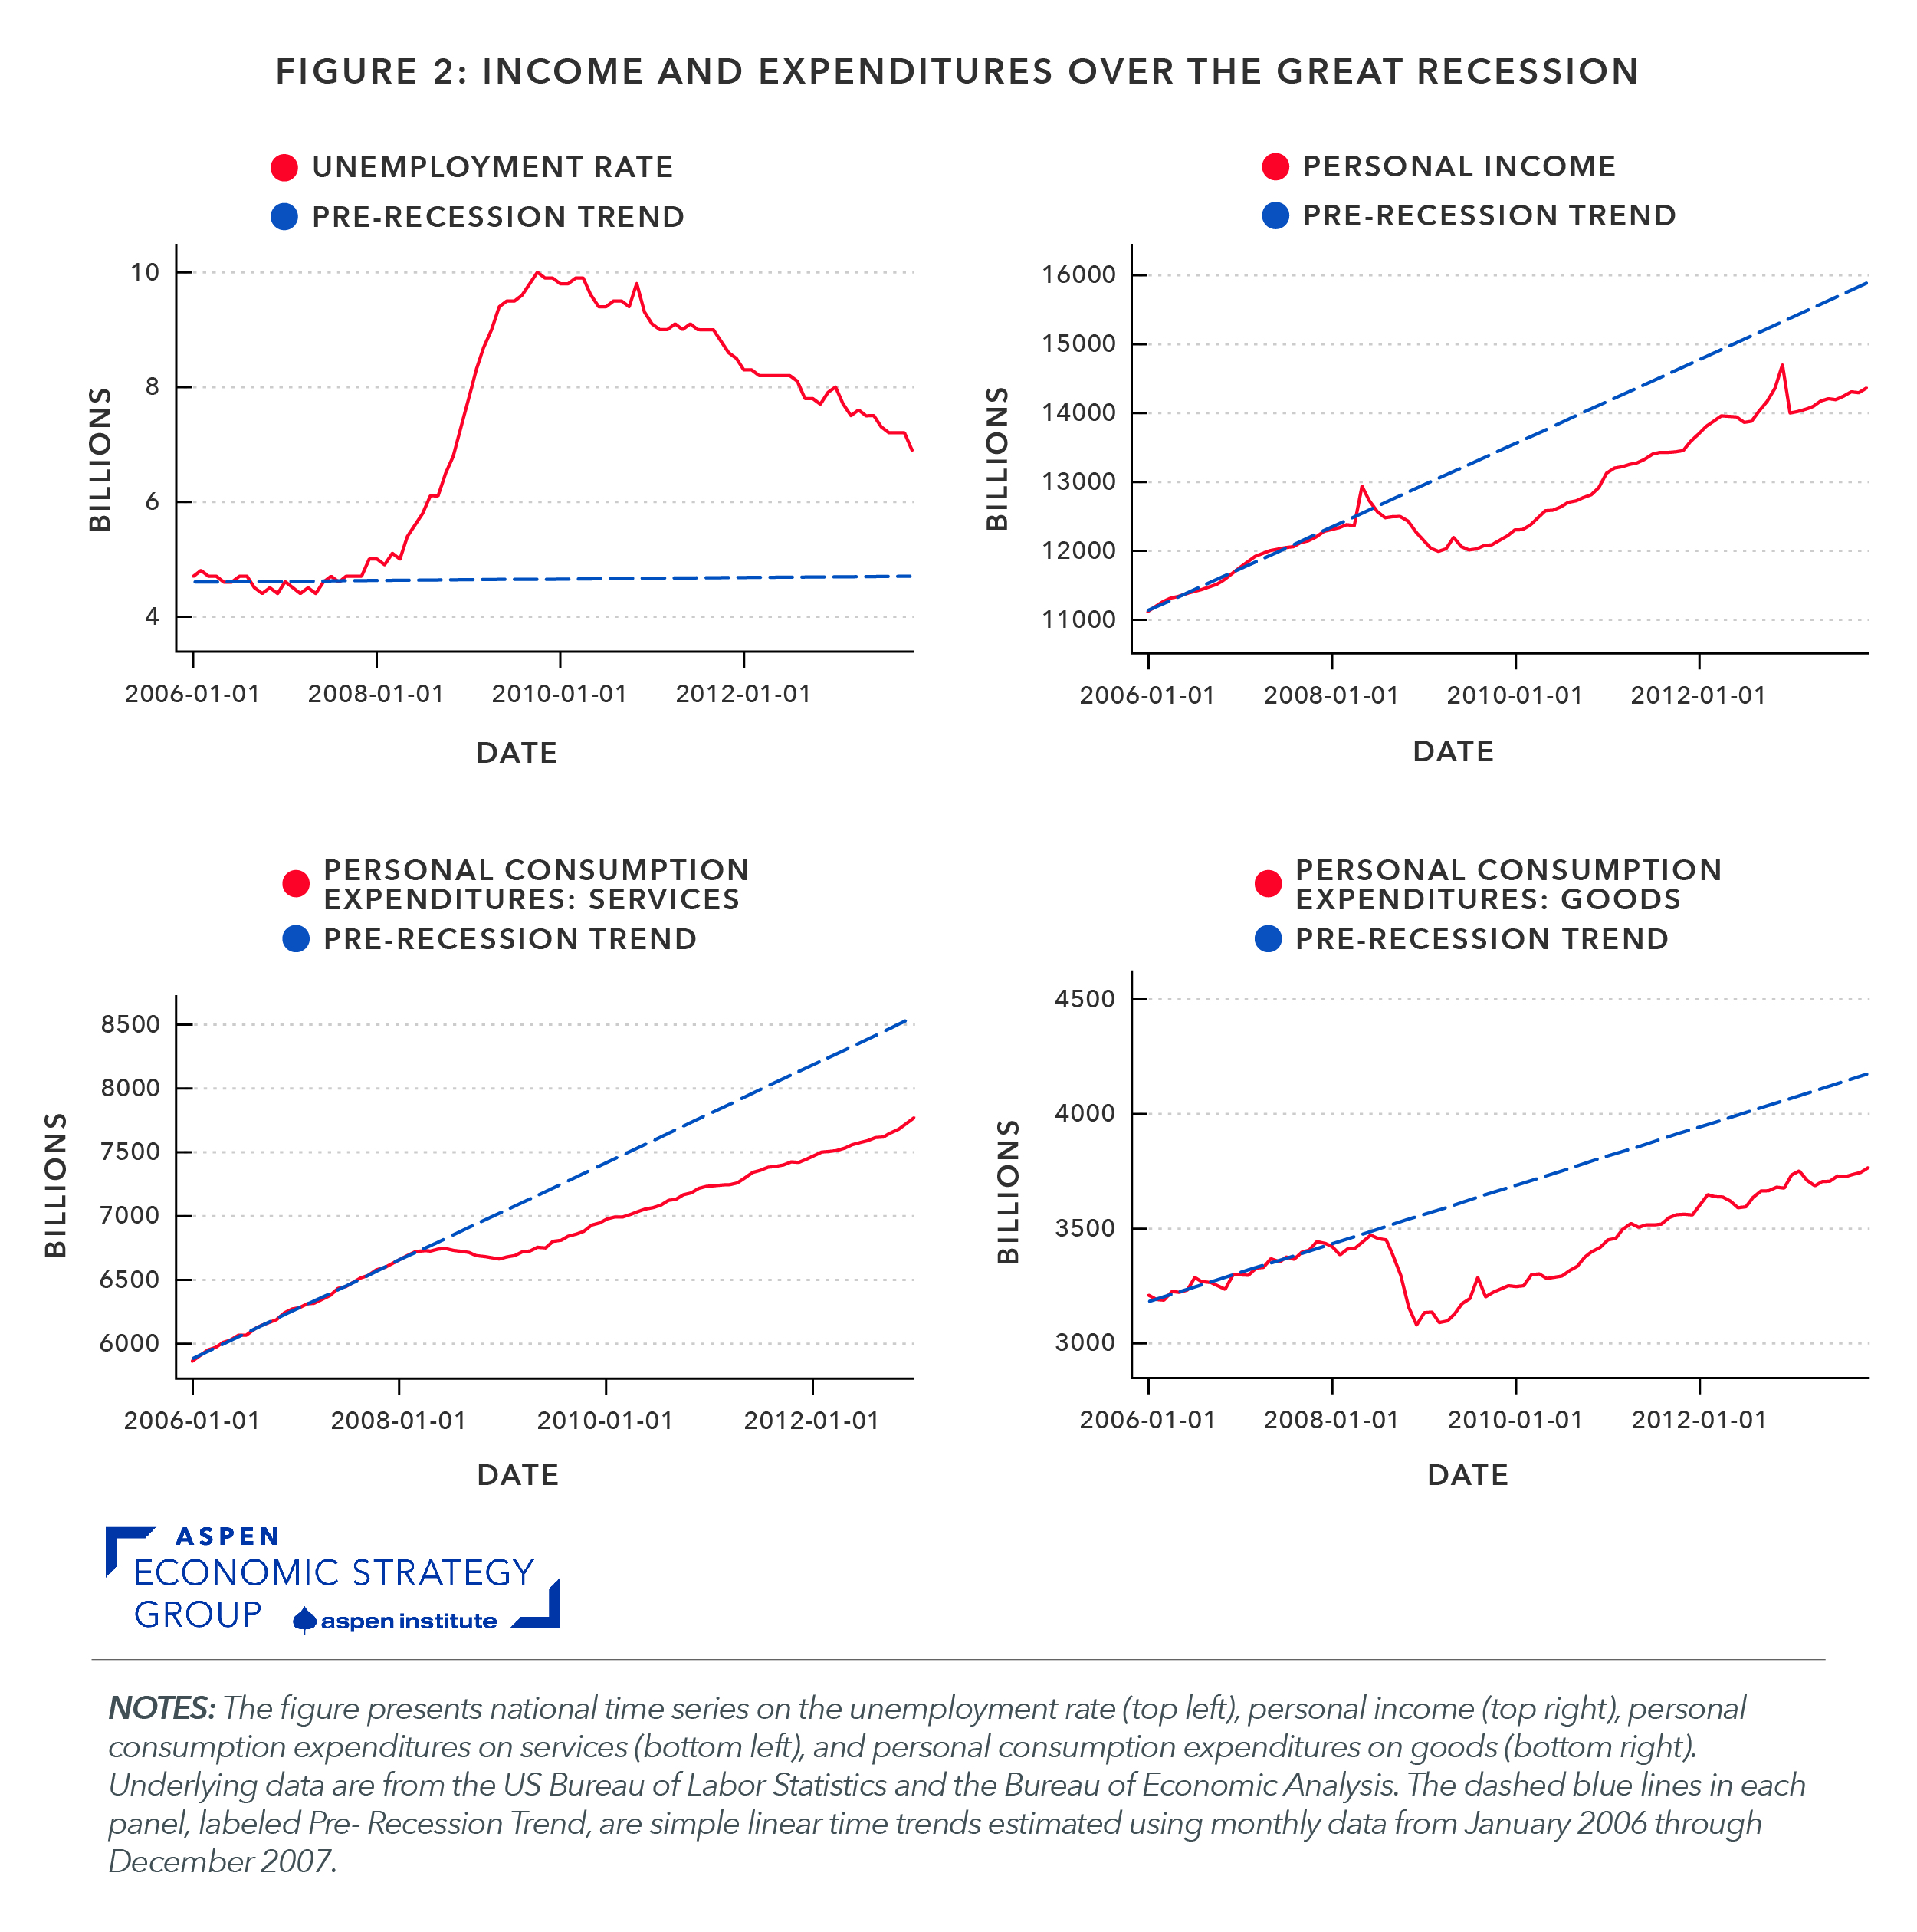
Figure 1: Income and Expenditures over the Pandemic
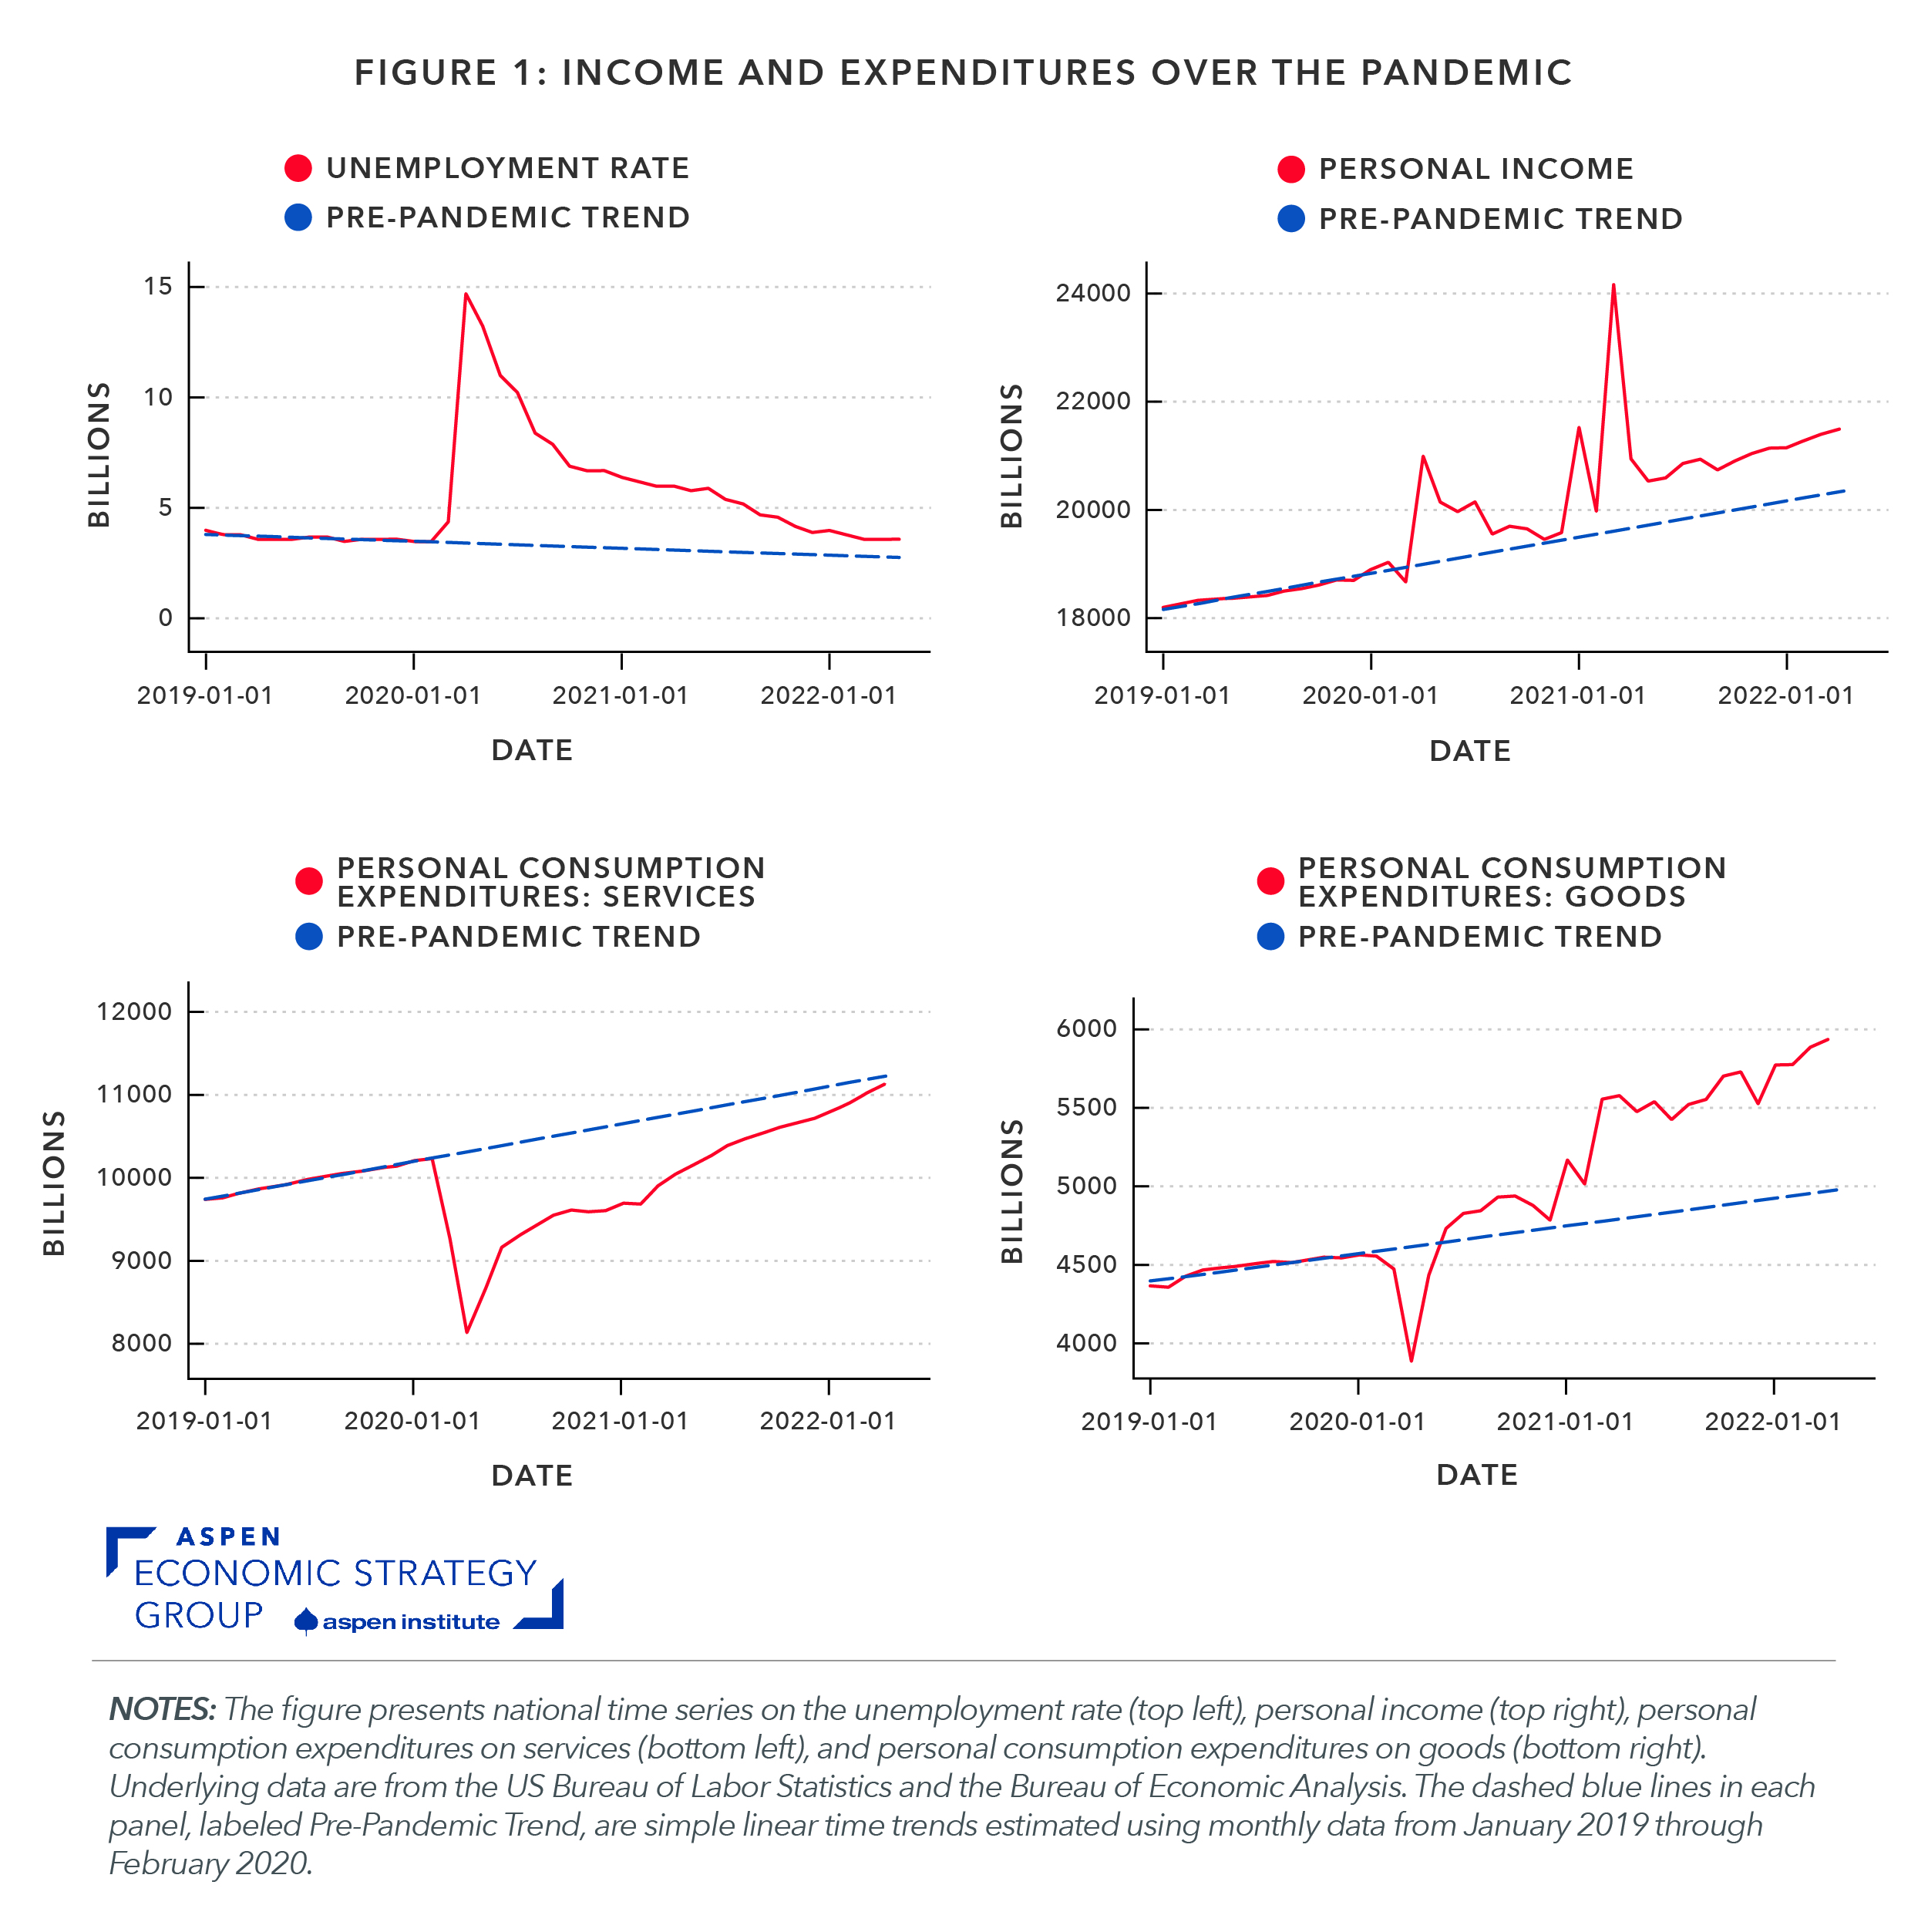
Figure 5: Federal R&D funding by agency: 2022 ($MILLIONS)

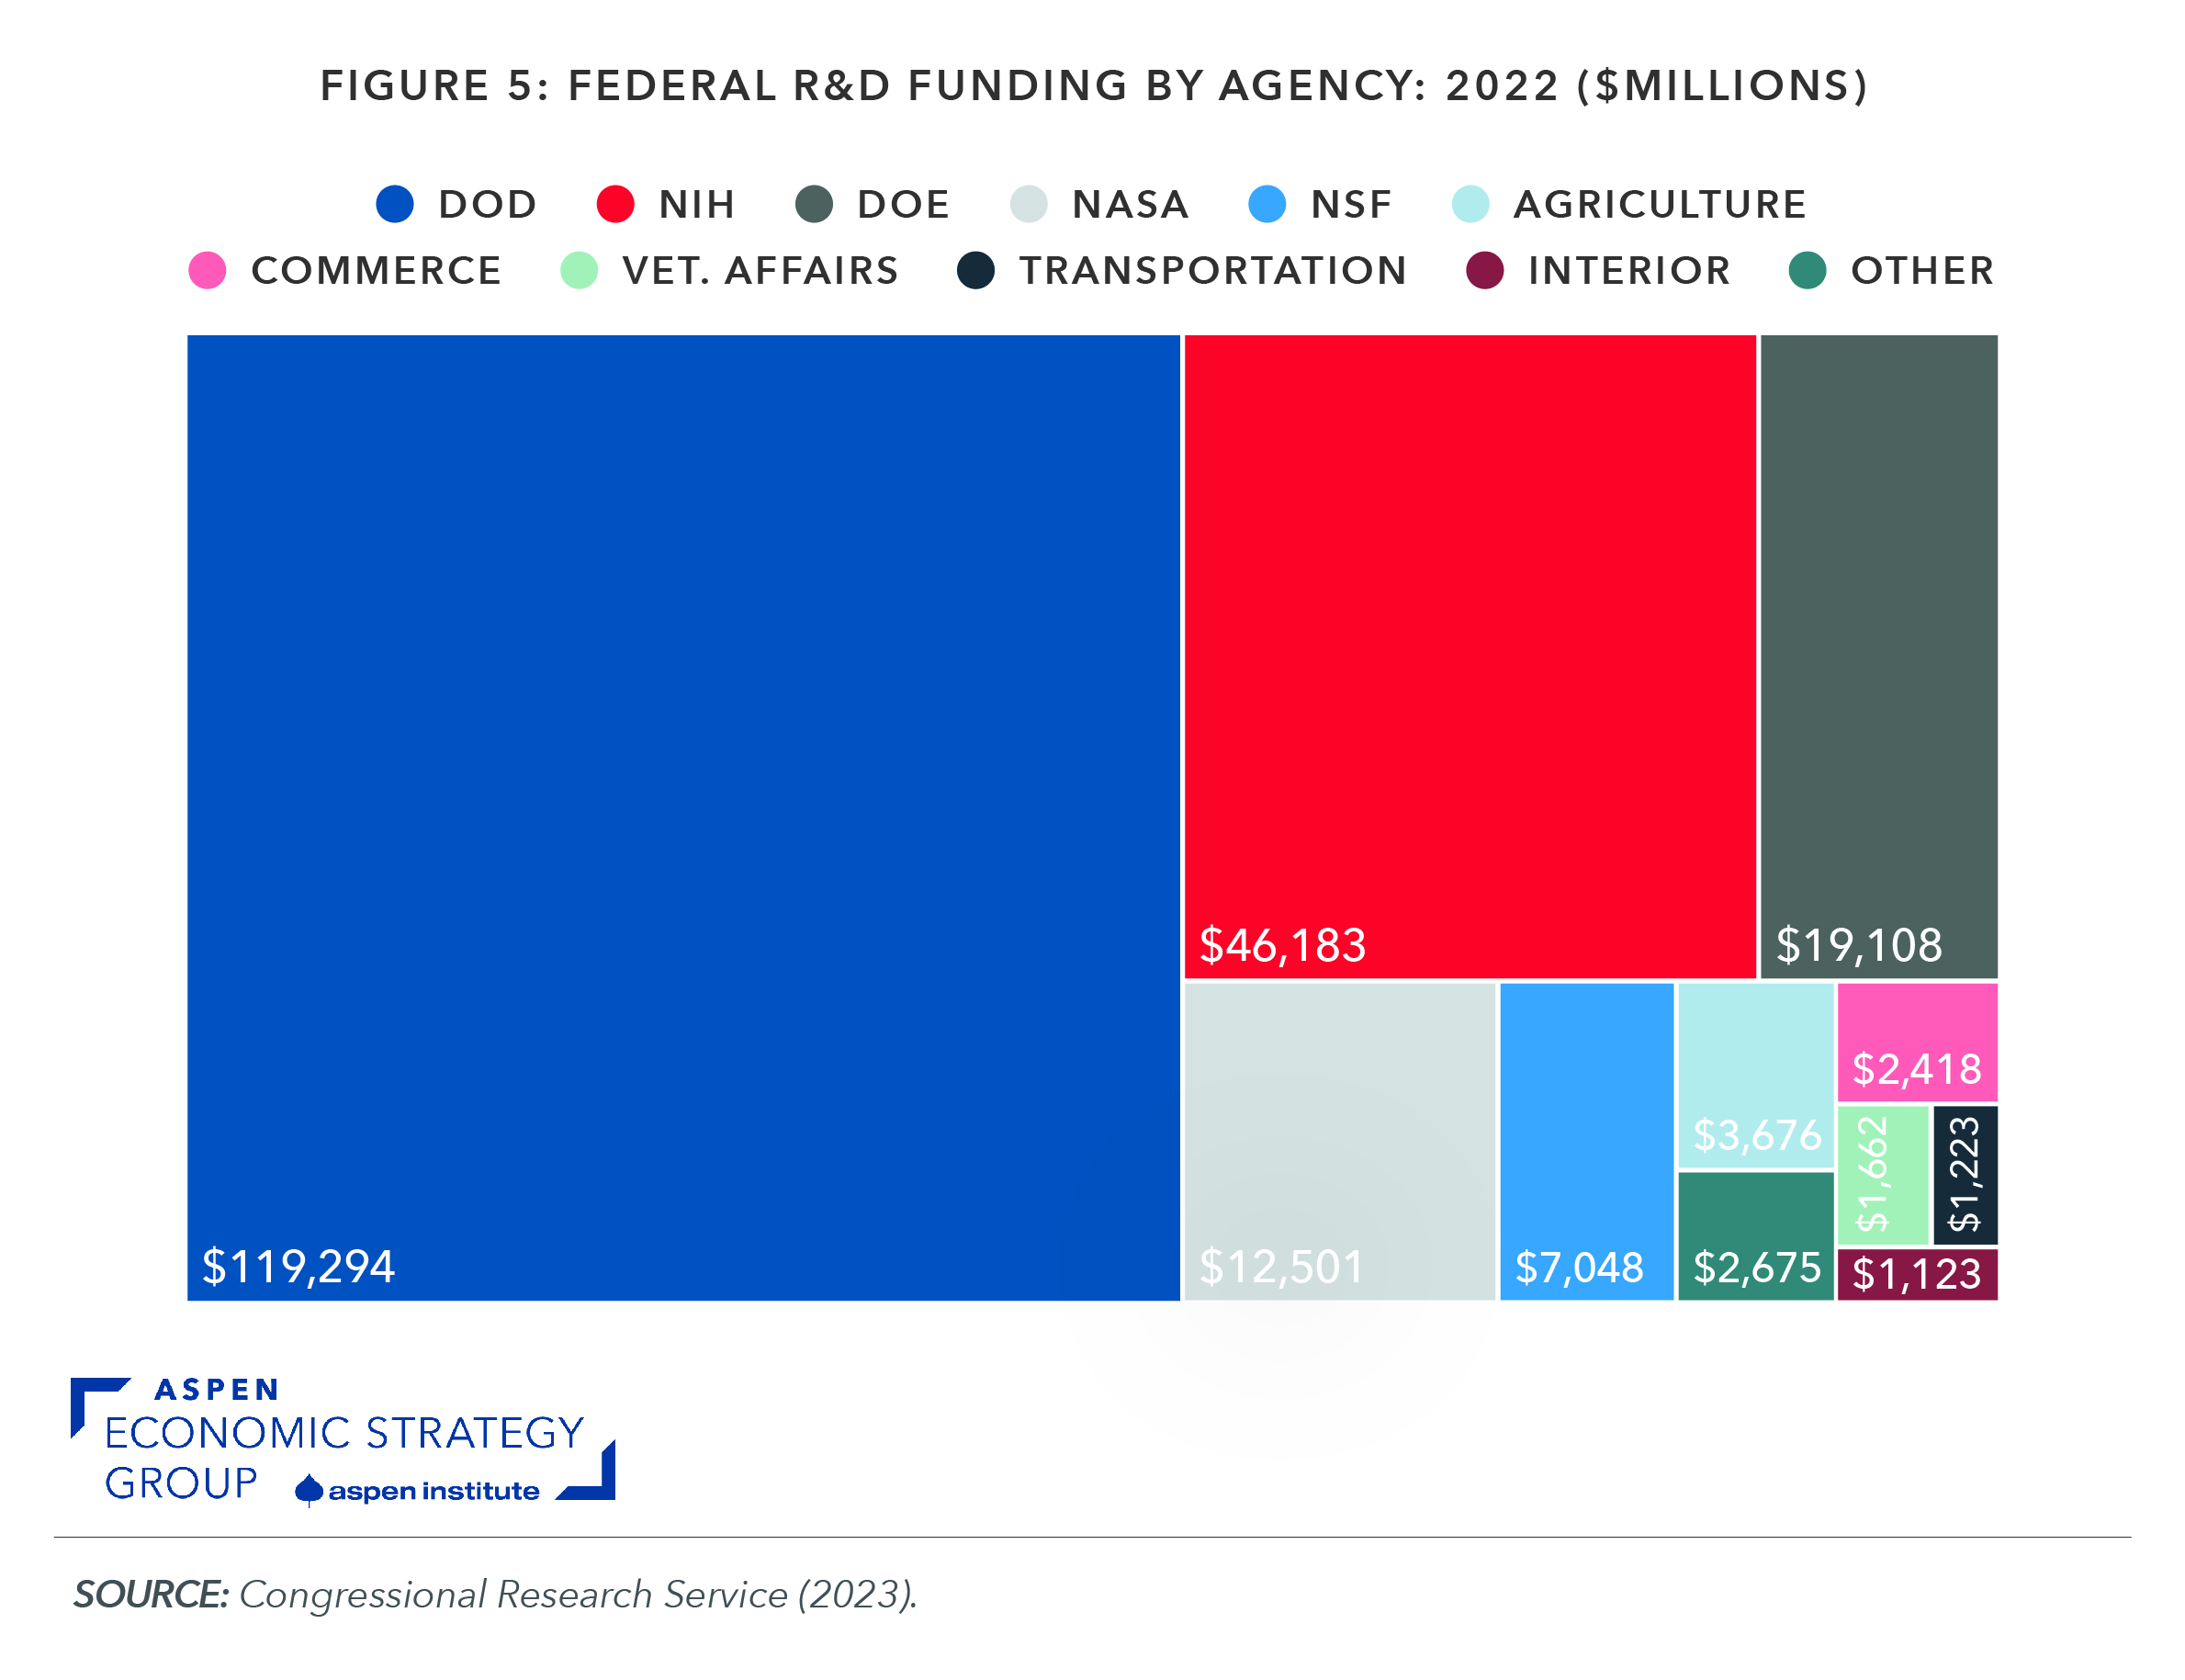
Figure 4: R&D performance, by type of funding and sector: 2019
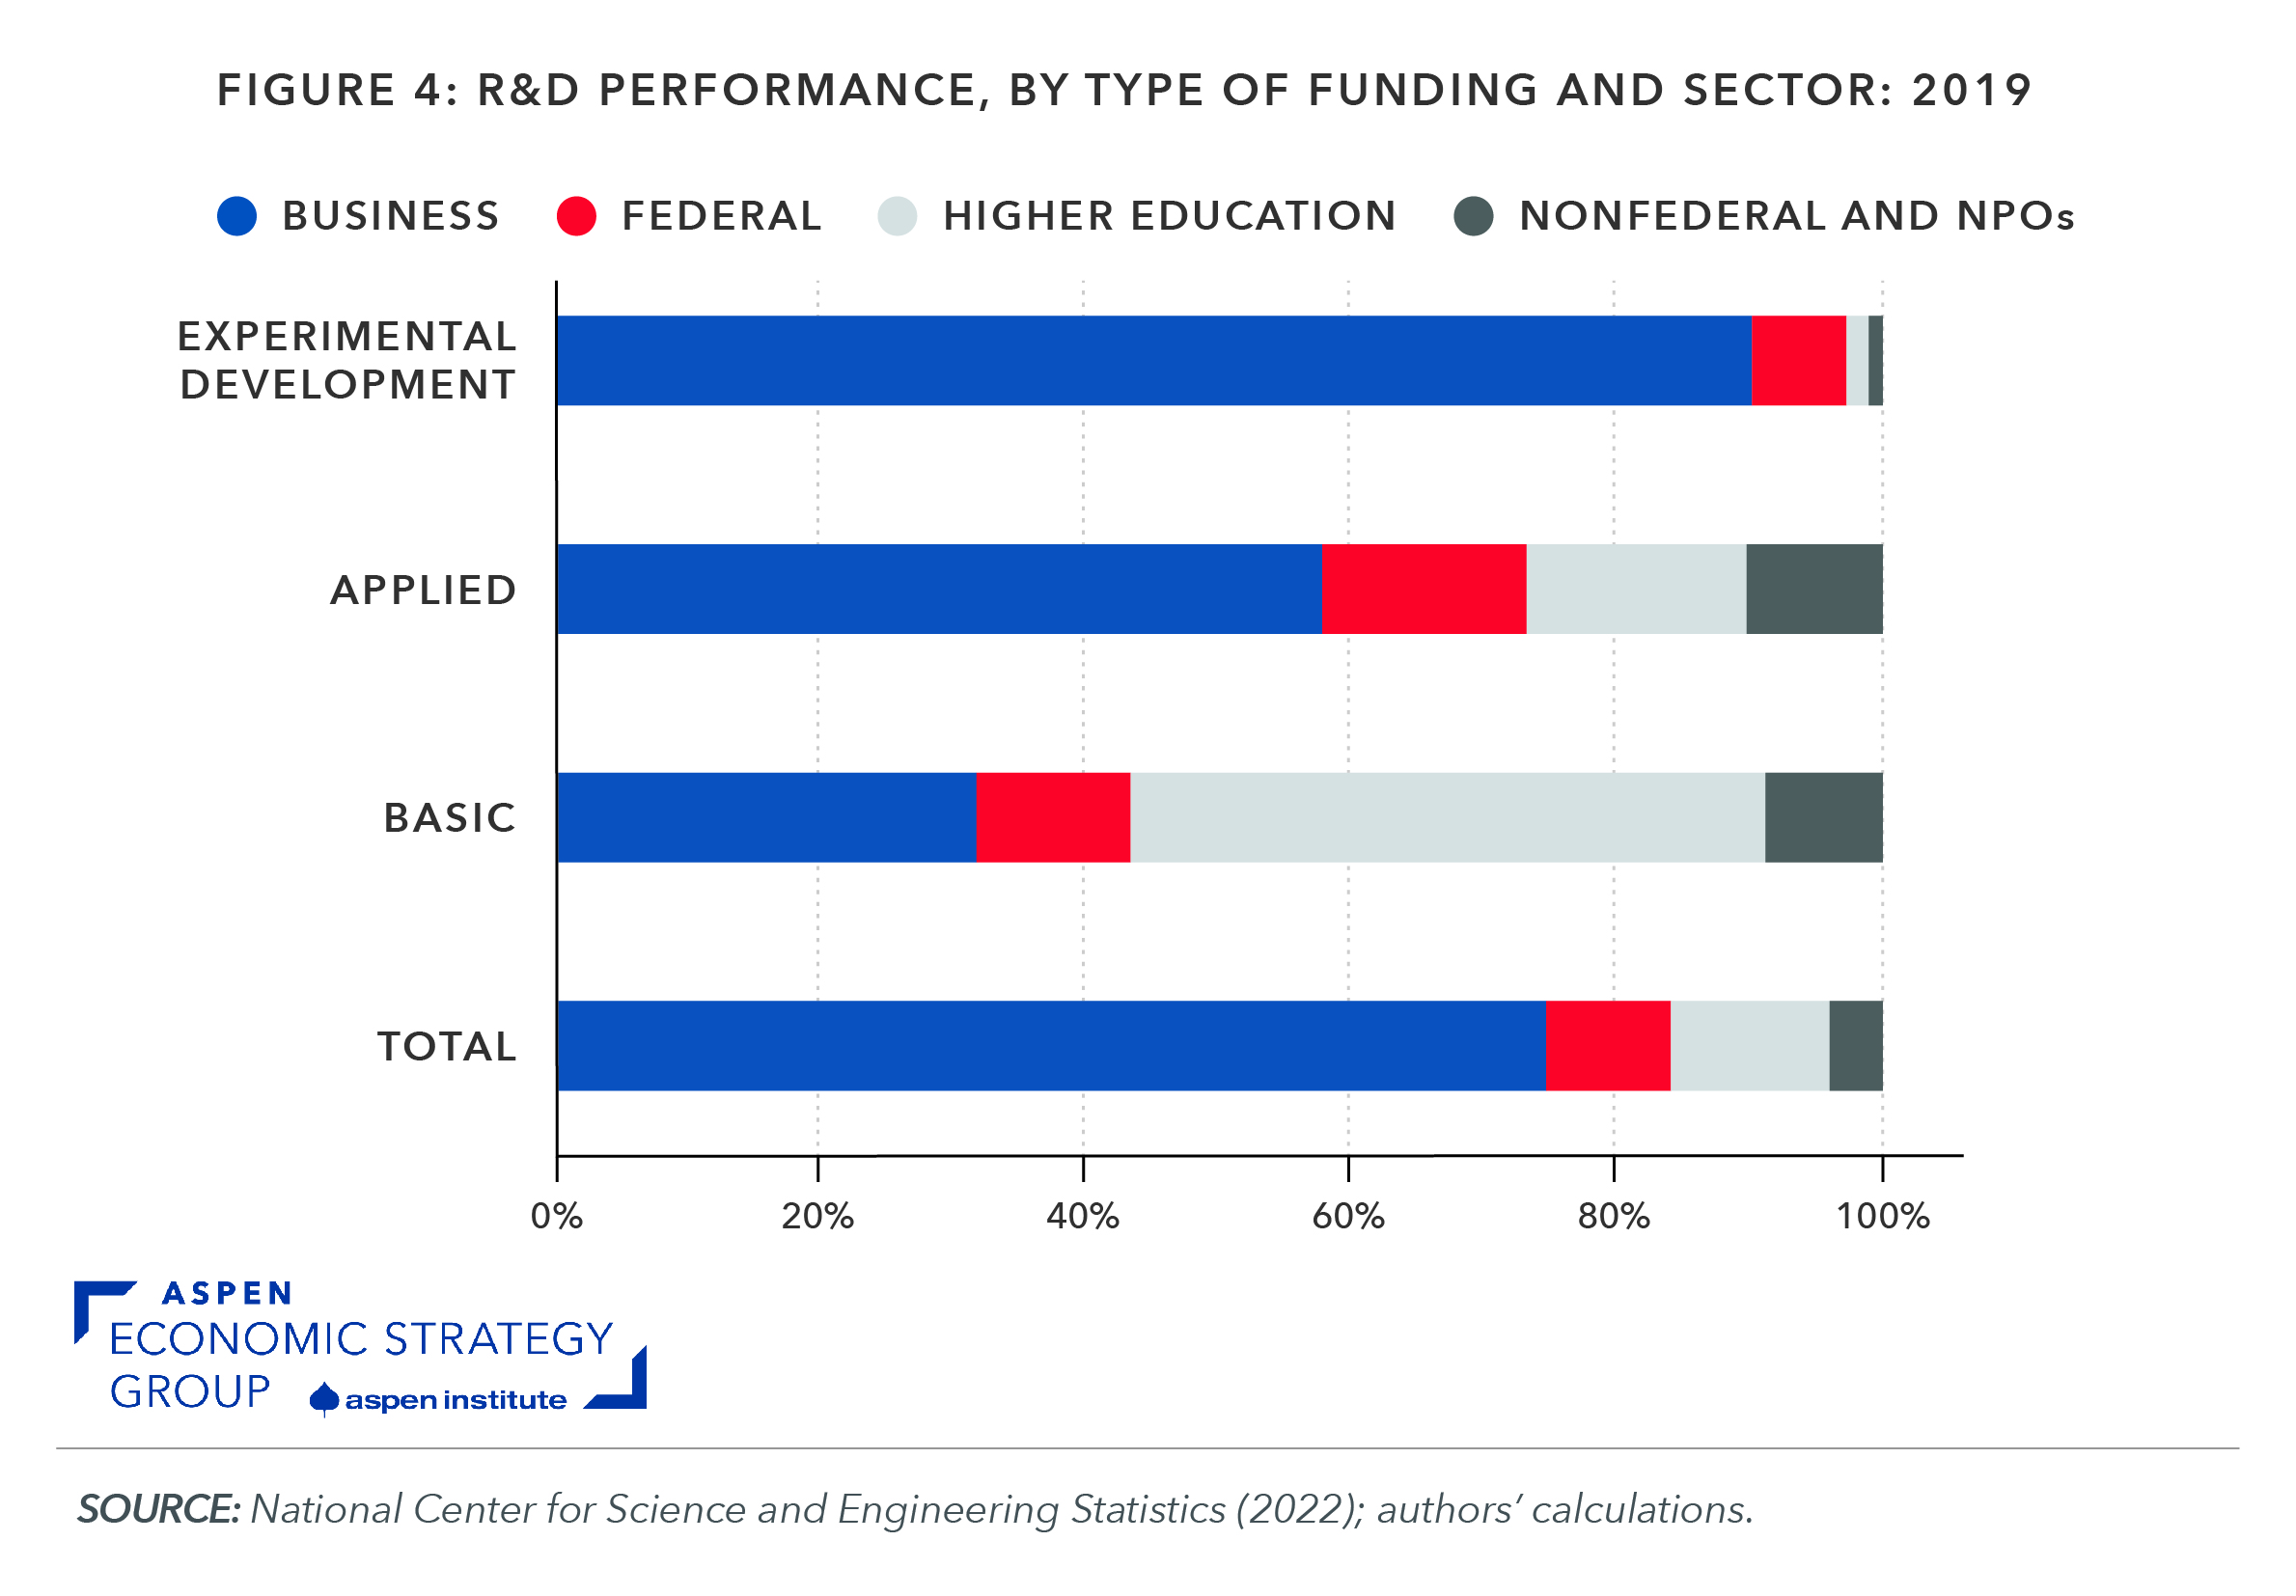
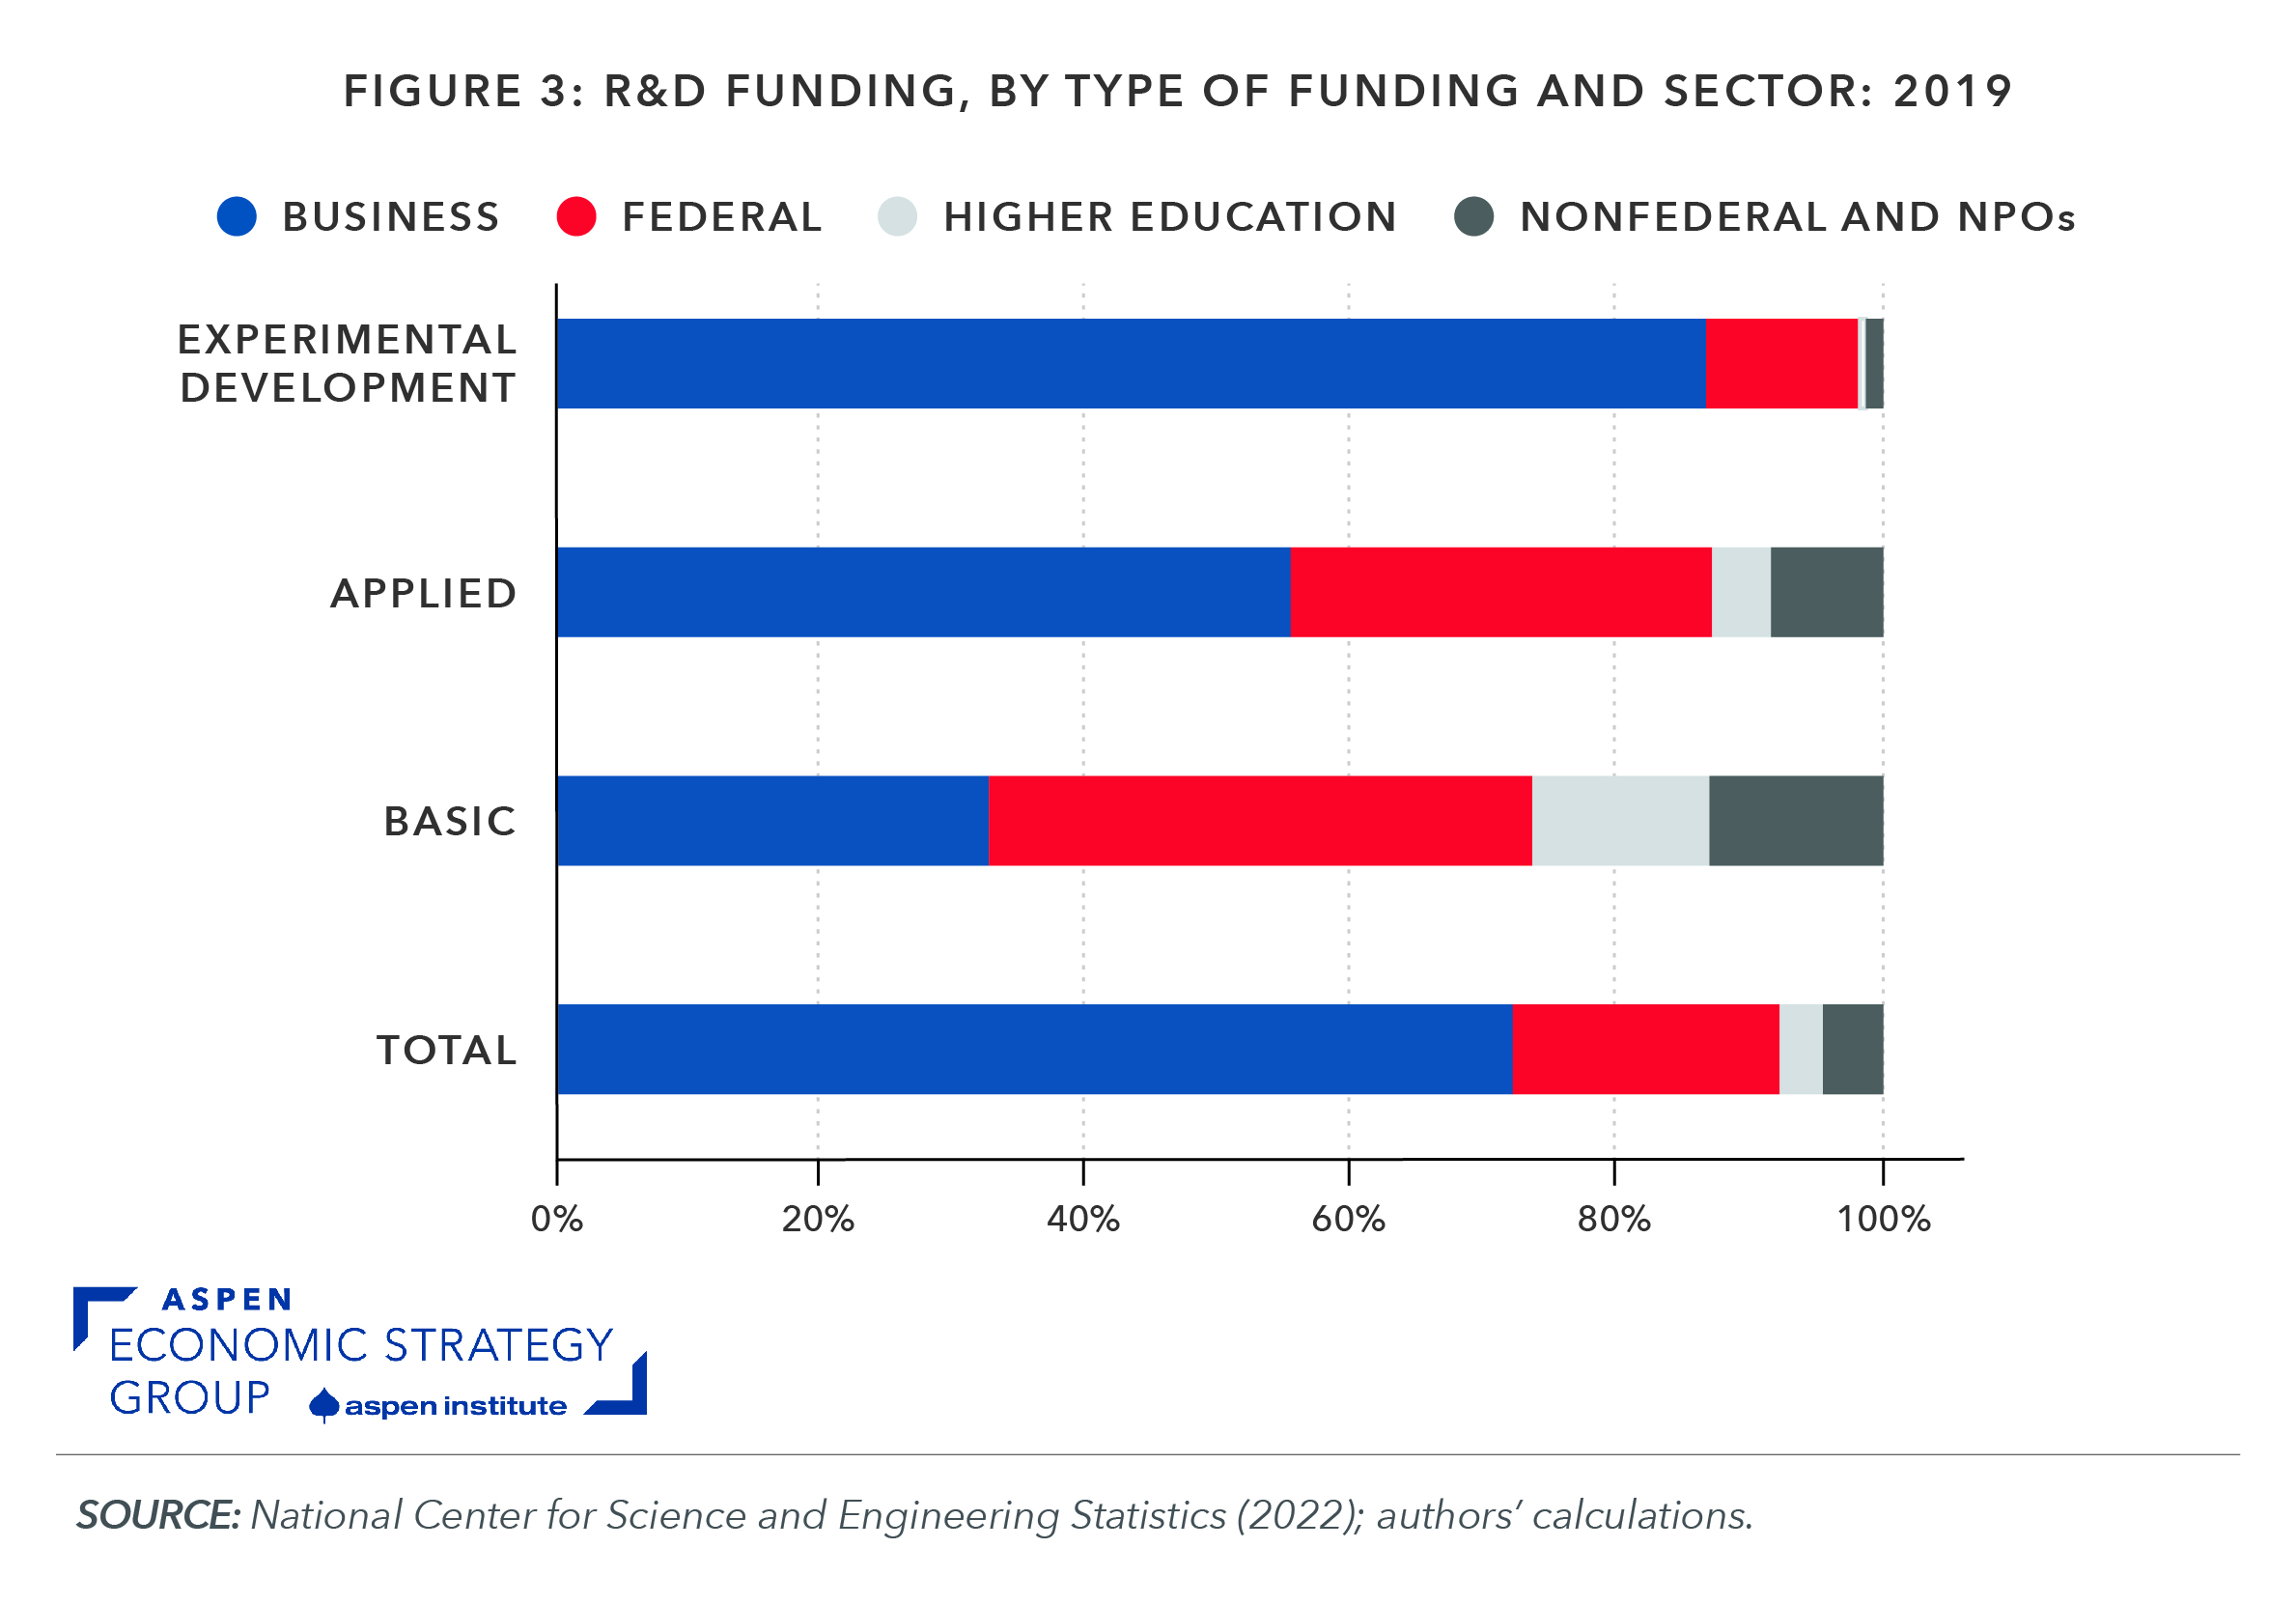
Figure 3: R&D funding, by type of funding and sector: 2019