Archives: Publications
These are AIESG Publications
Figure 4: Employment in energy intensive manufacturing, 2000 and 2019
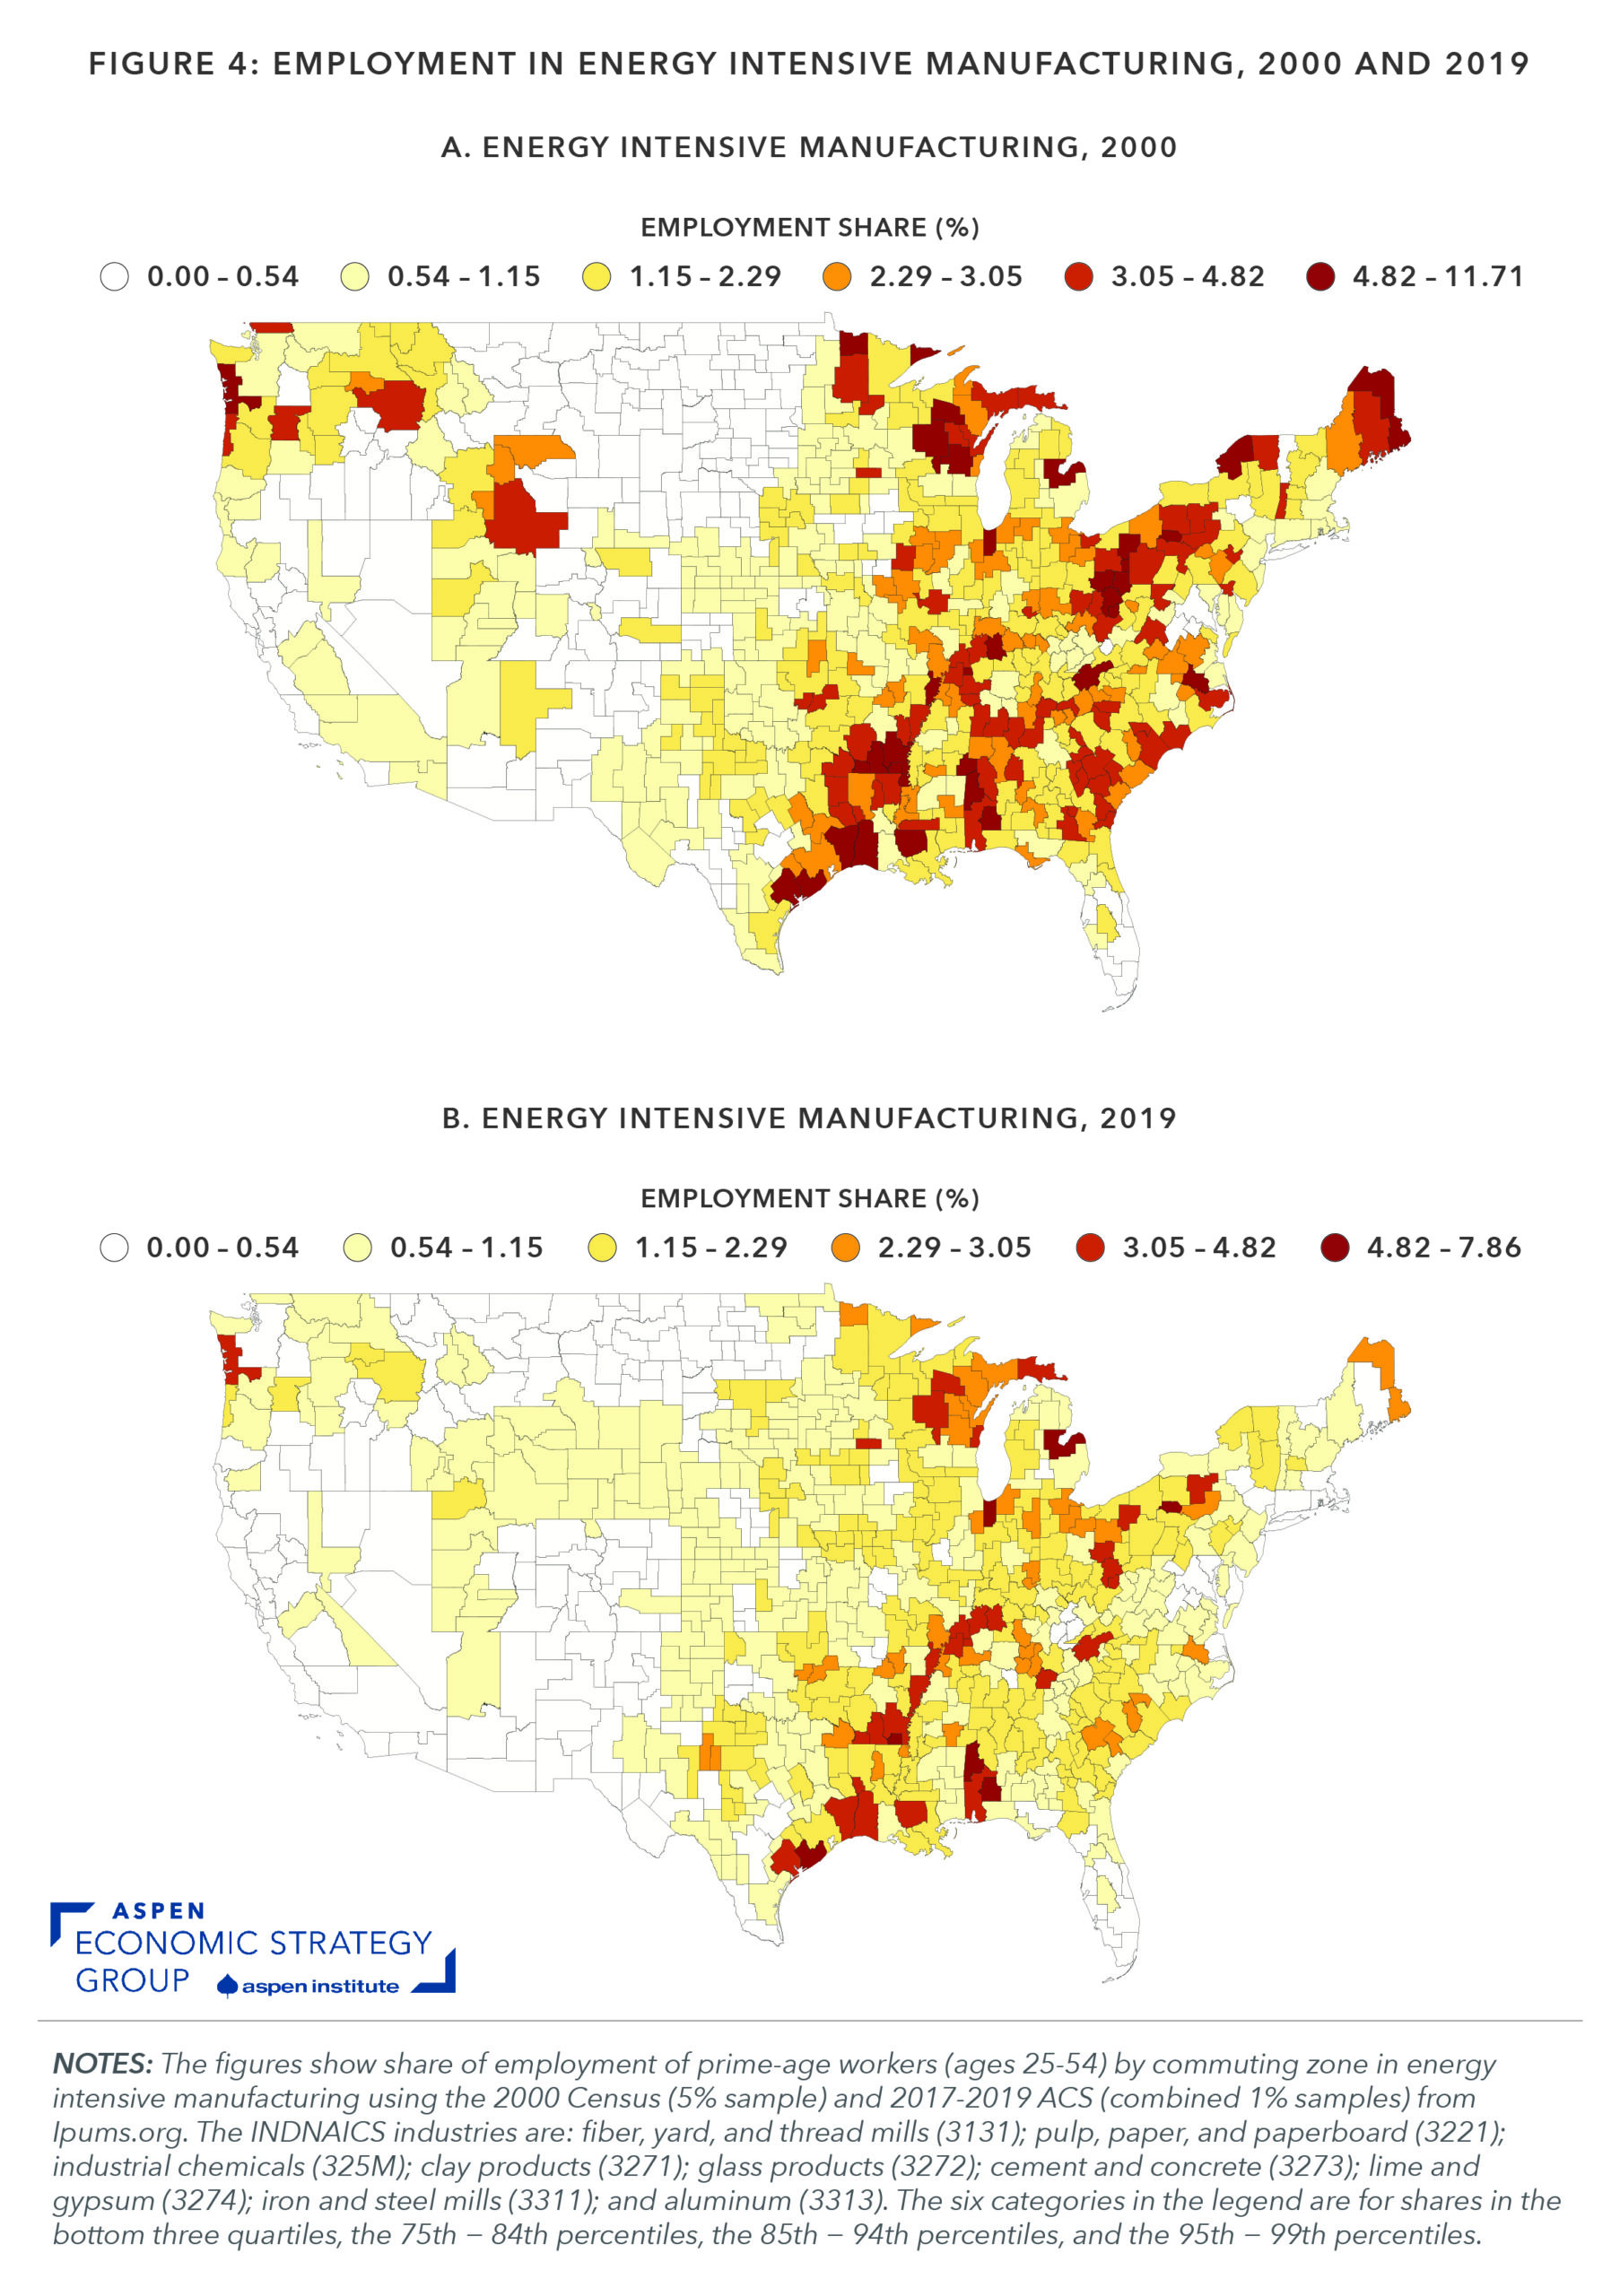
Figure 3: Employment in electric power generation and natural gas distribution, 2000 and 2019
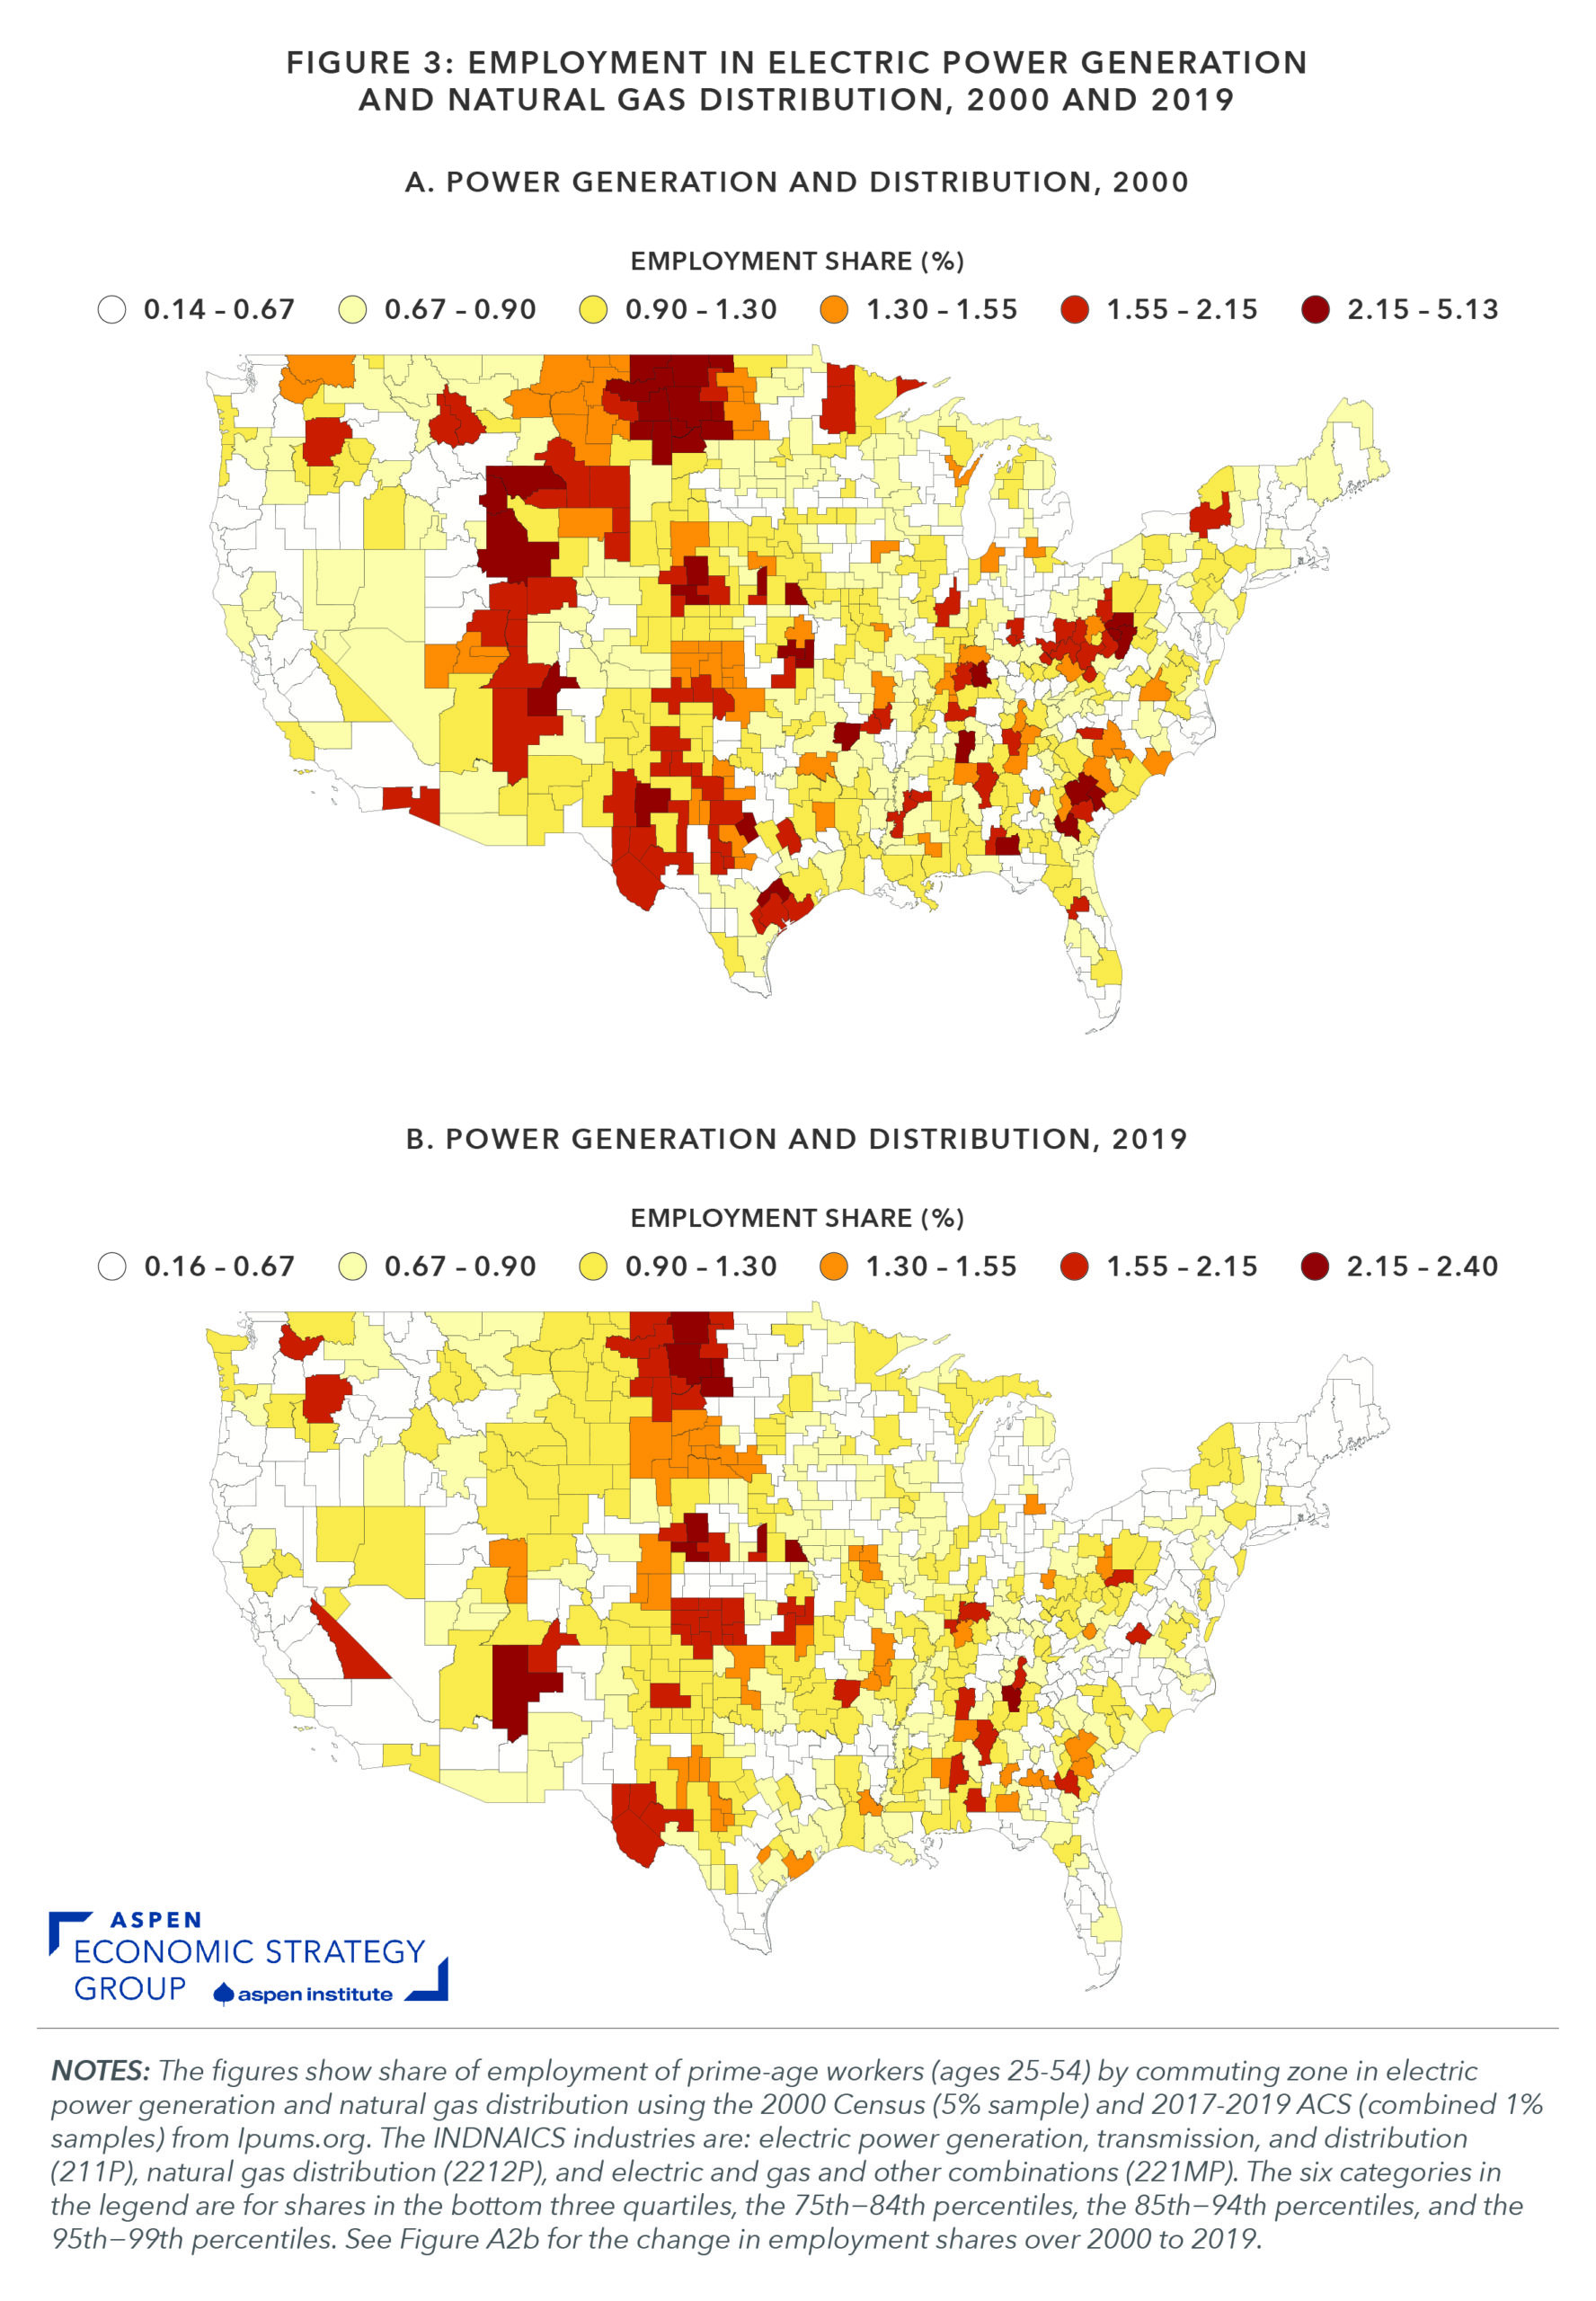
Figure 2: Employment in fossil fuel extraction and refining, 200 and 2019
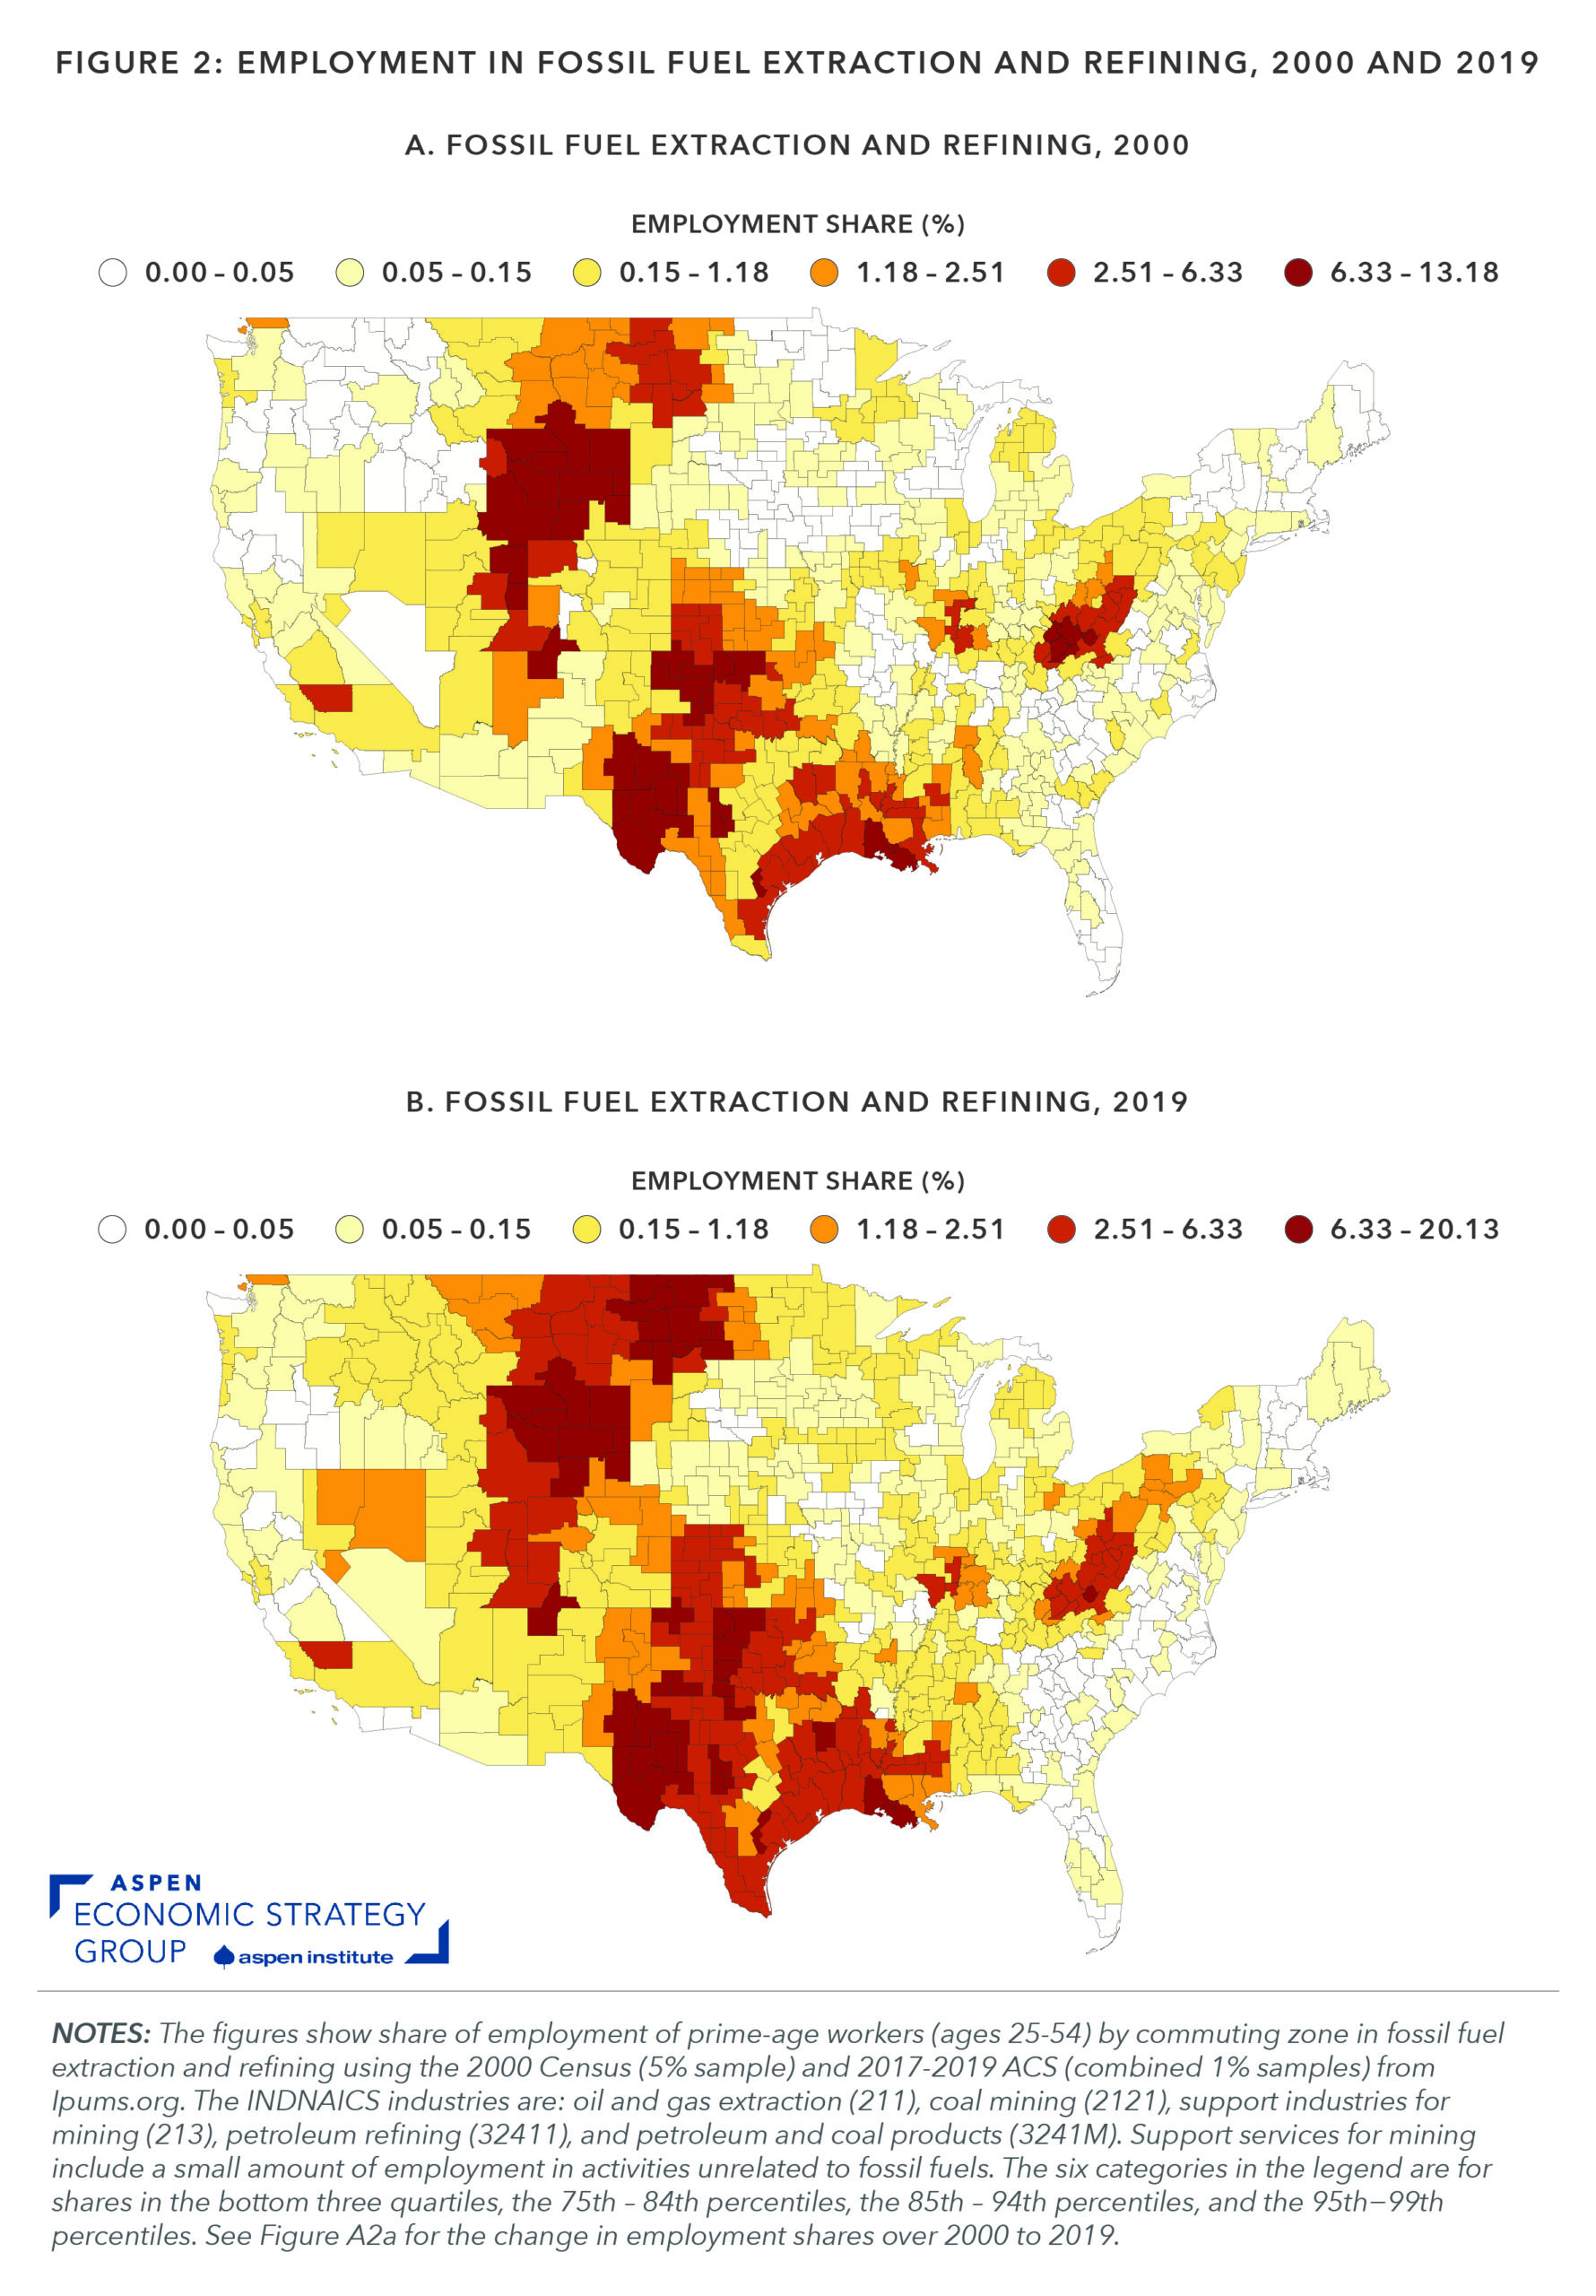
Figure 1: Employment in energy extraction, refining, and electricity generation, 2021
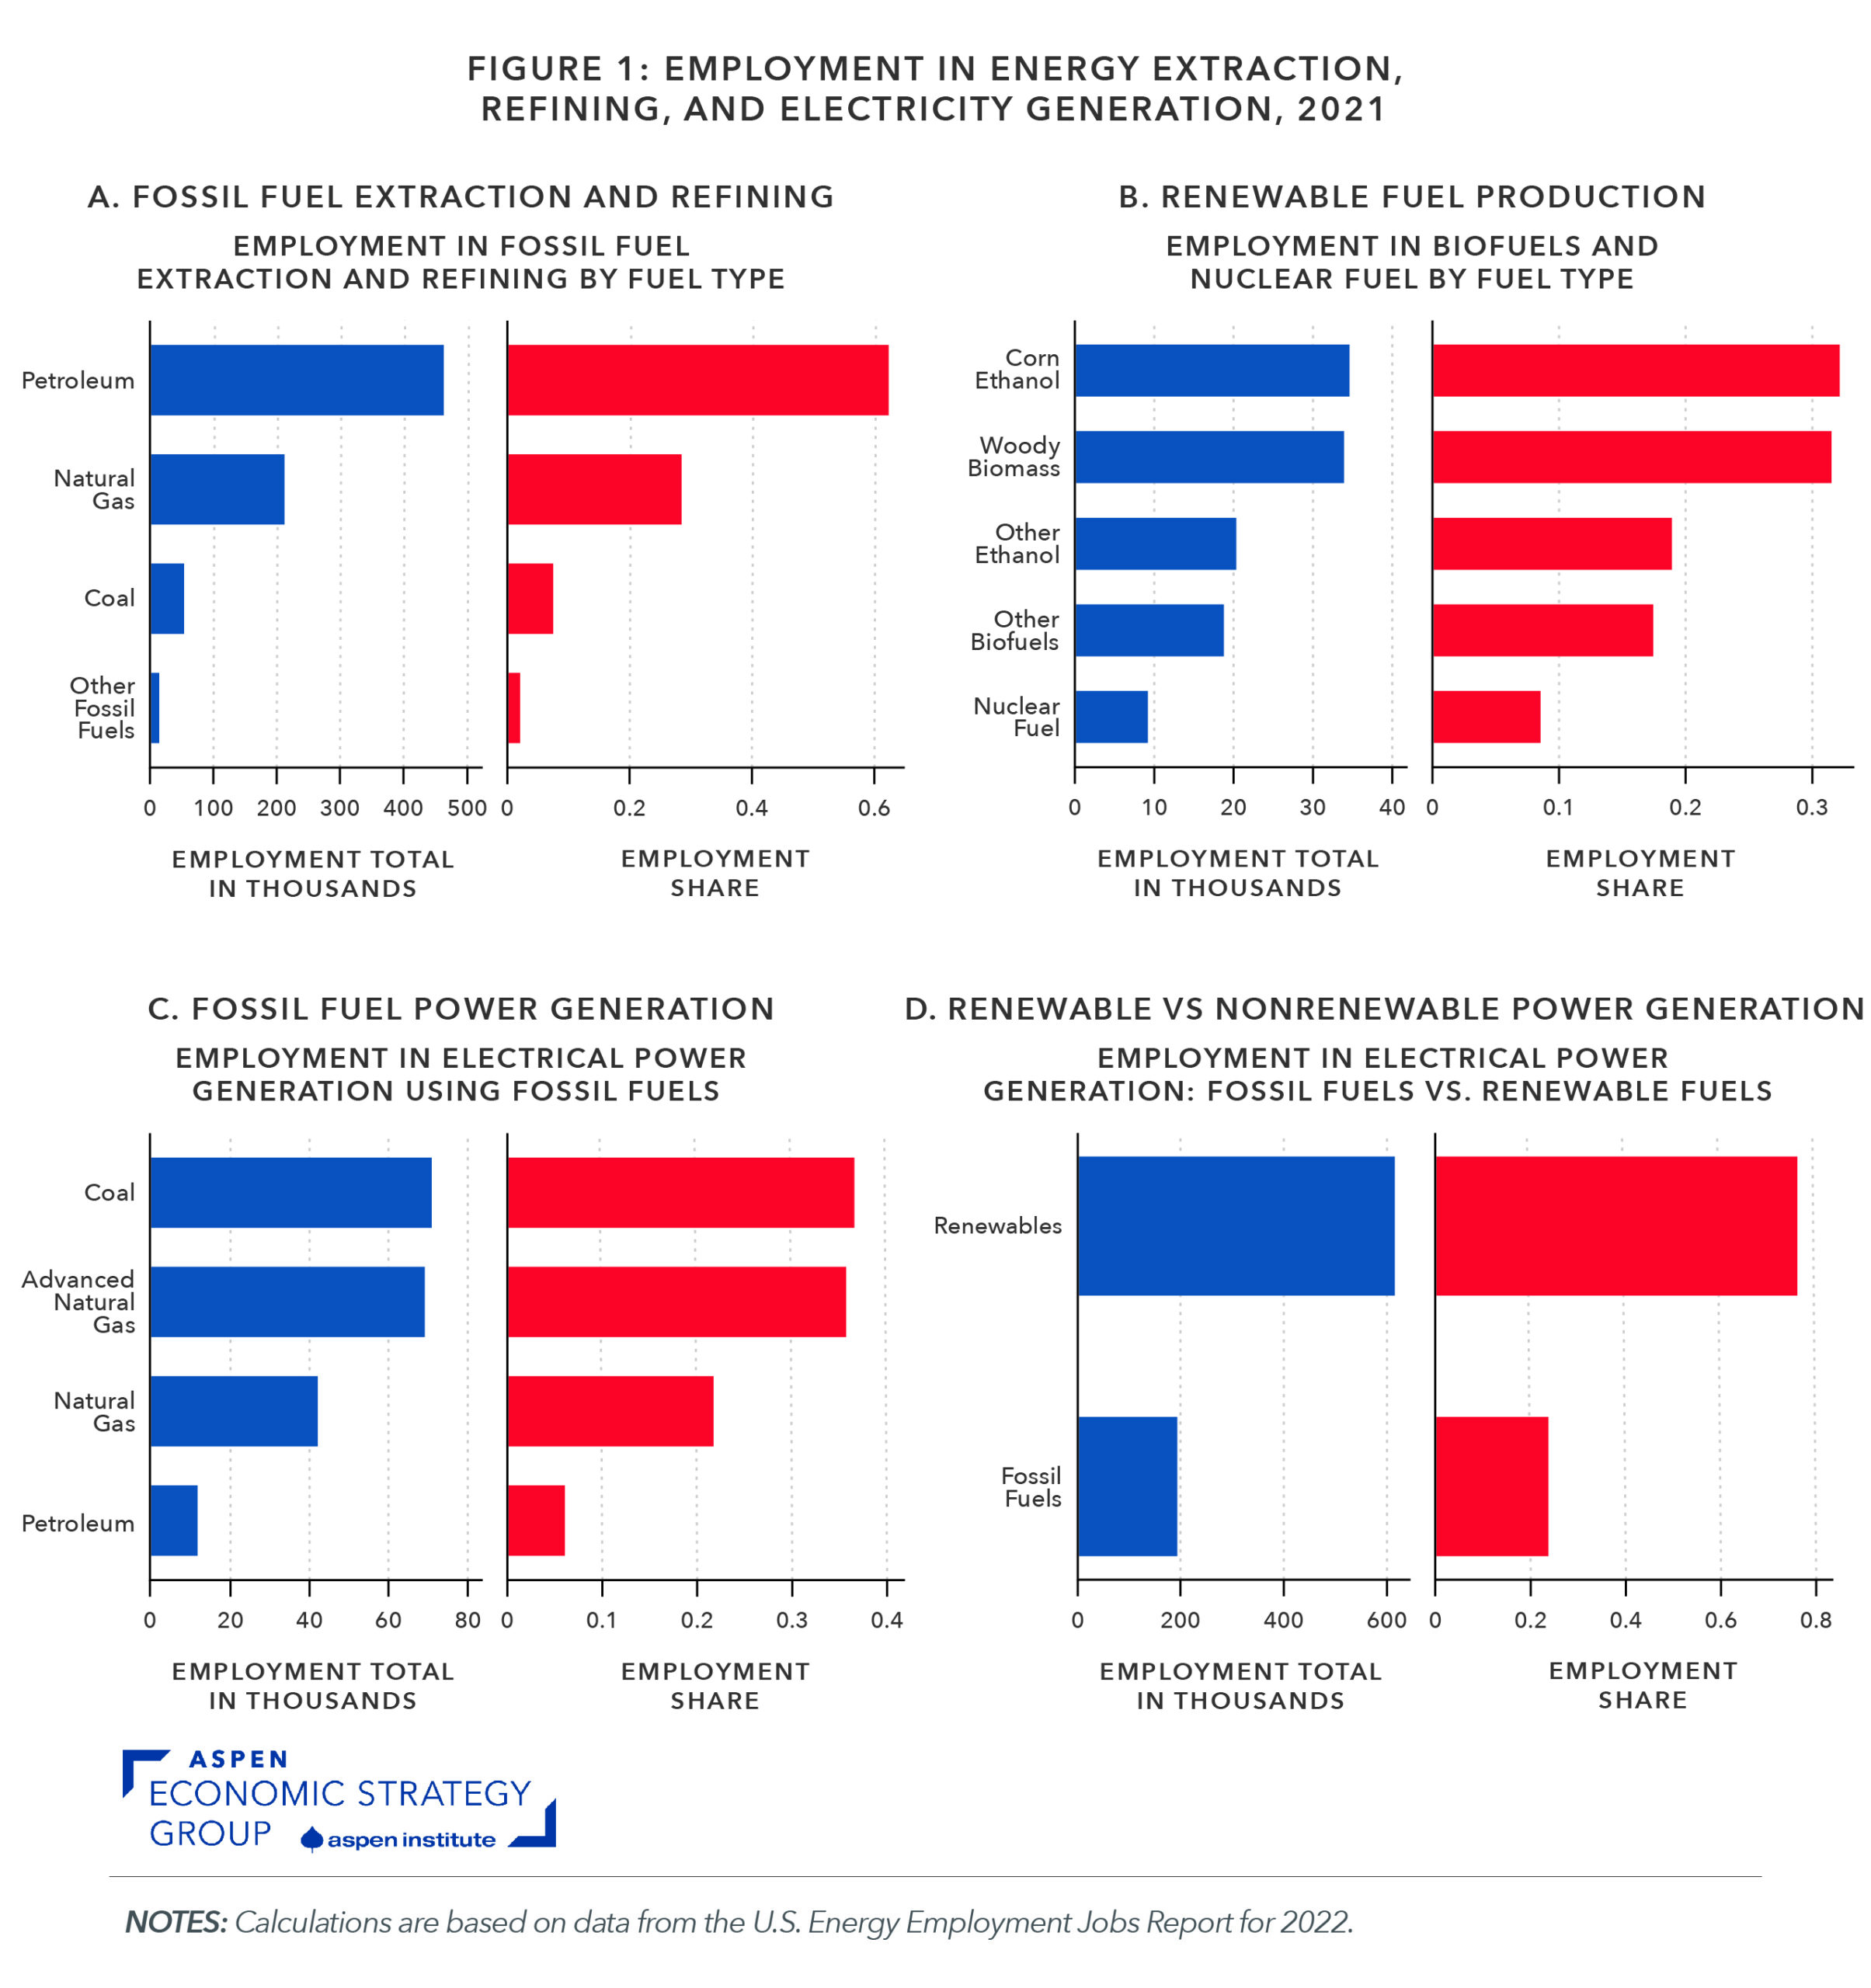
Figure 6: Social Security benefit to earnings replacement rates at age 65

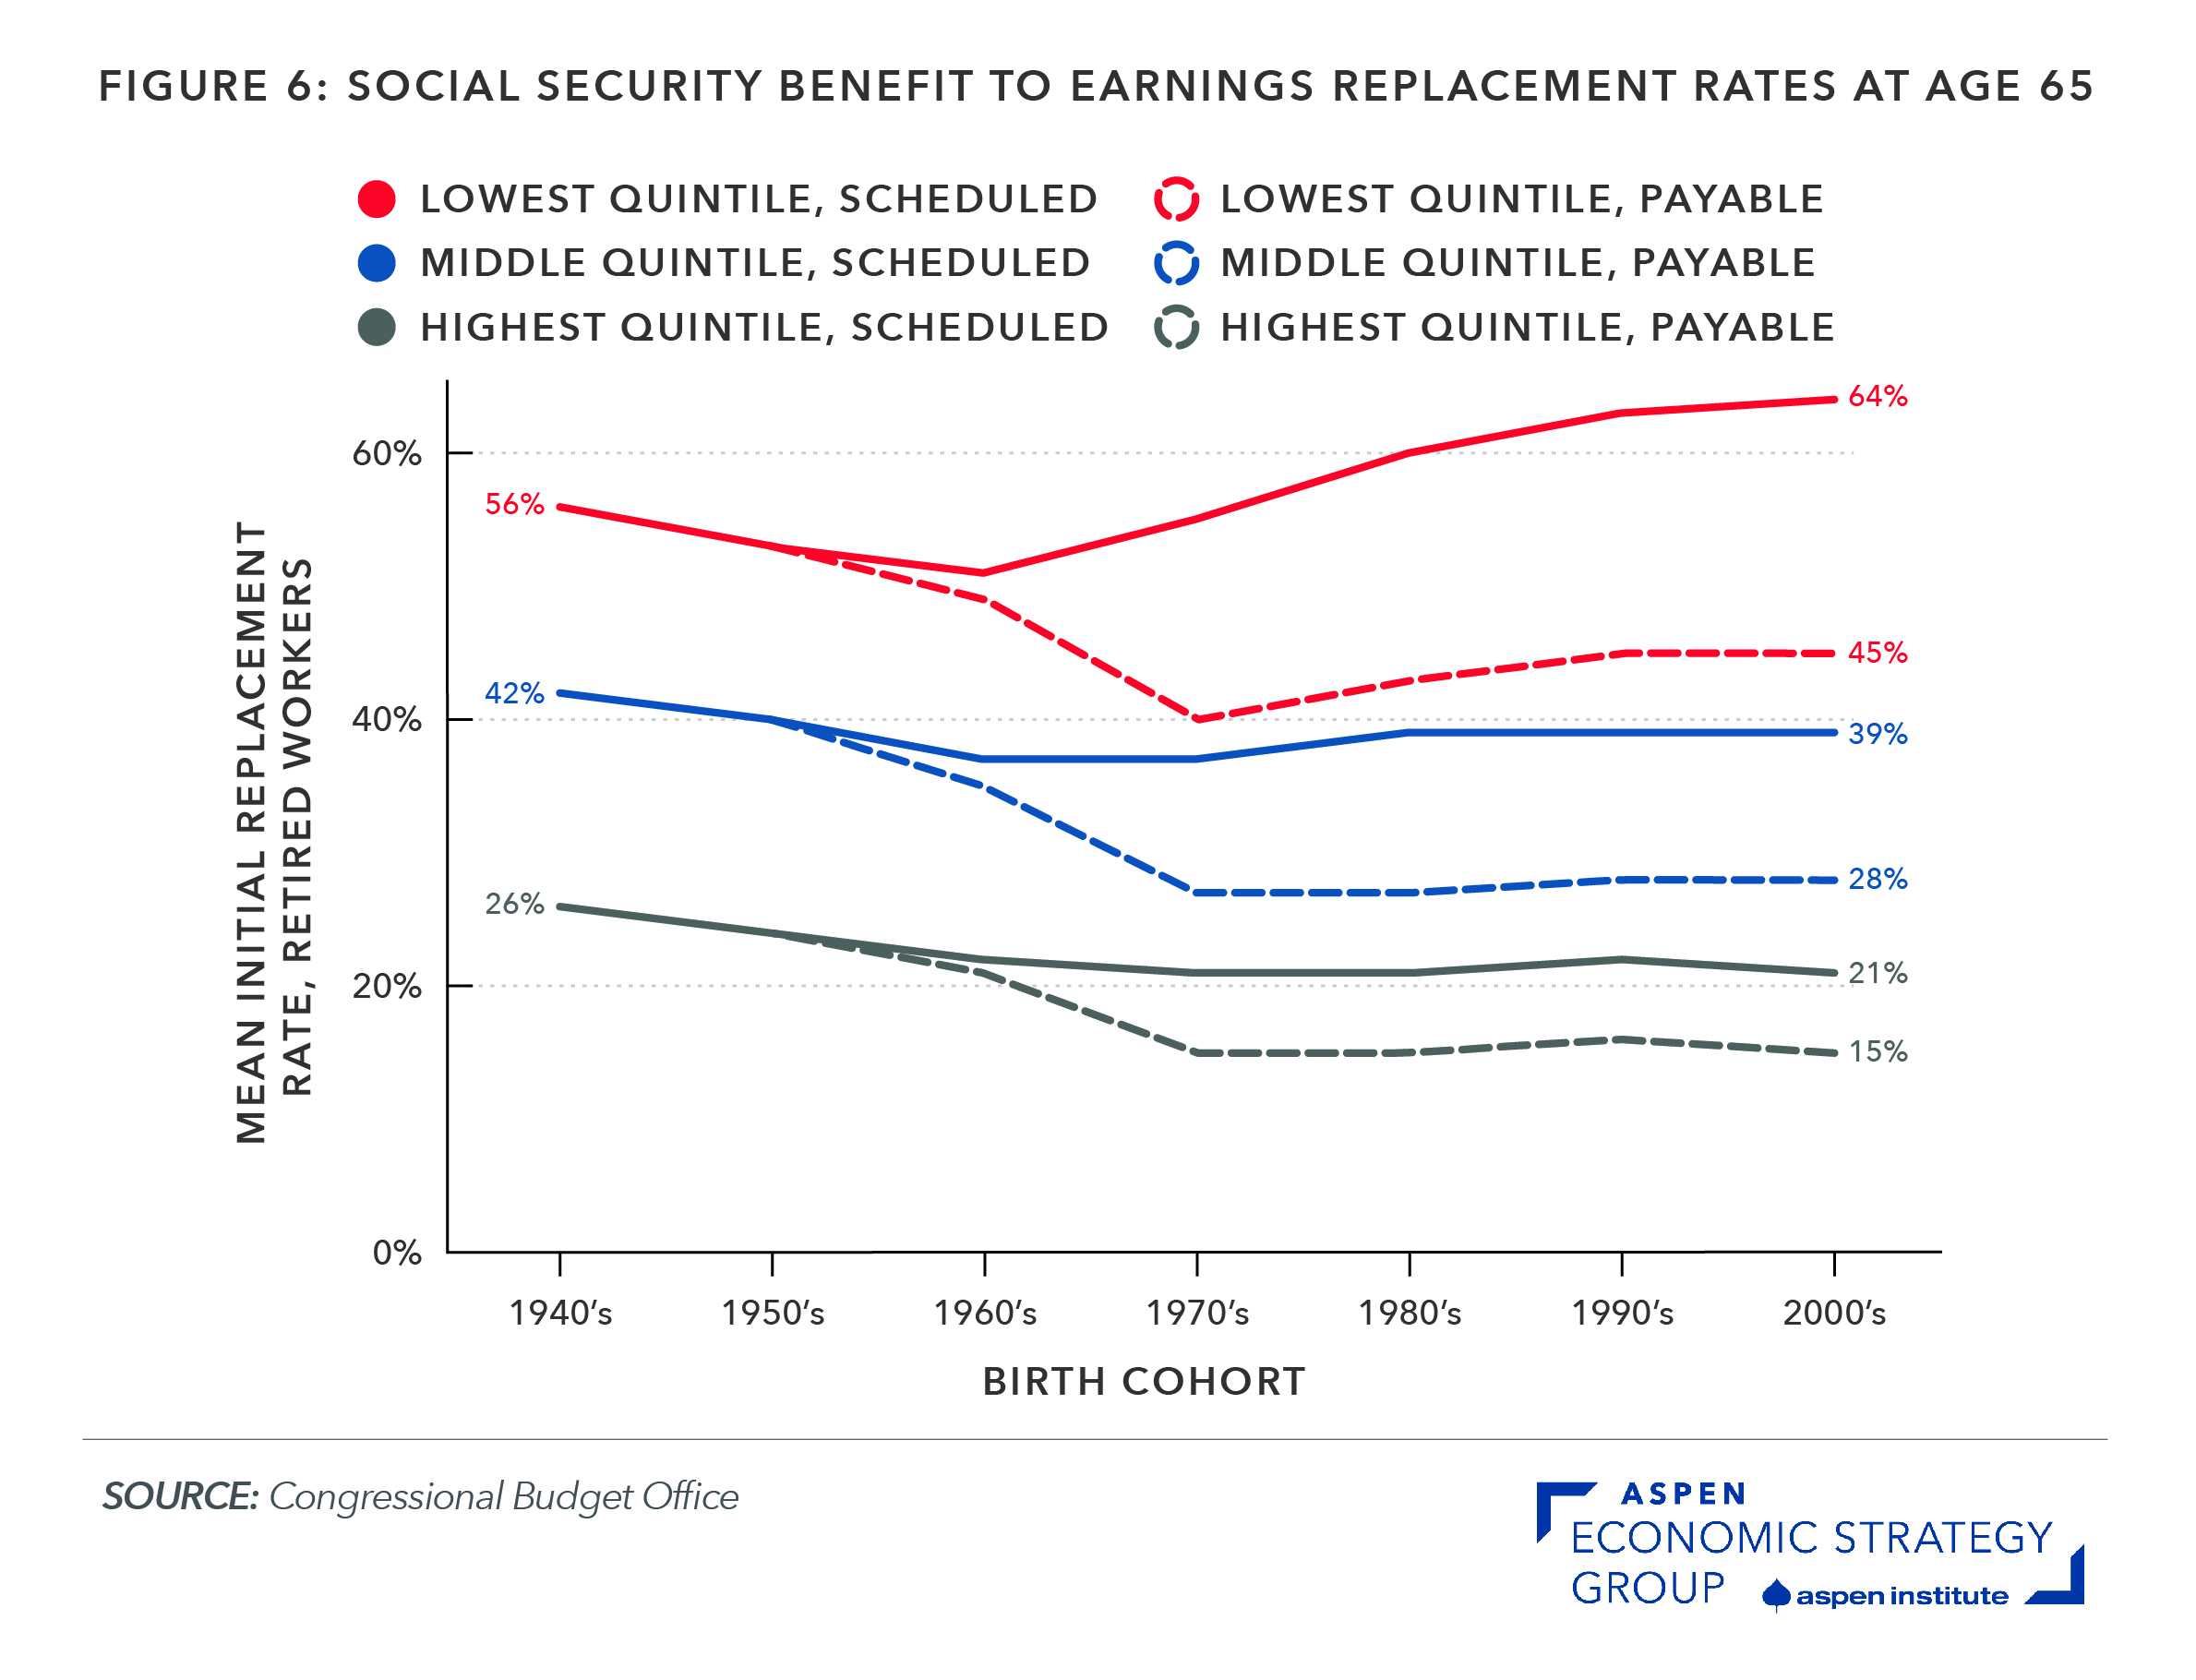
Figure 5: Social Security lifetime benefit-to-tax ratios
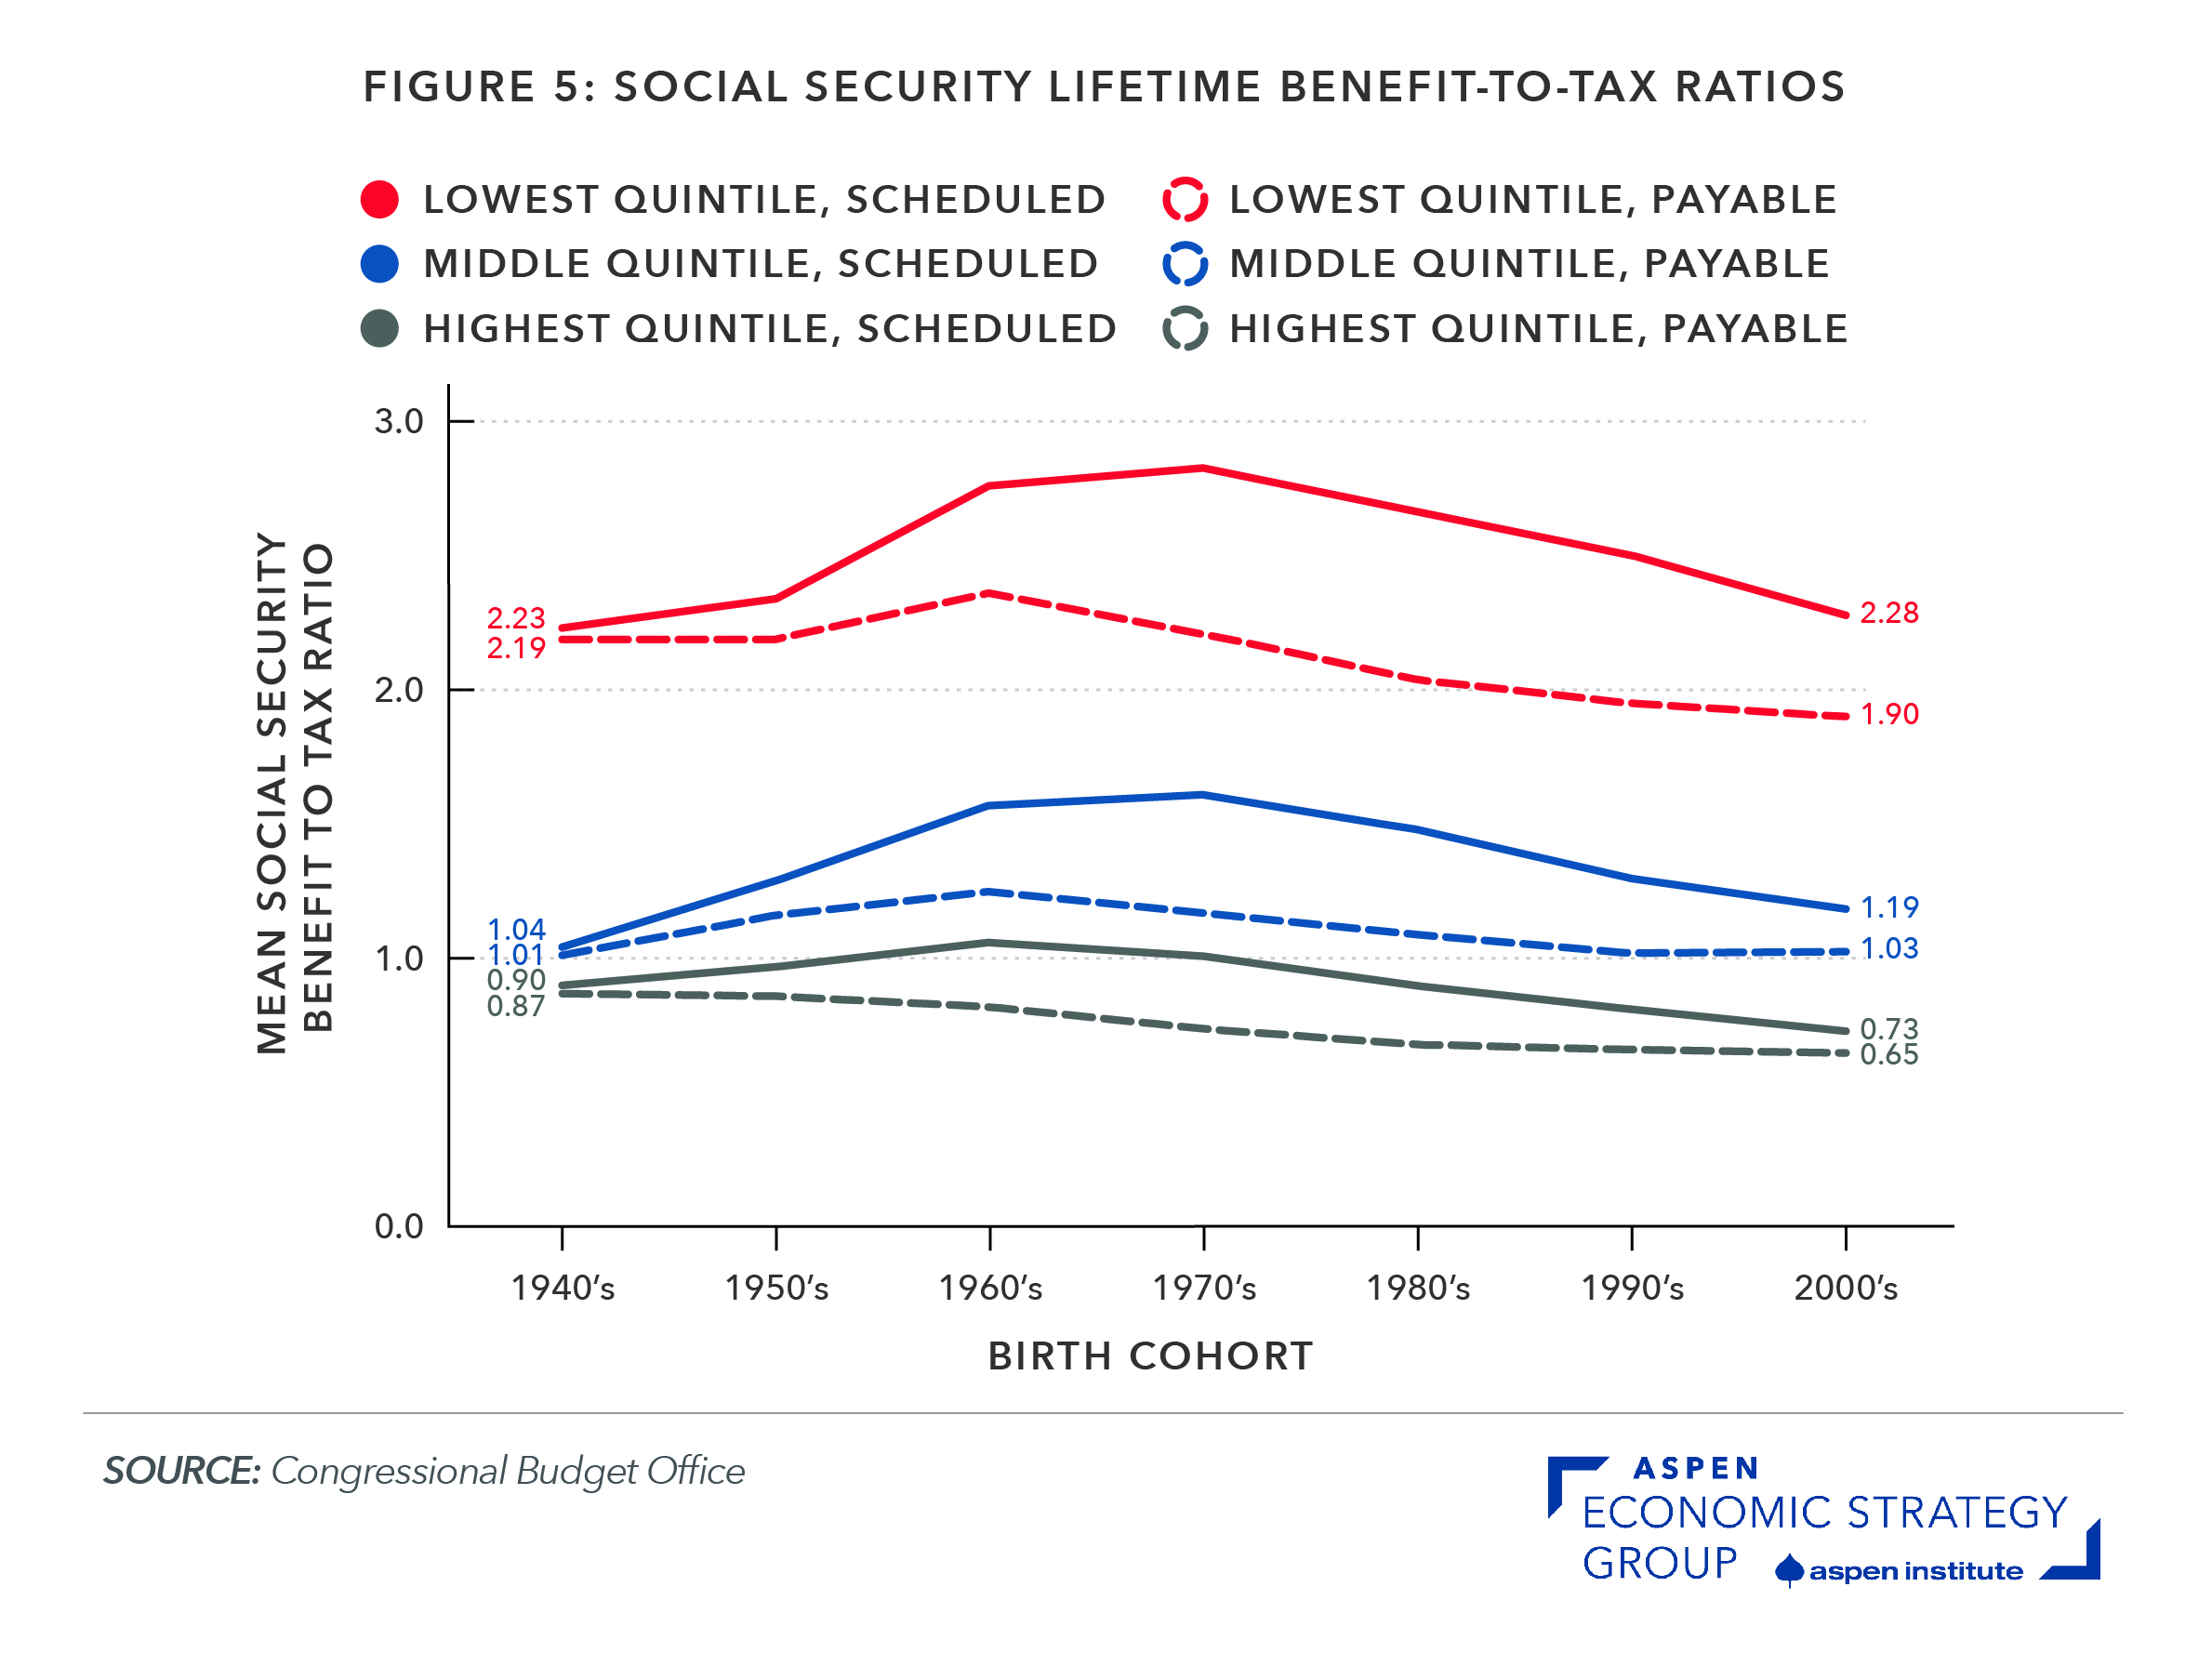
Figure 4: Components of federal revenues as a share of GDP
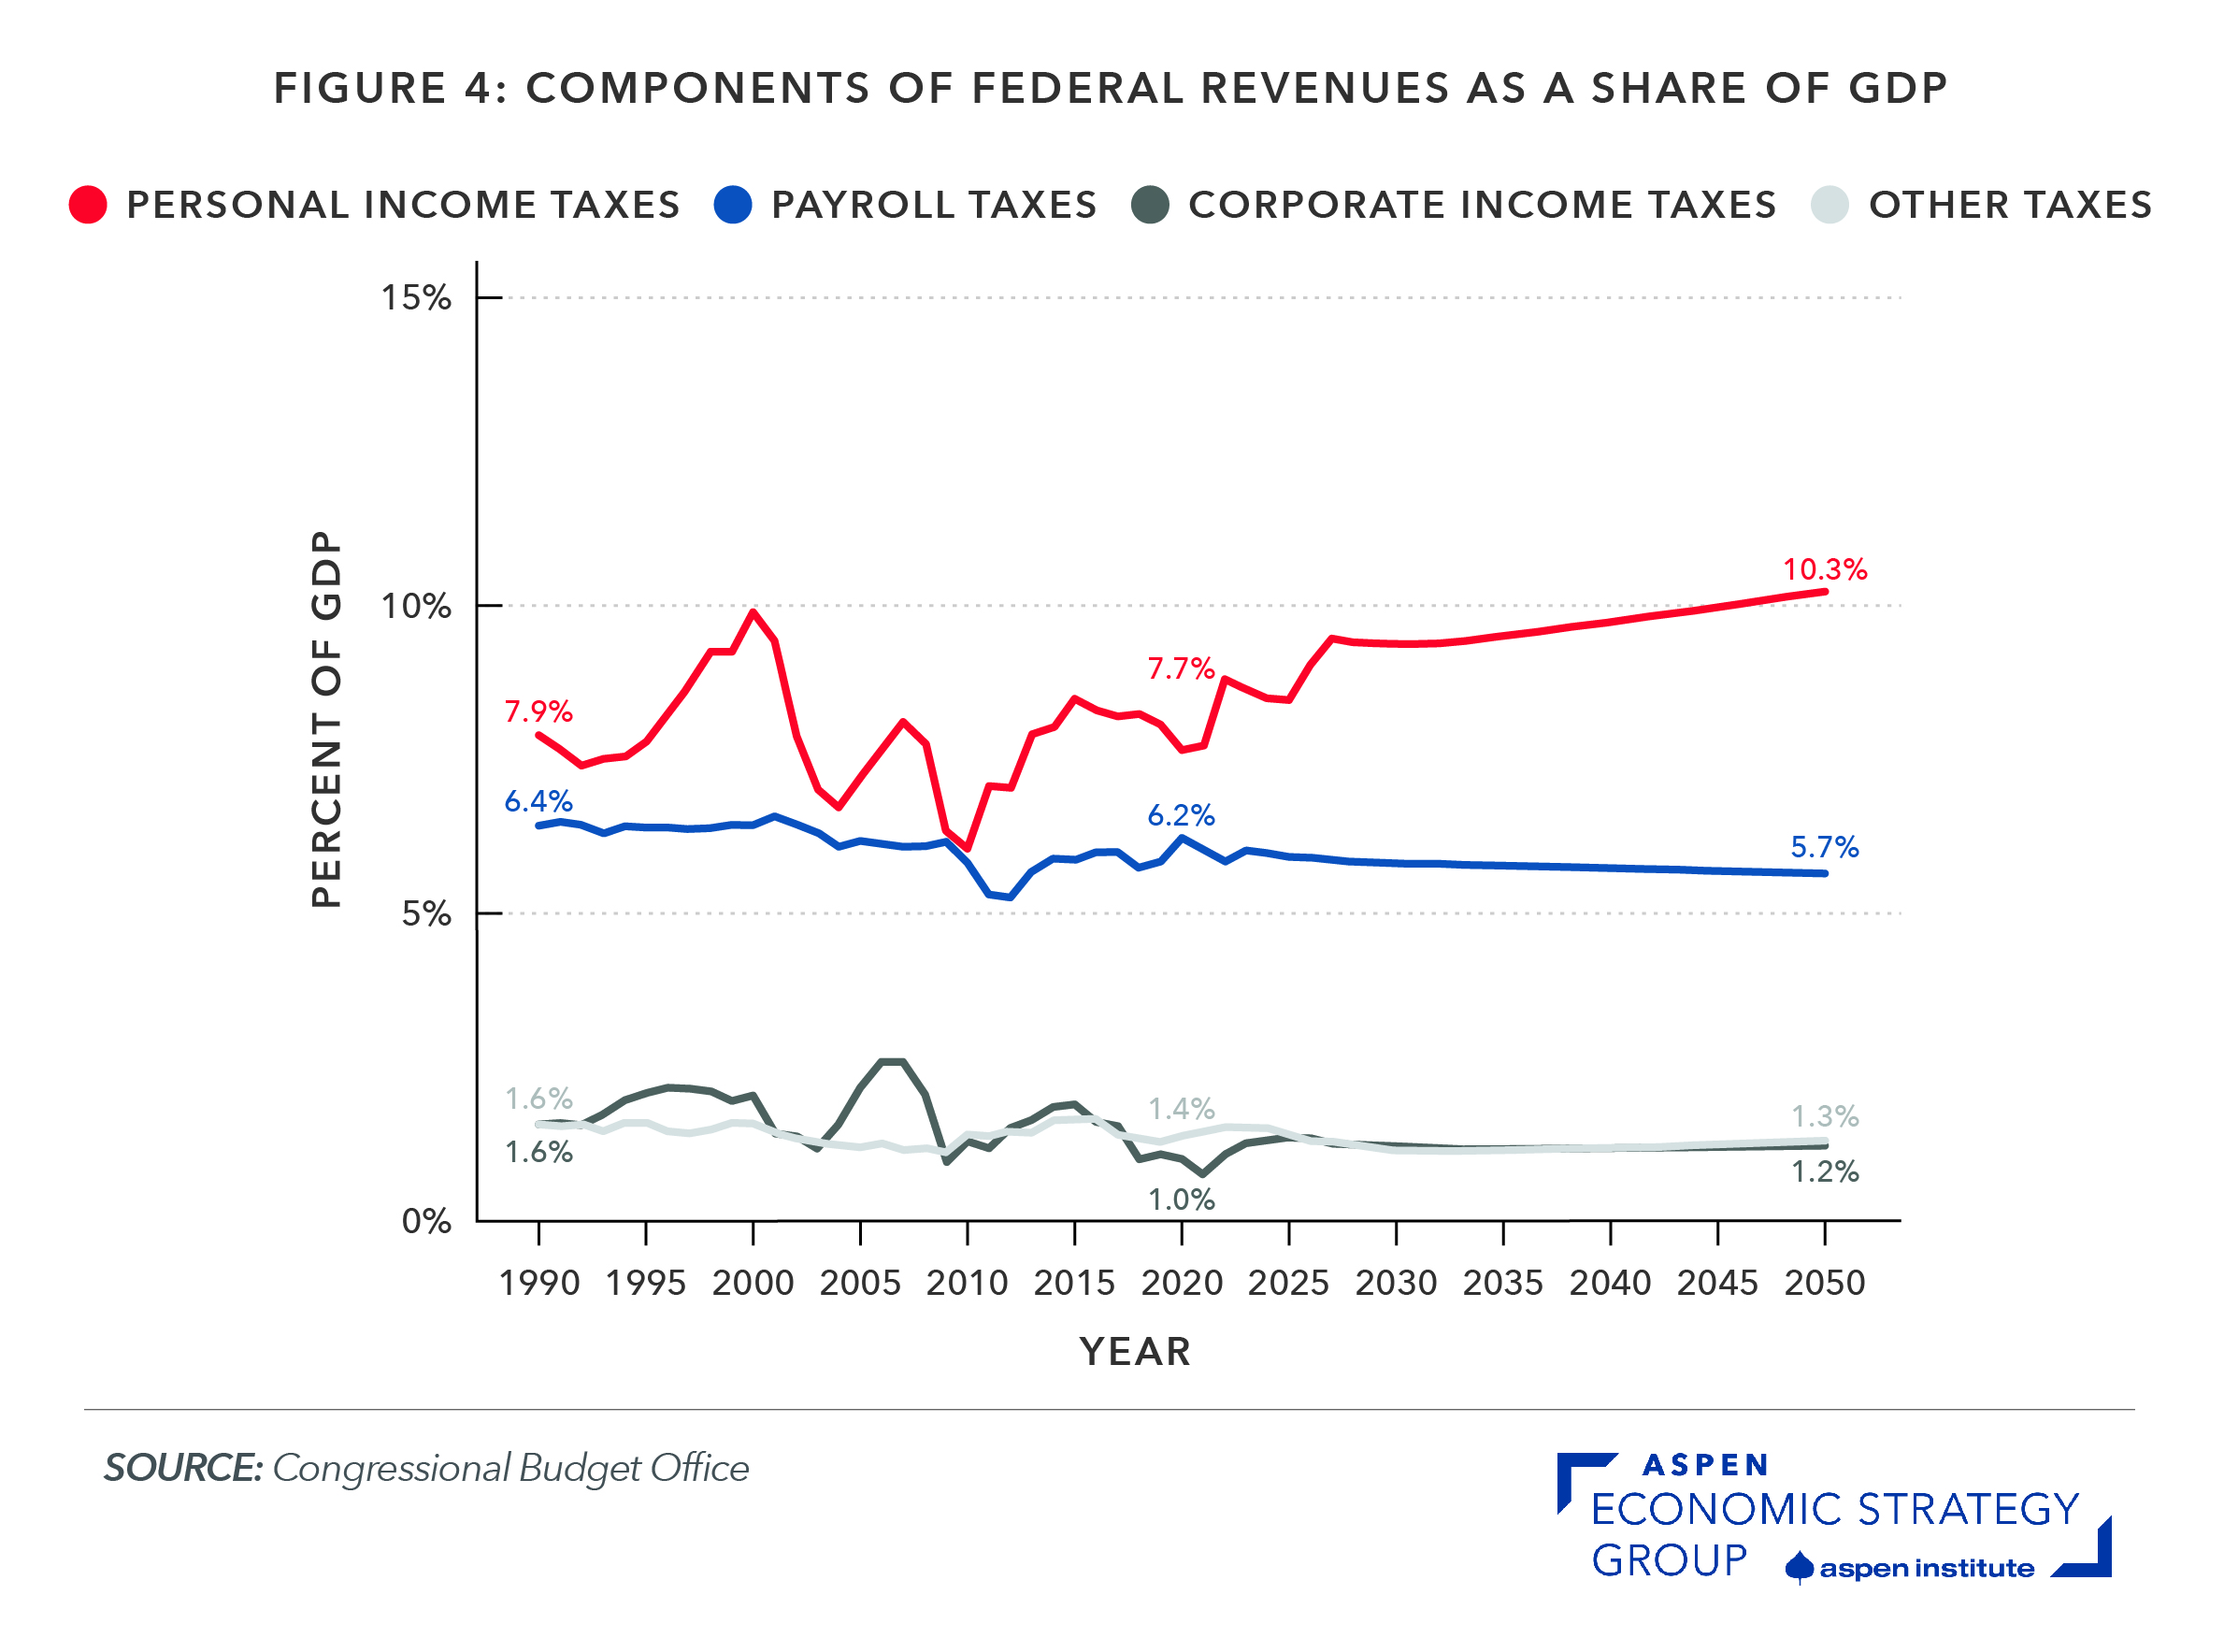
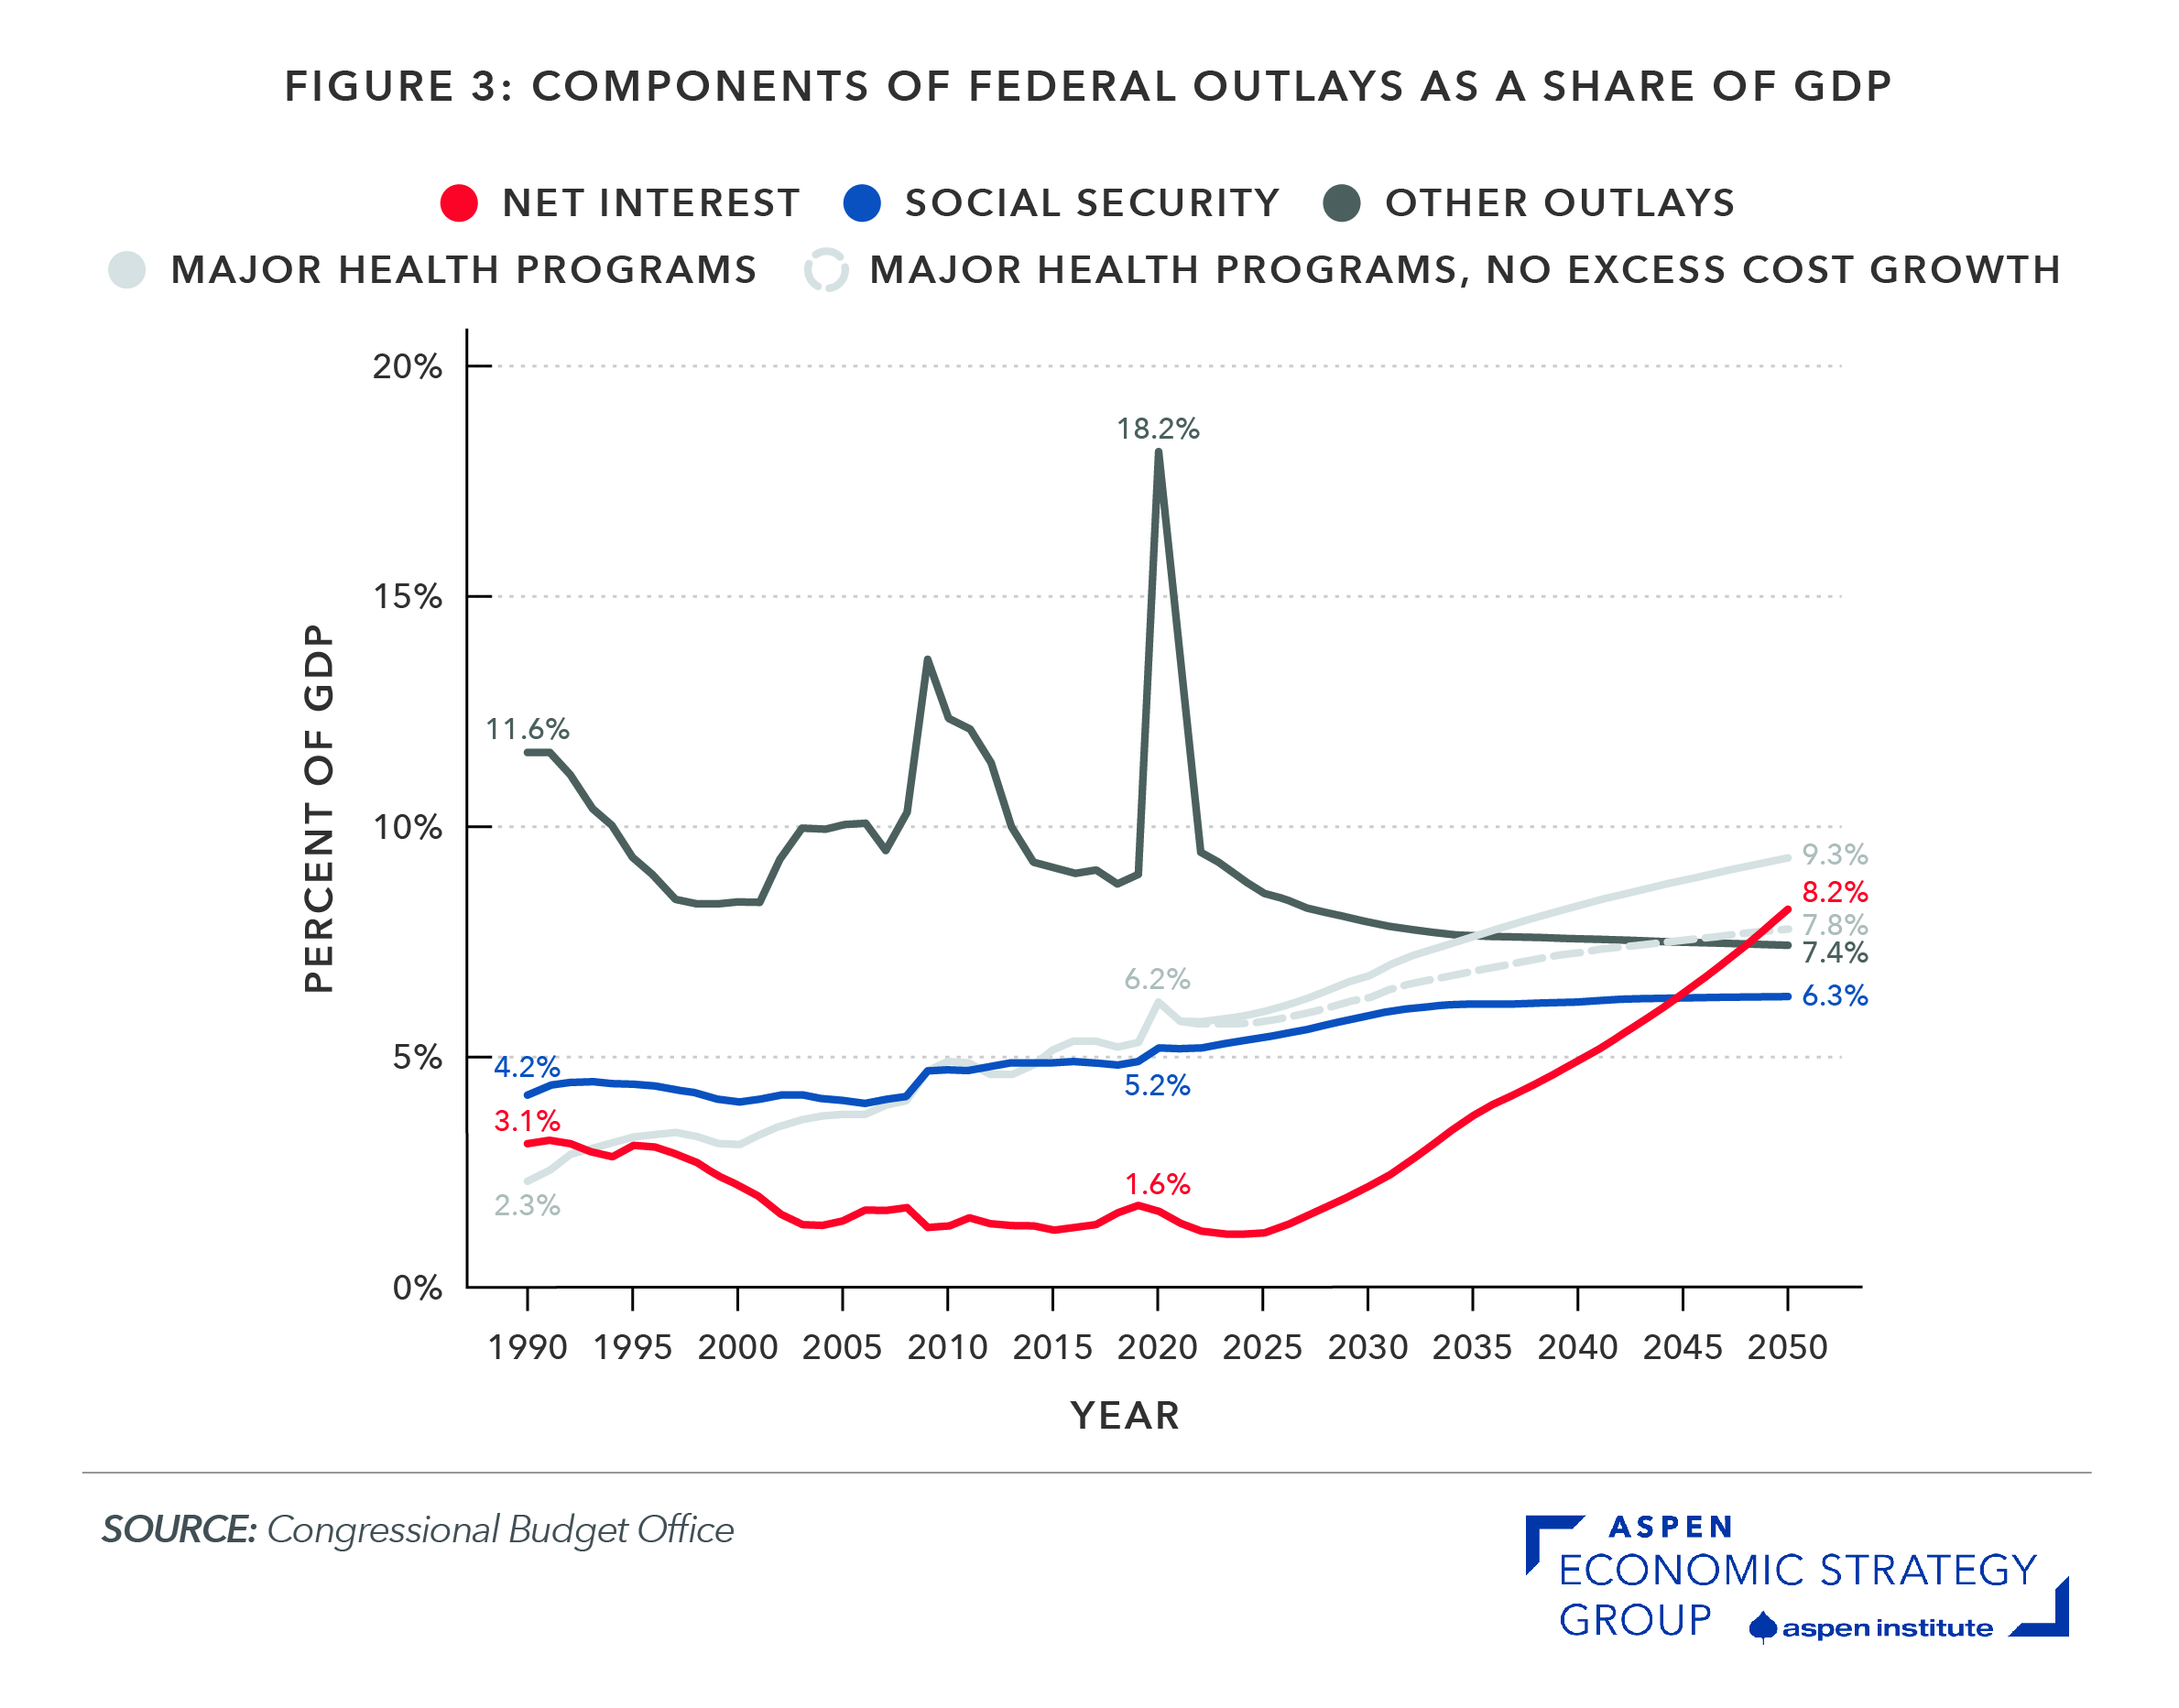
Figure 3: Components of federal outlays as a share of GDP