Archives: Publications
These are AIESG Publications
Figure 1: SSA’s projections for the OASDI trust fund: 2004 versus 2023
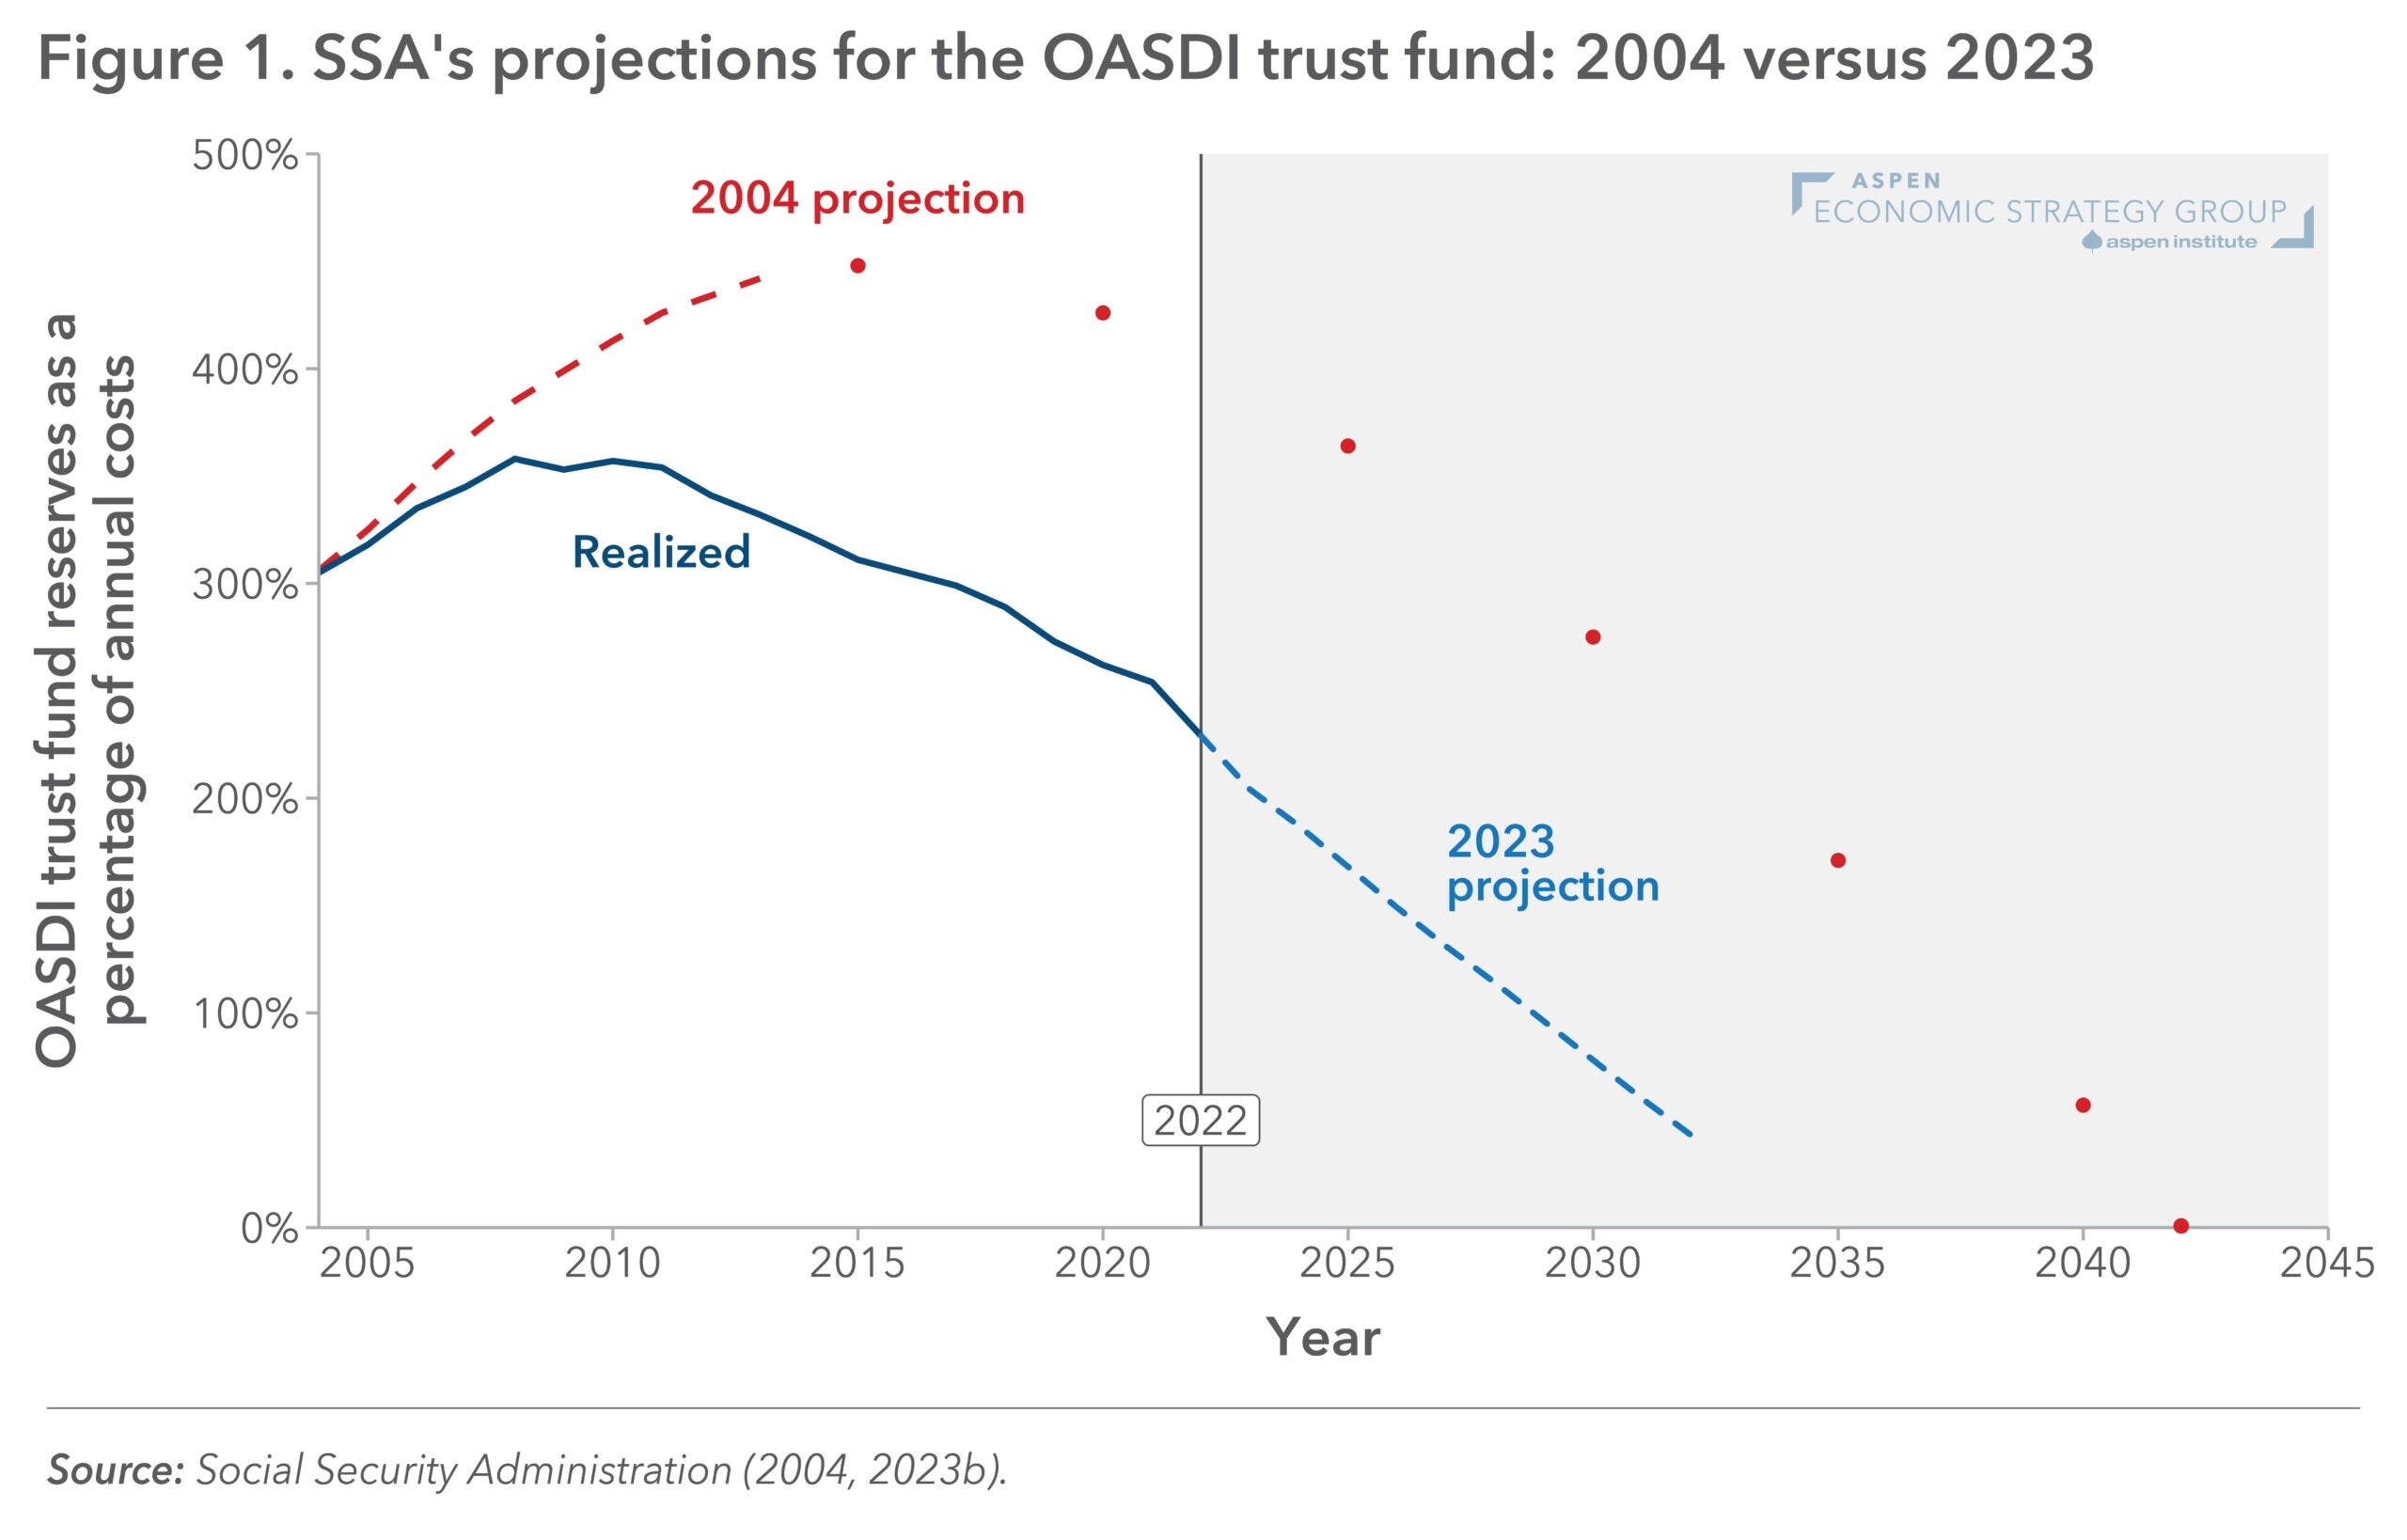
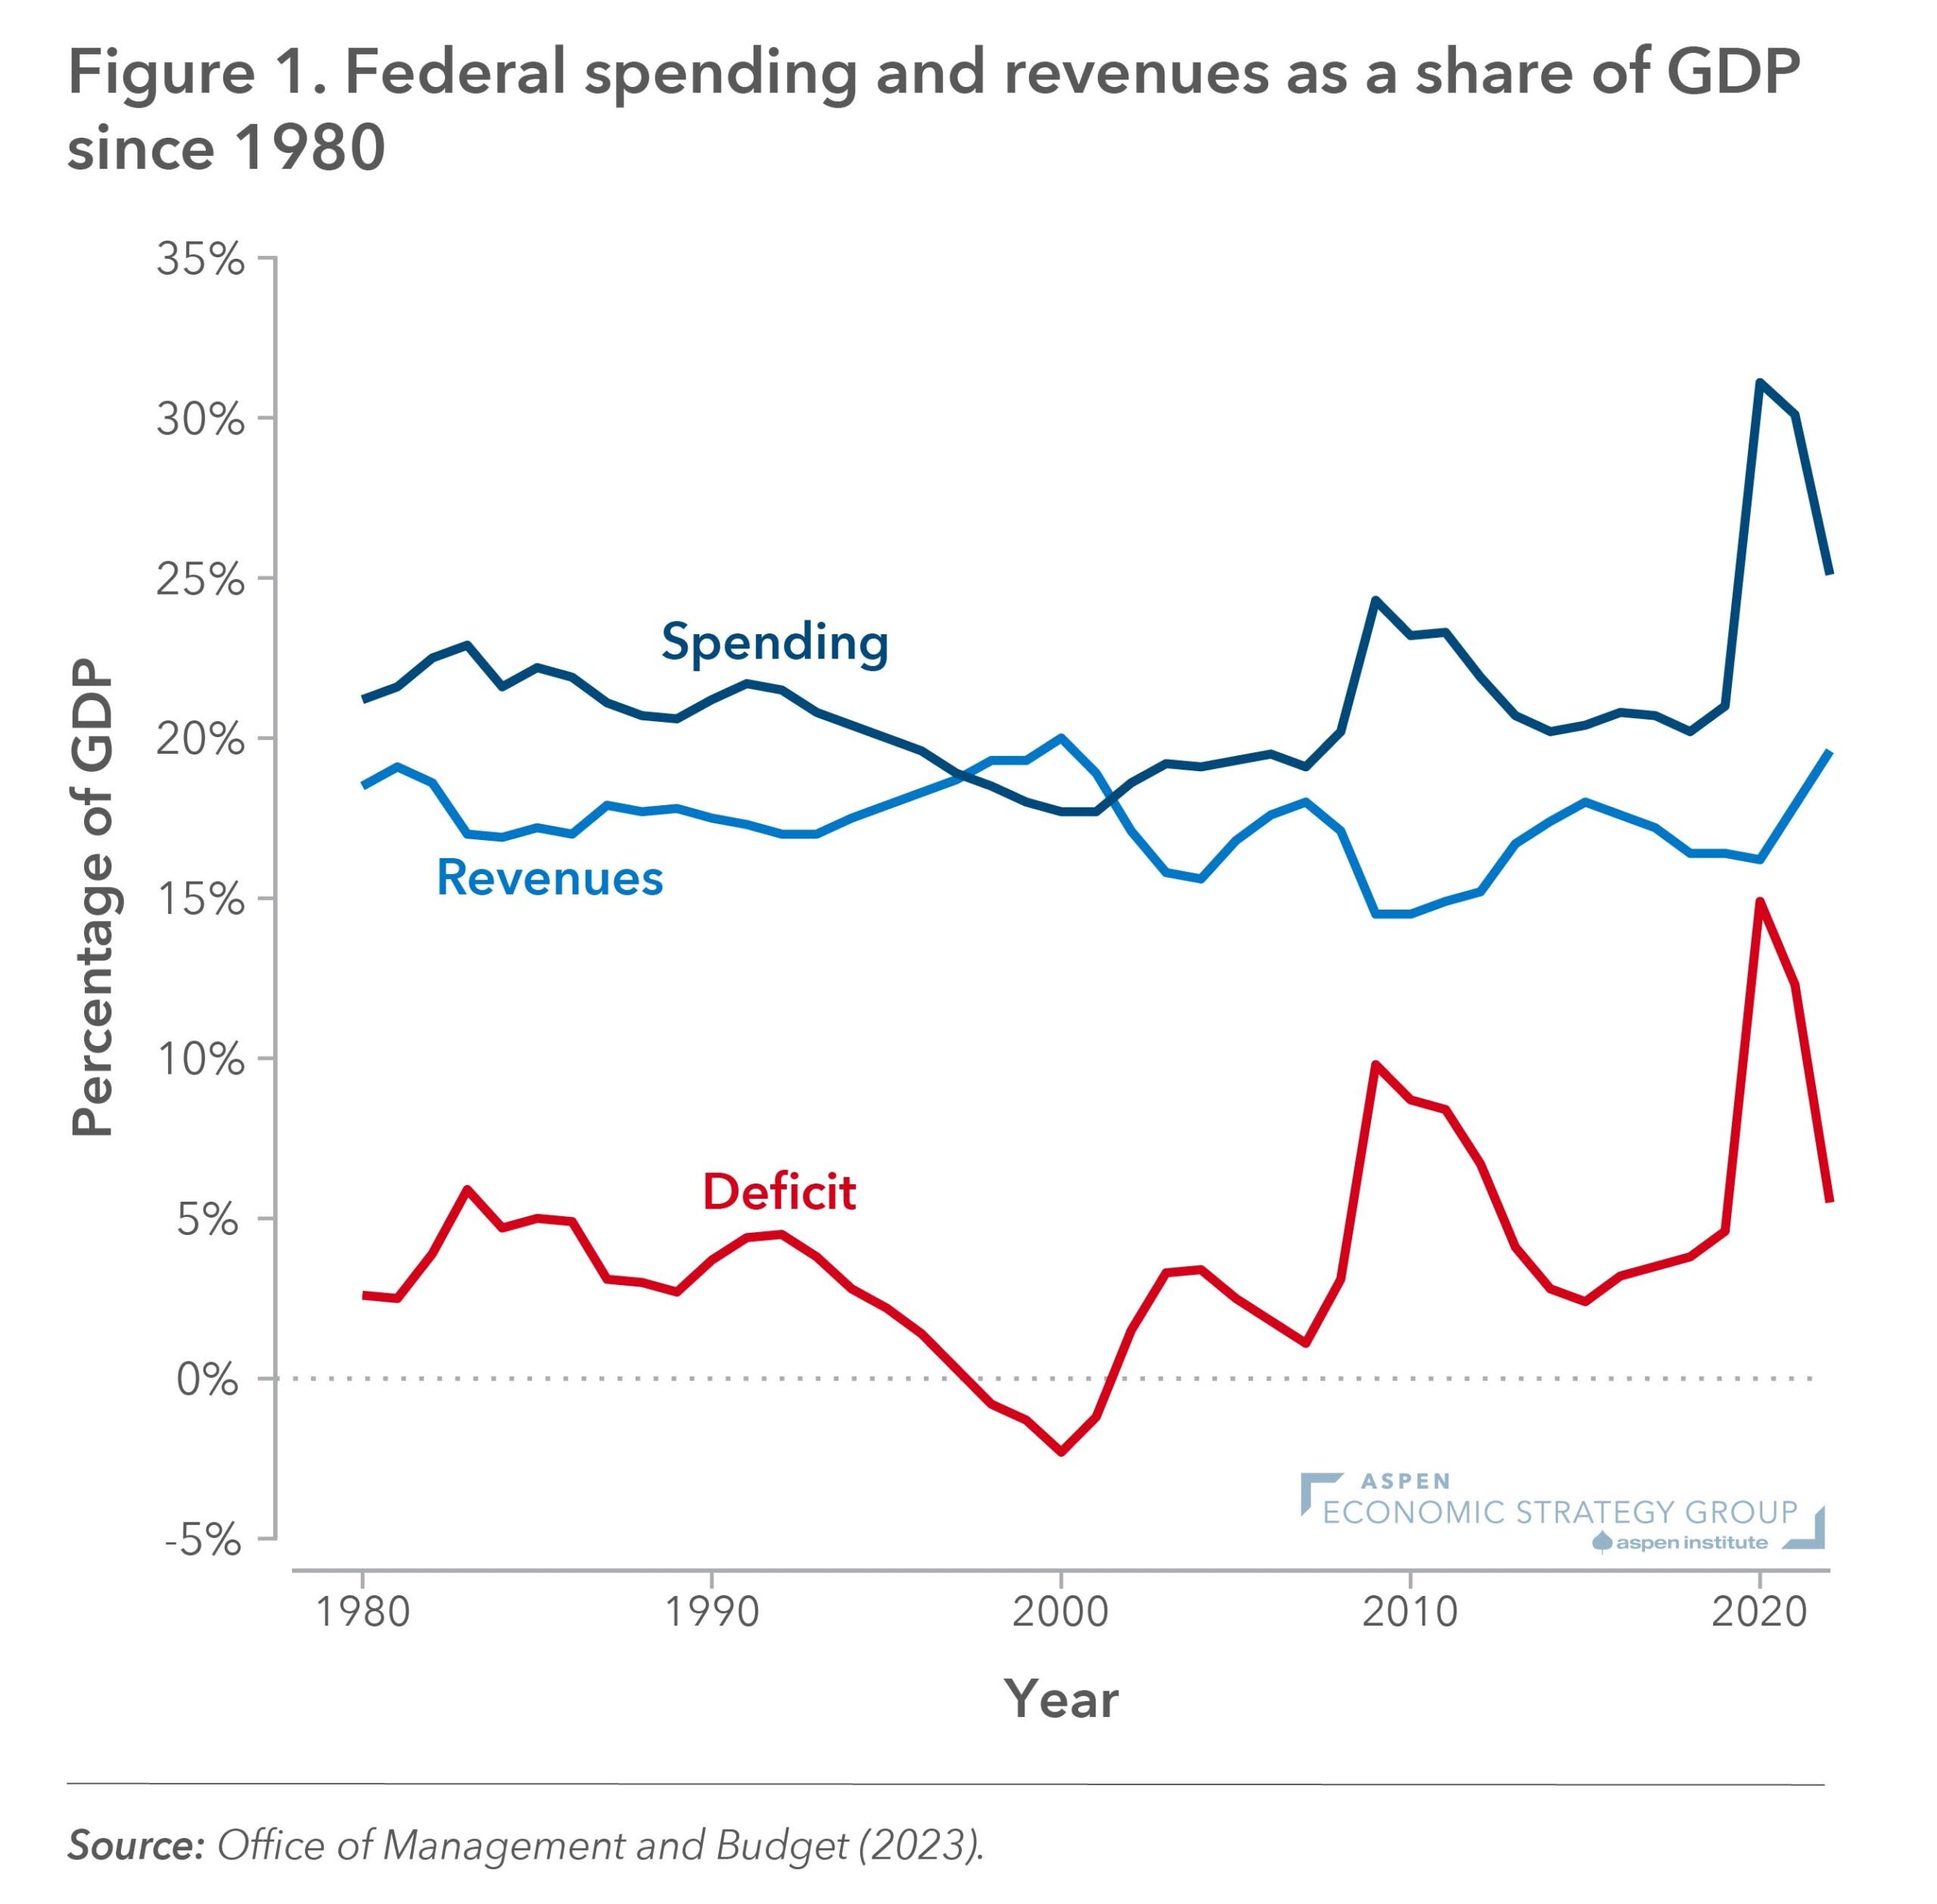
Figure 1: Federal Spending and Revenues as a Share of GDP Since 1980
From, “The Next Business Tax Regime: What Comes After the TCJA,” by Owen Zidar and Eric Zwick
Figure 5: The US Pharmacy Distribution and Reimbursement System for Patient-Administered, Outpatient Brand-Name Drugs
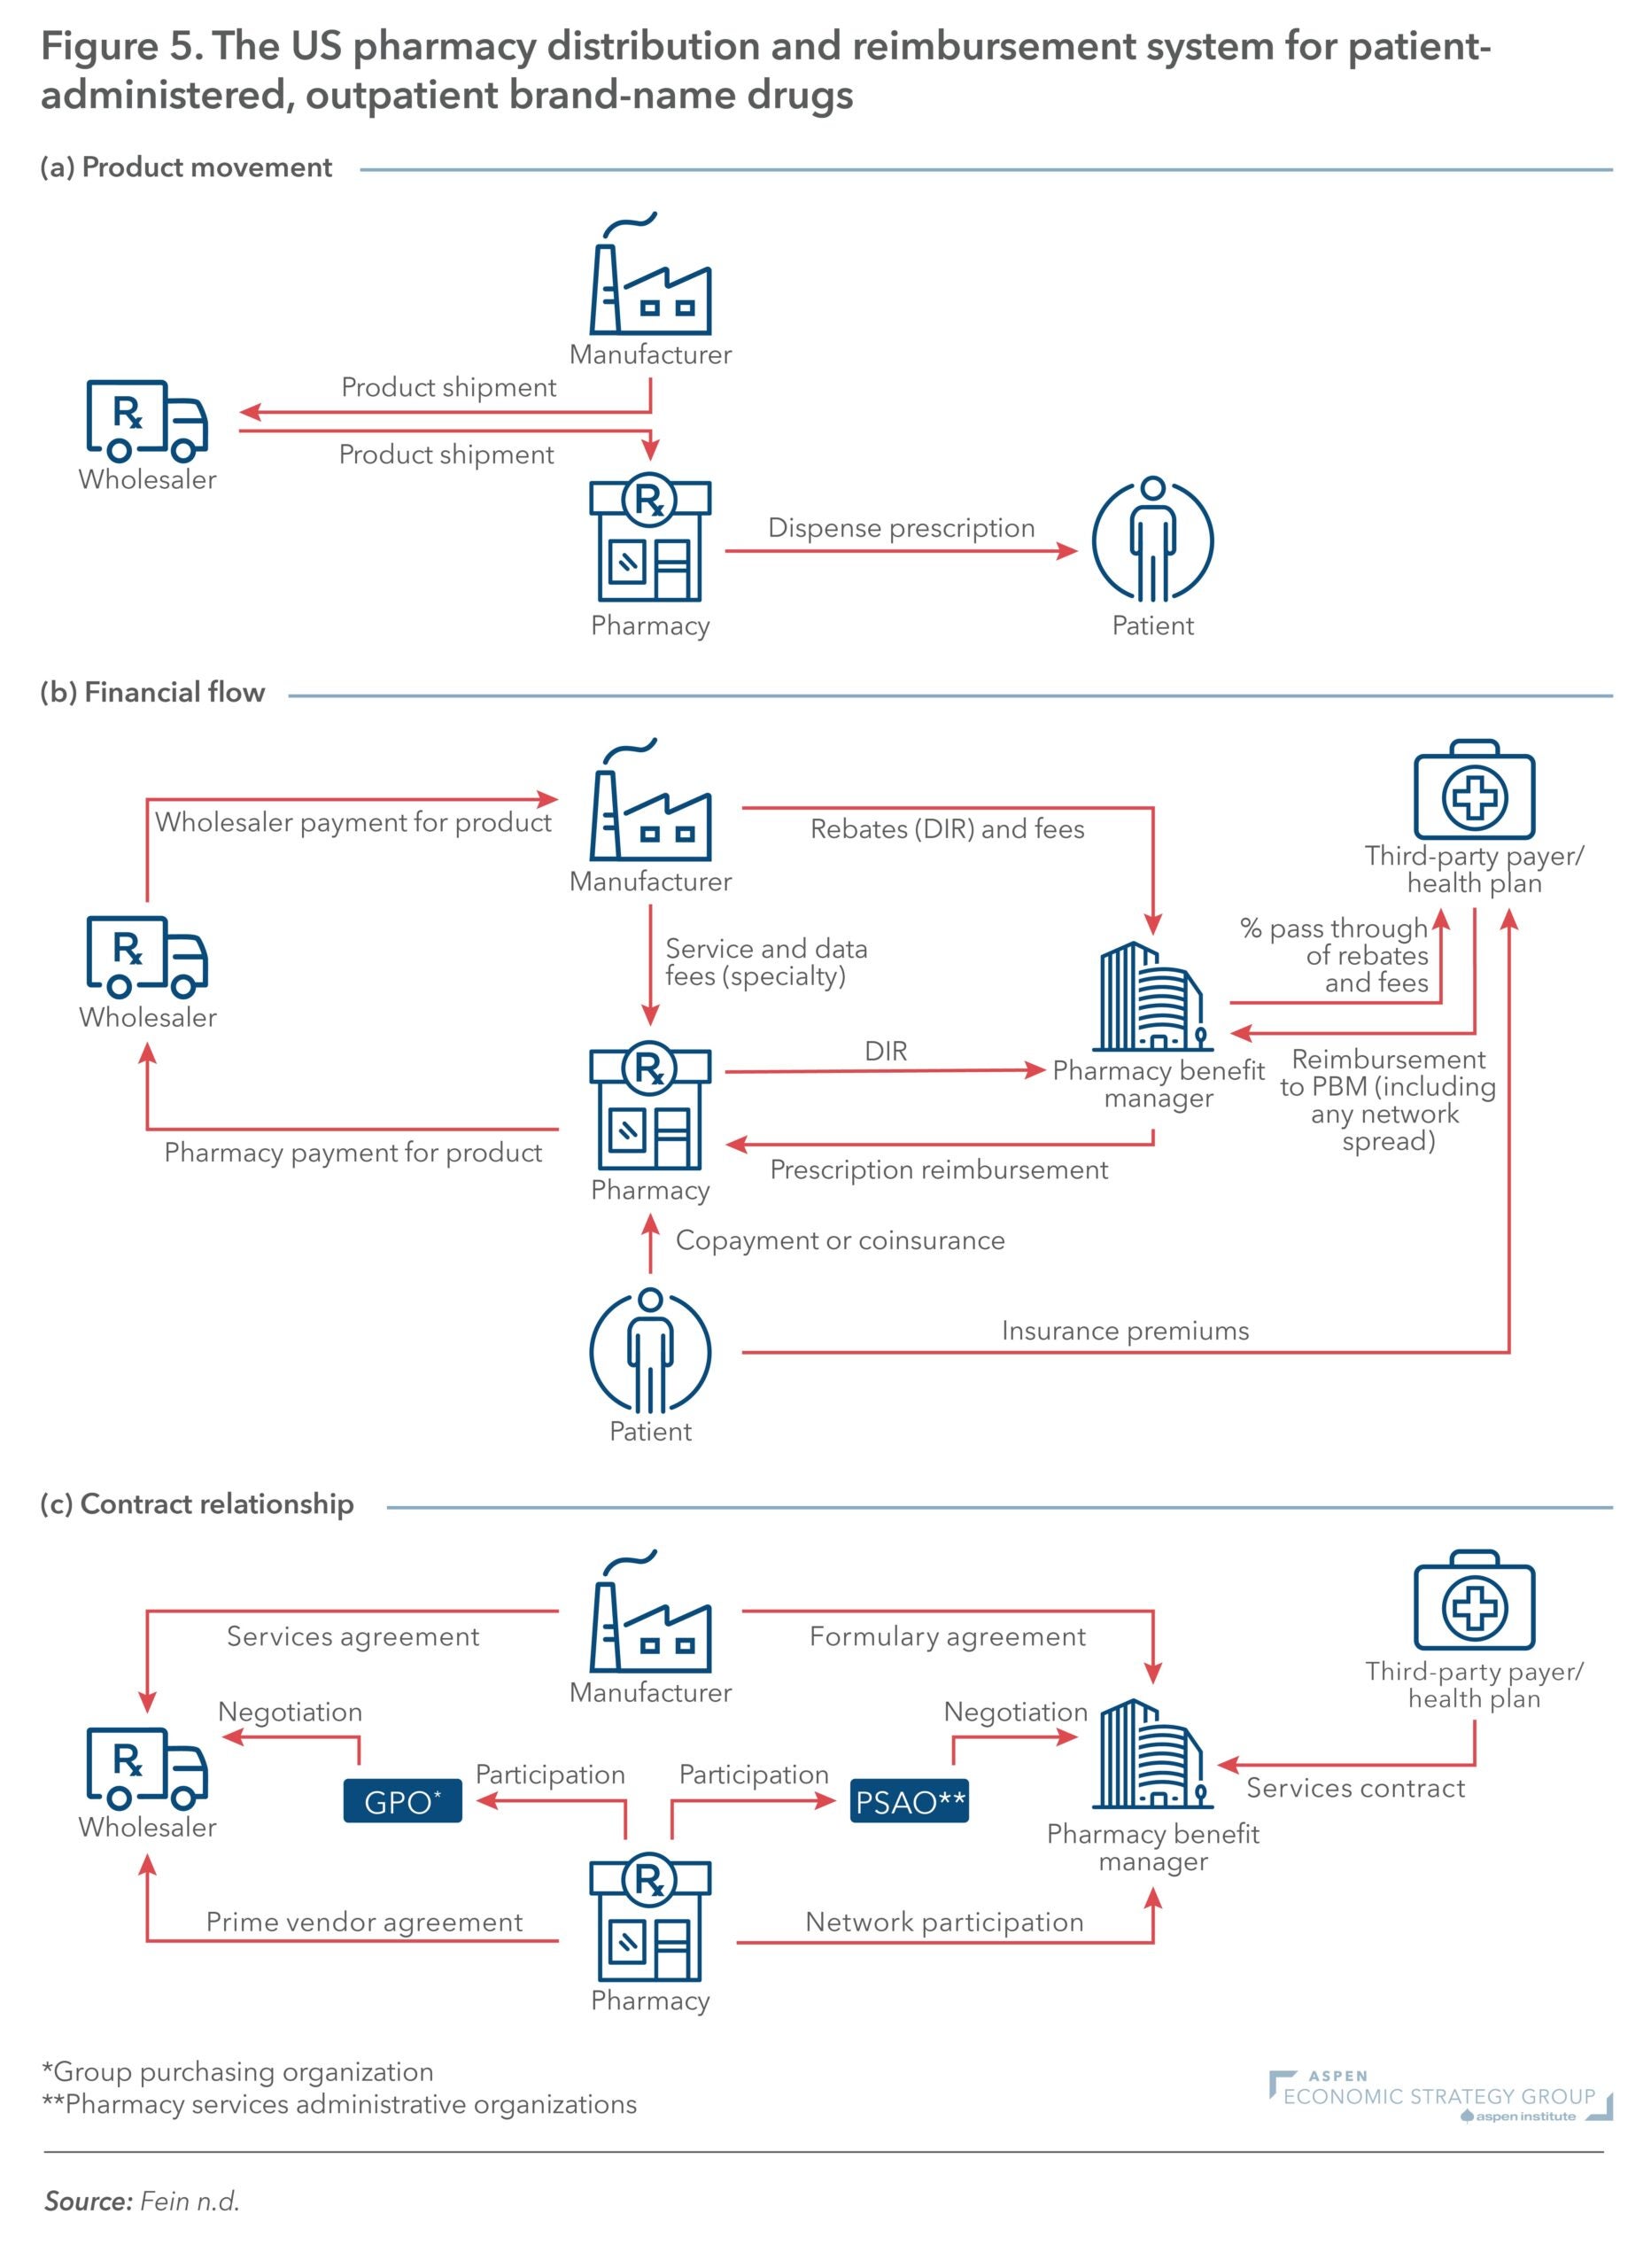
Figure 6B: Fraction of the Chinese Economy Occupied by SOEs, by Government Investment Level
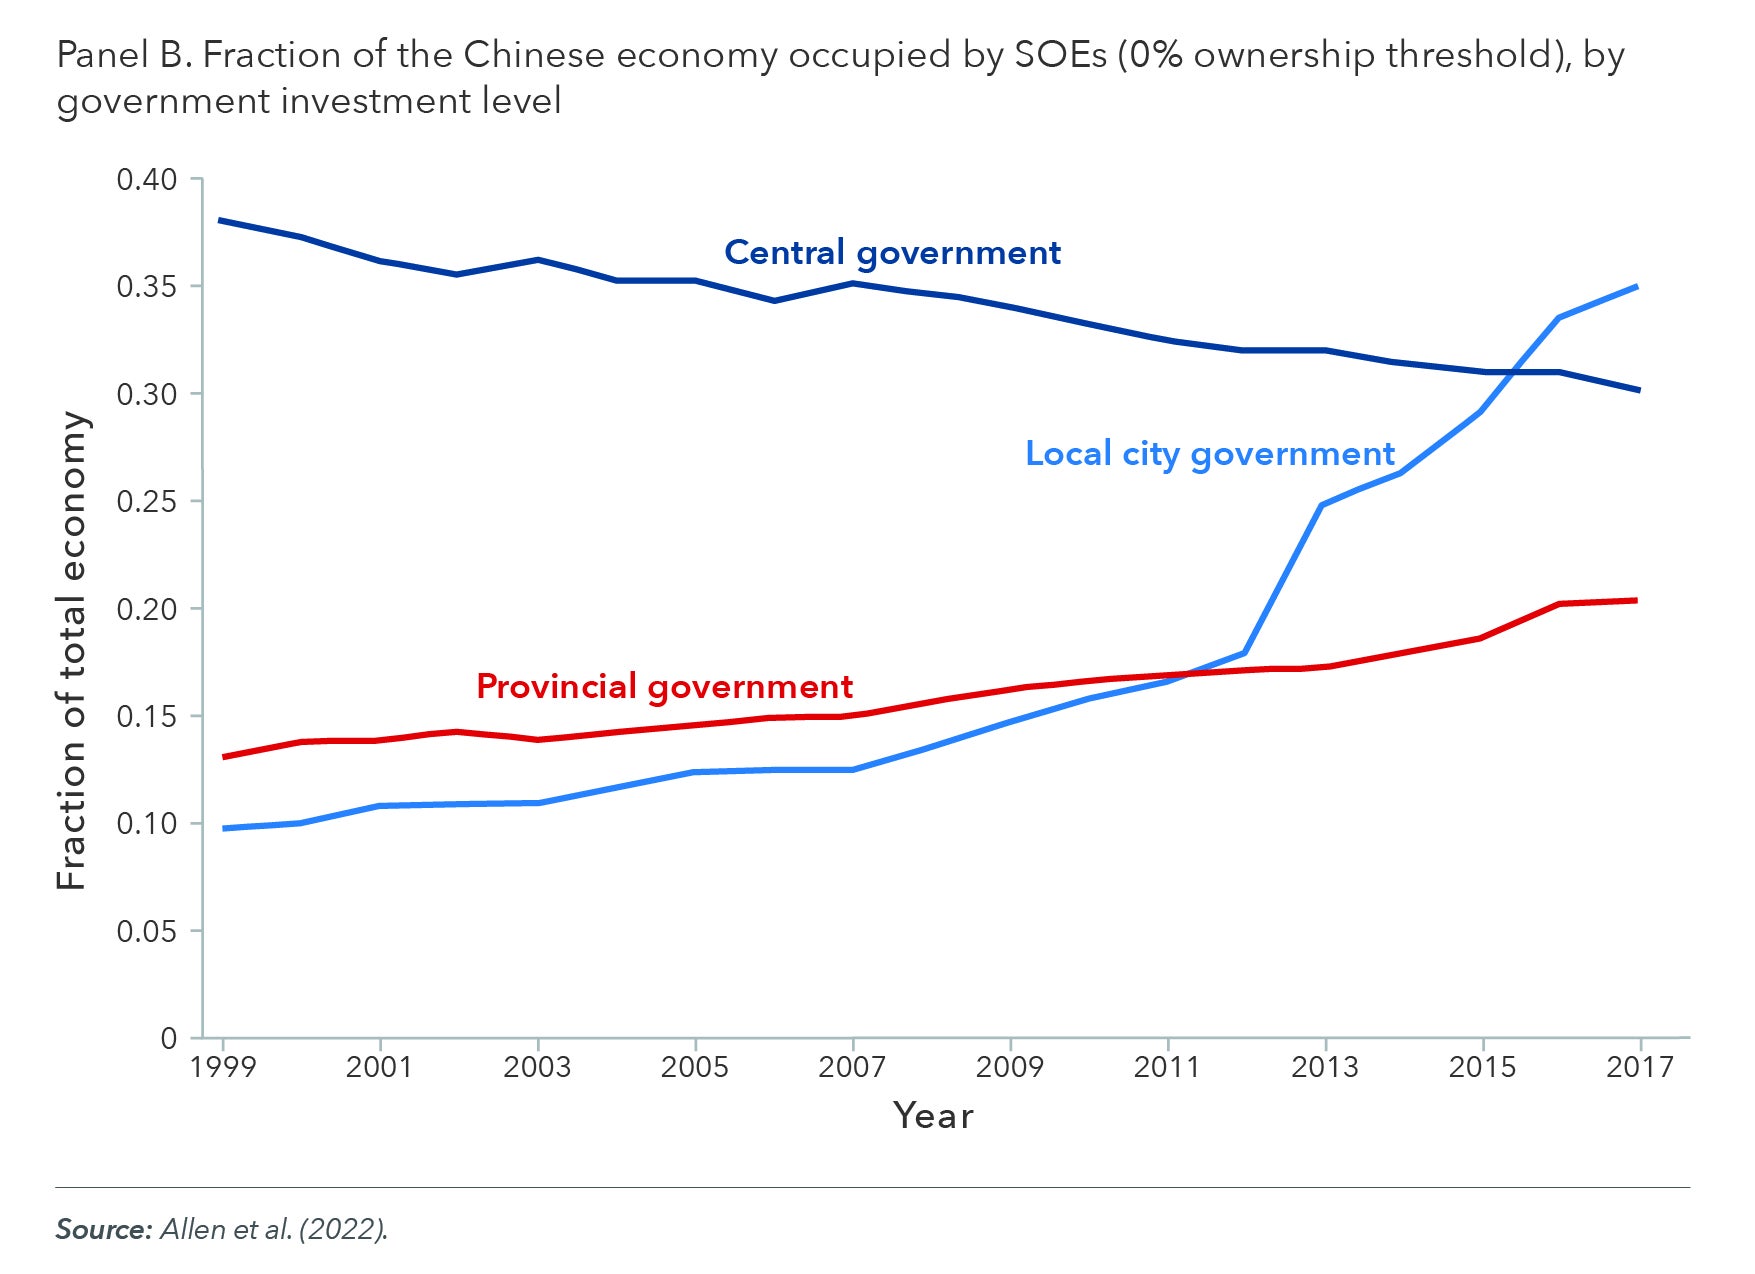
Figure 6: MVPF vs. Per Capita Spending, by Age
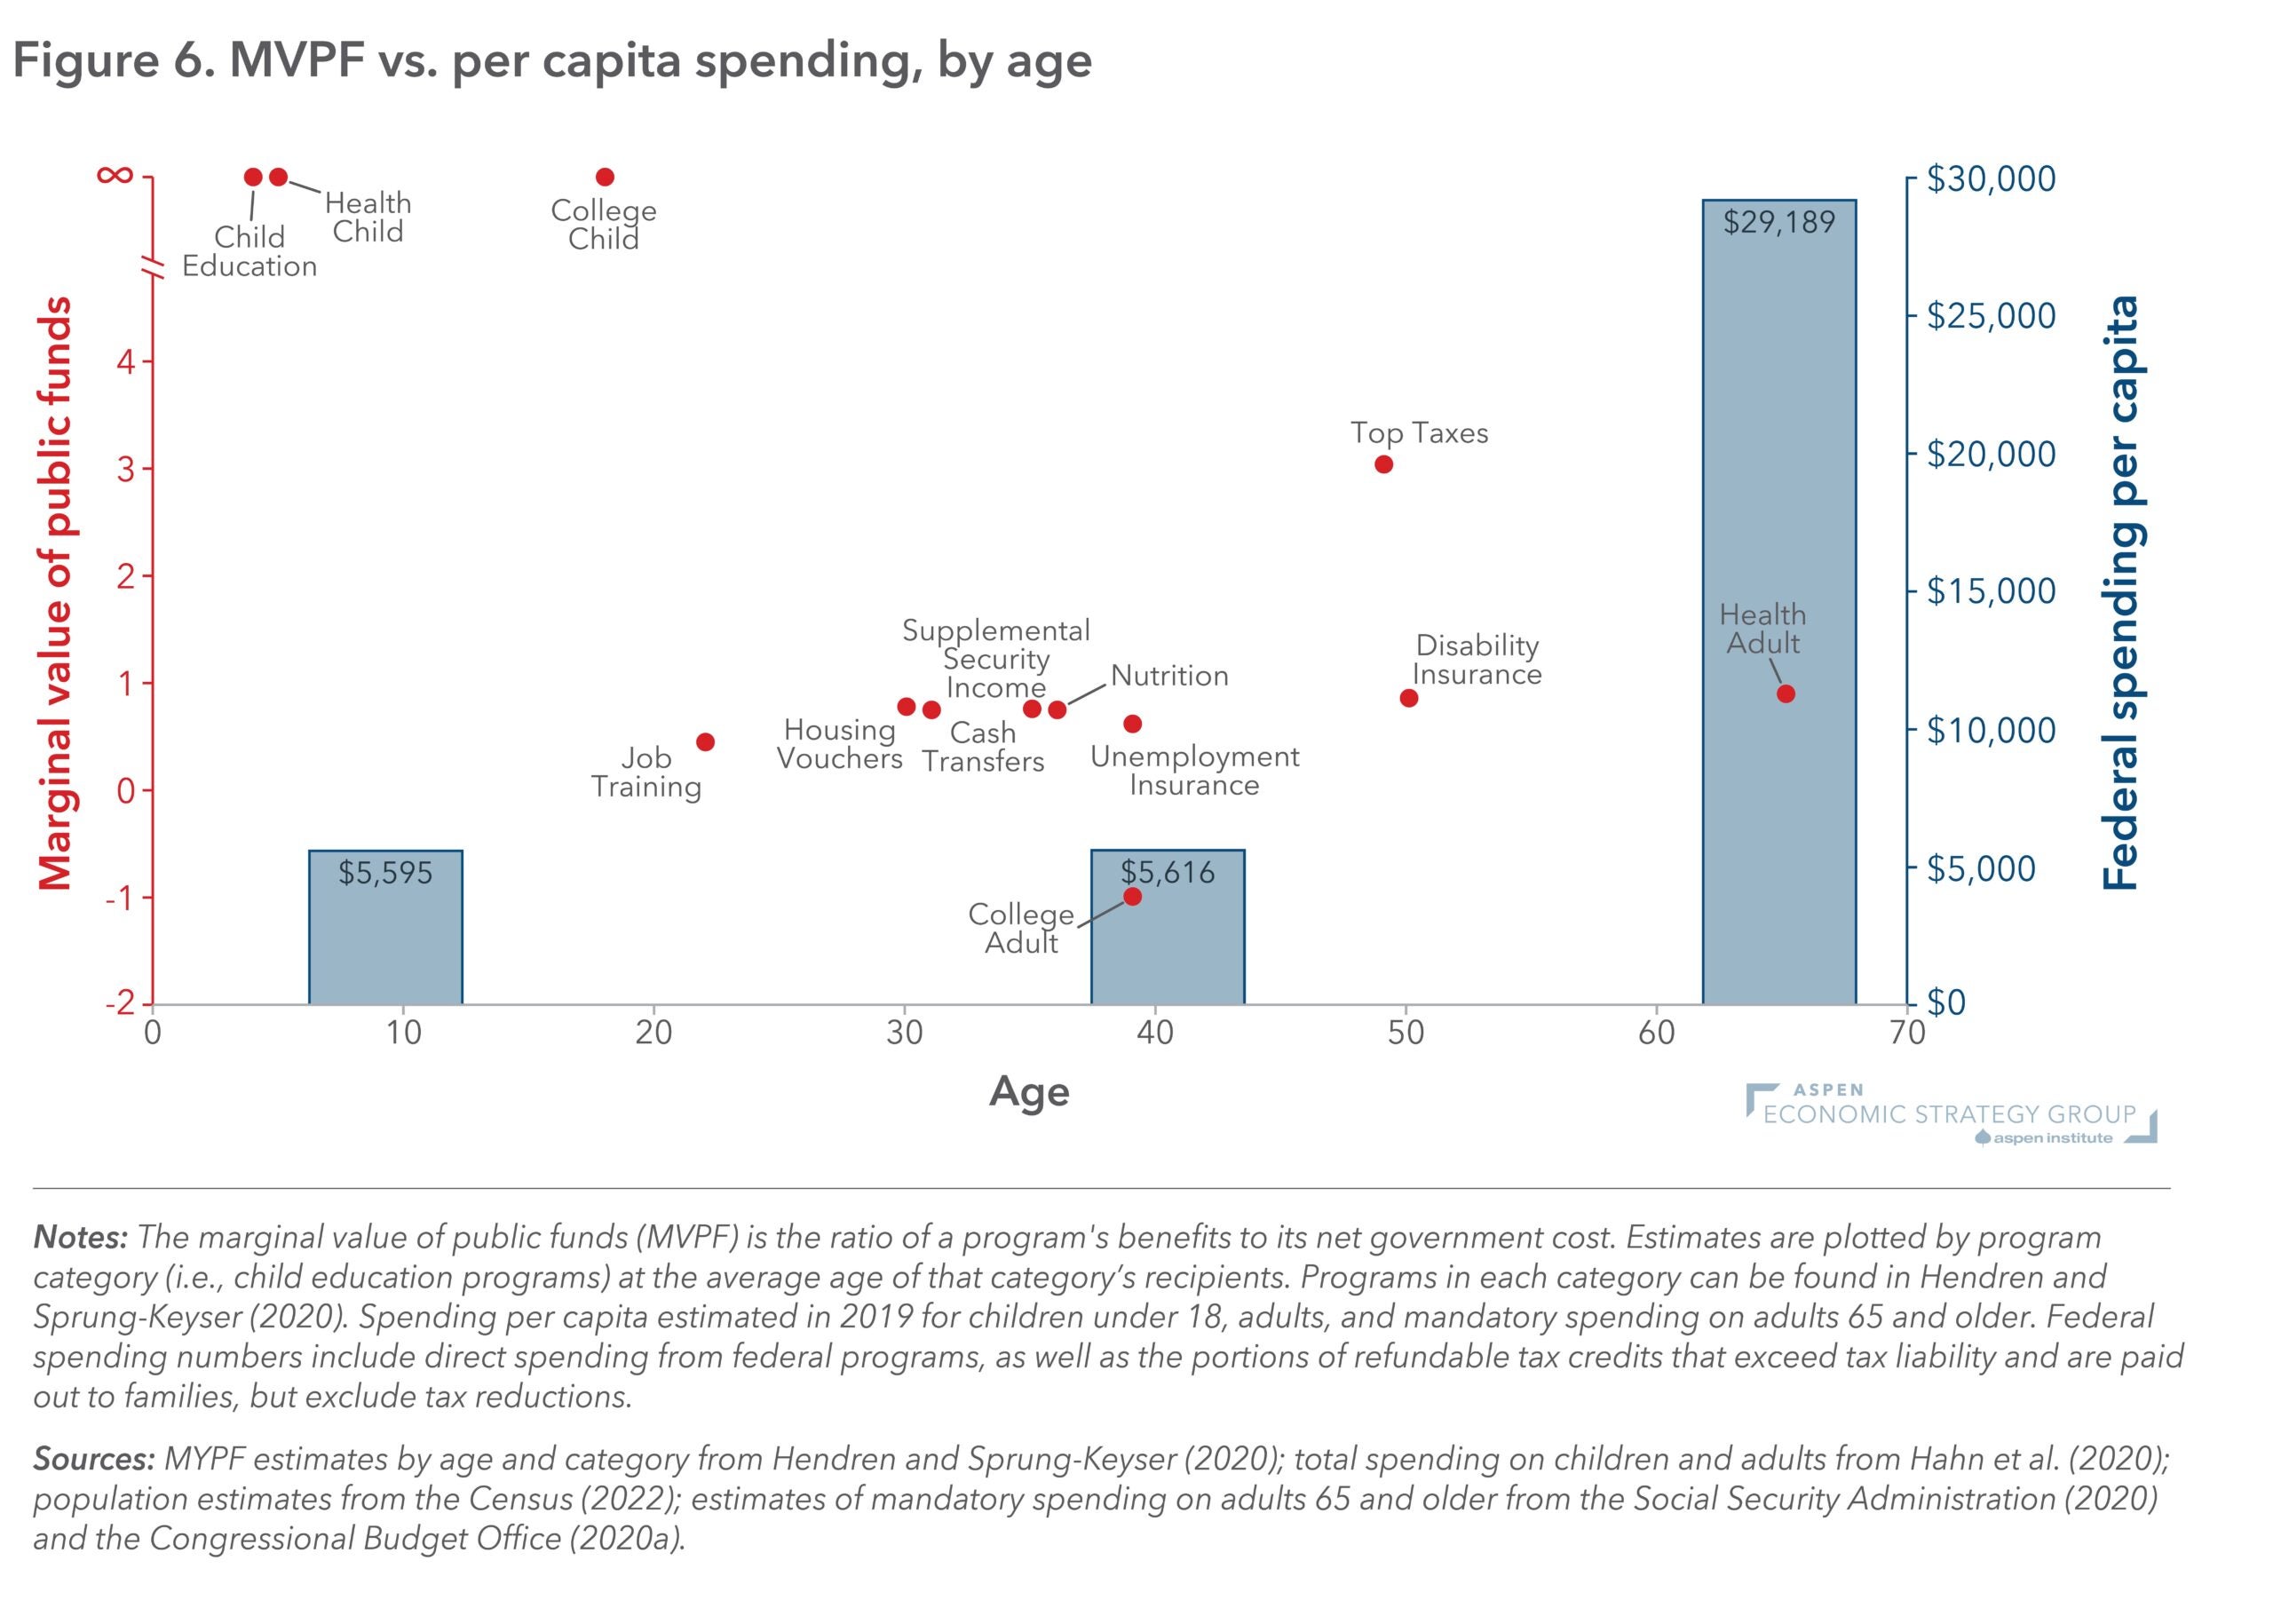
Figure 6A: Presence of State Capital in the Chinese Economy
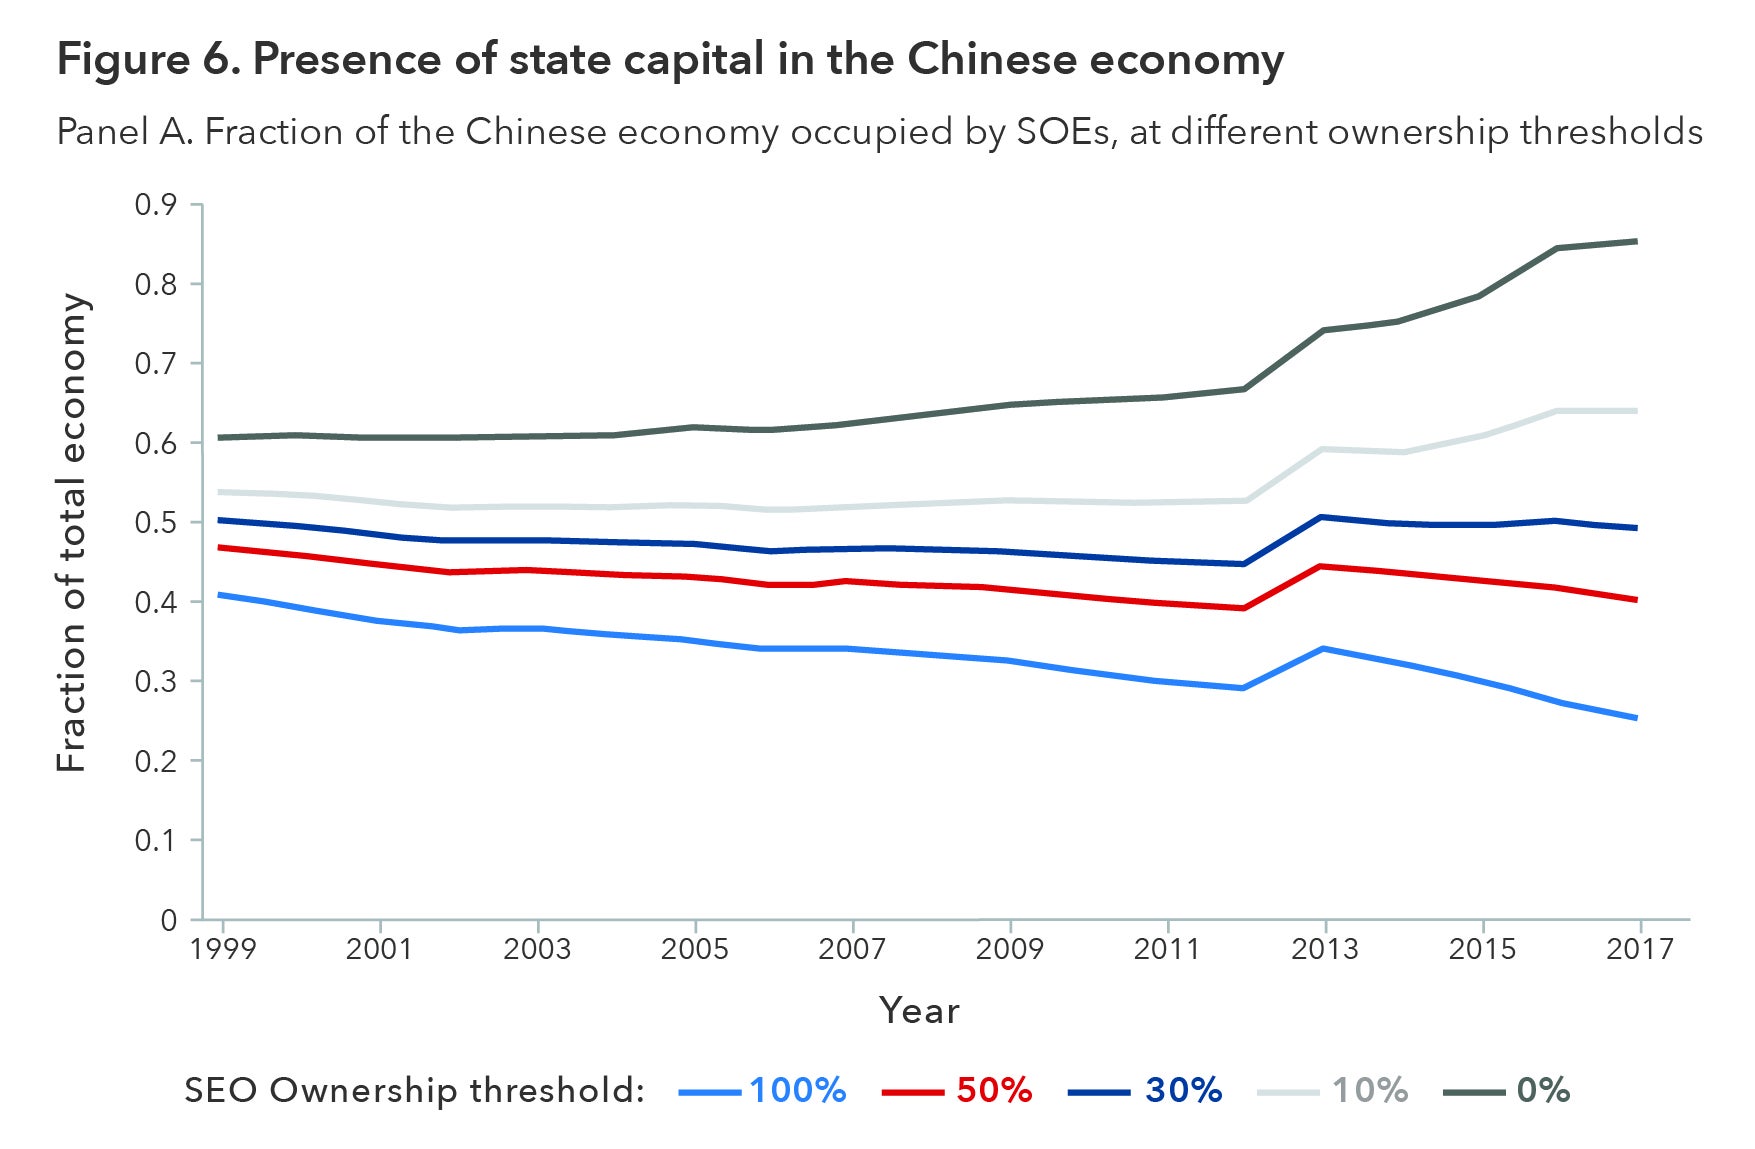
Figure 3: Annual FDA Drug Approvals by Product Type, 1998-2020
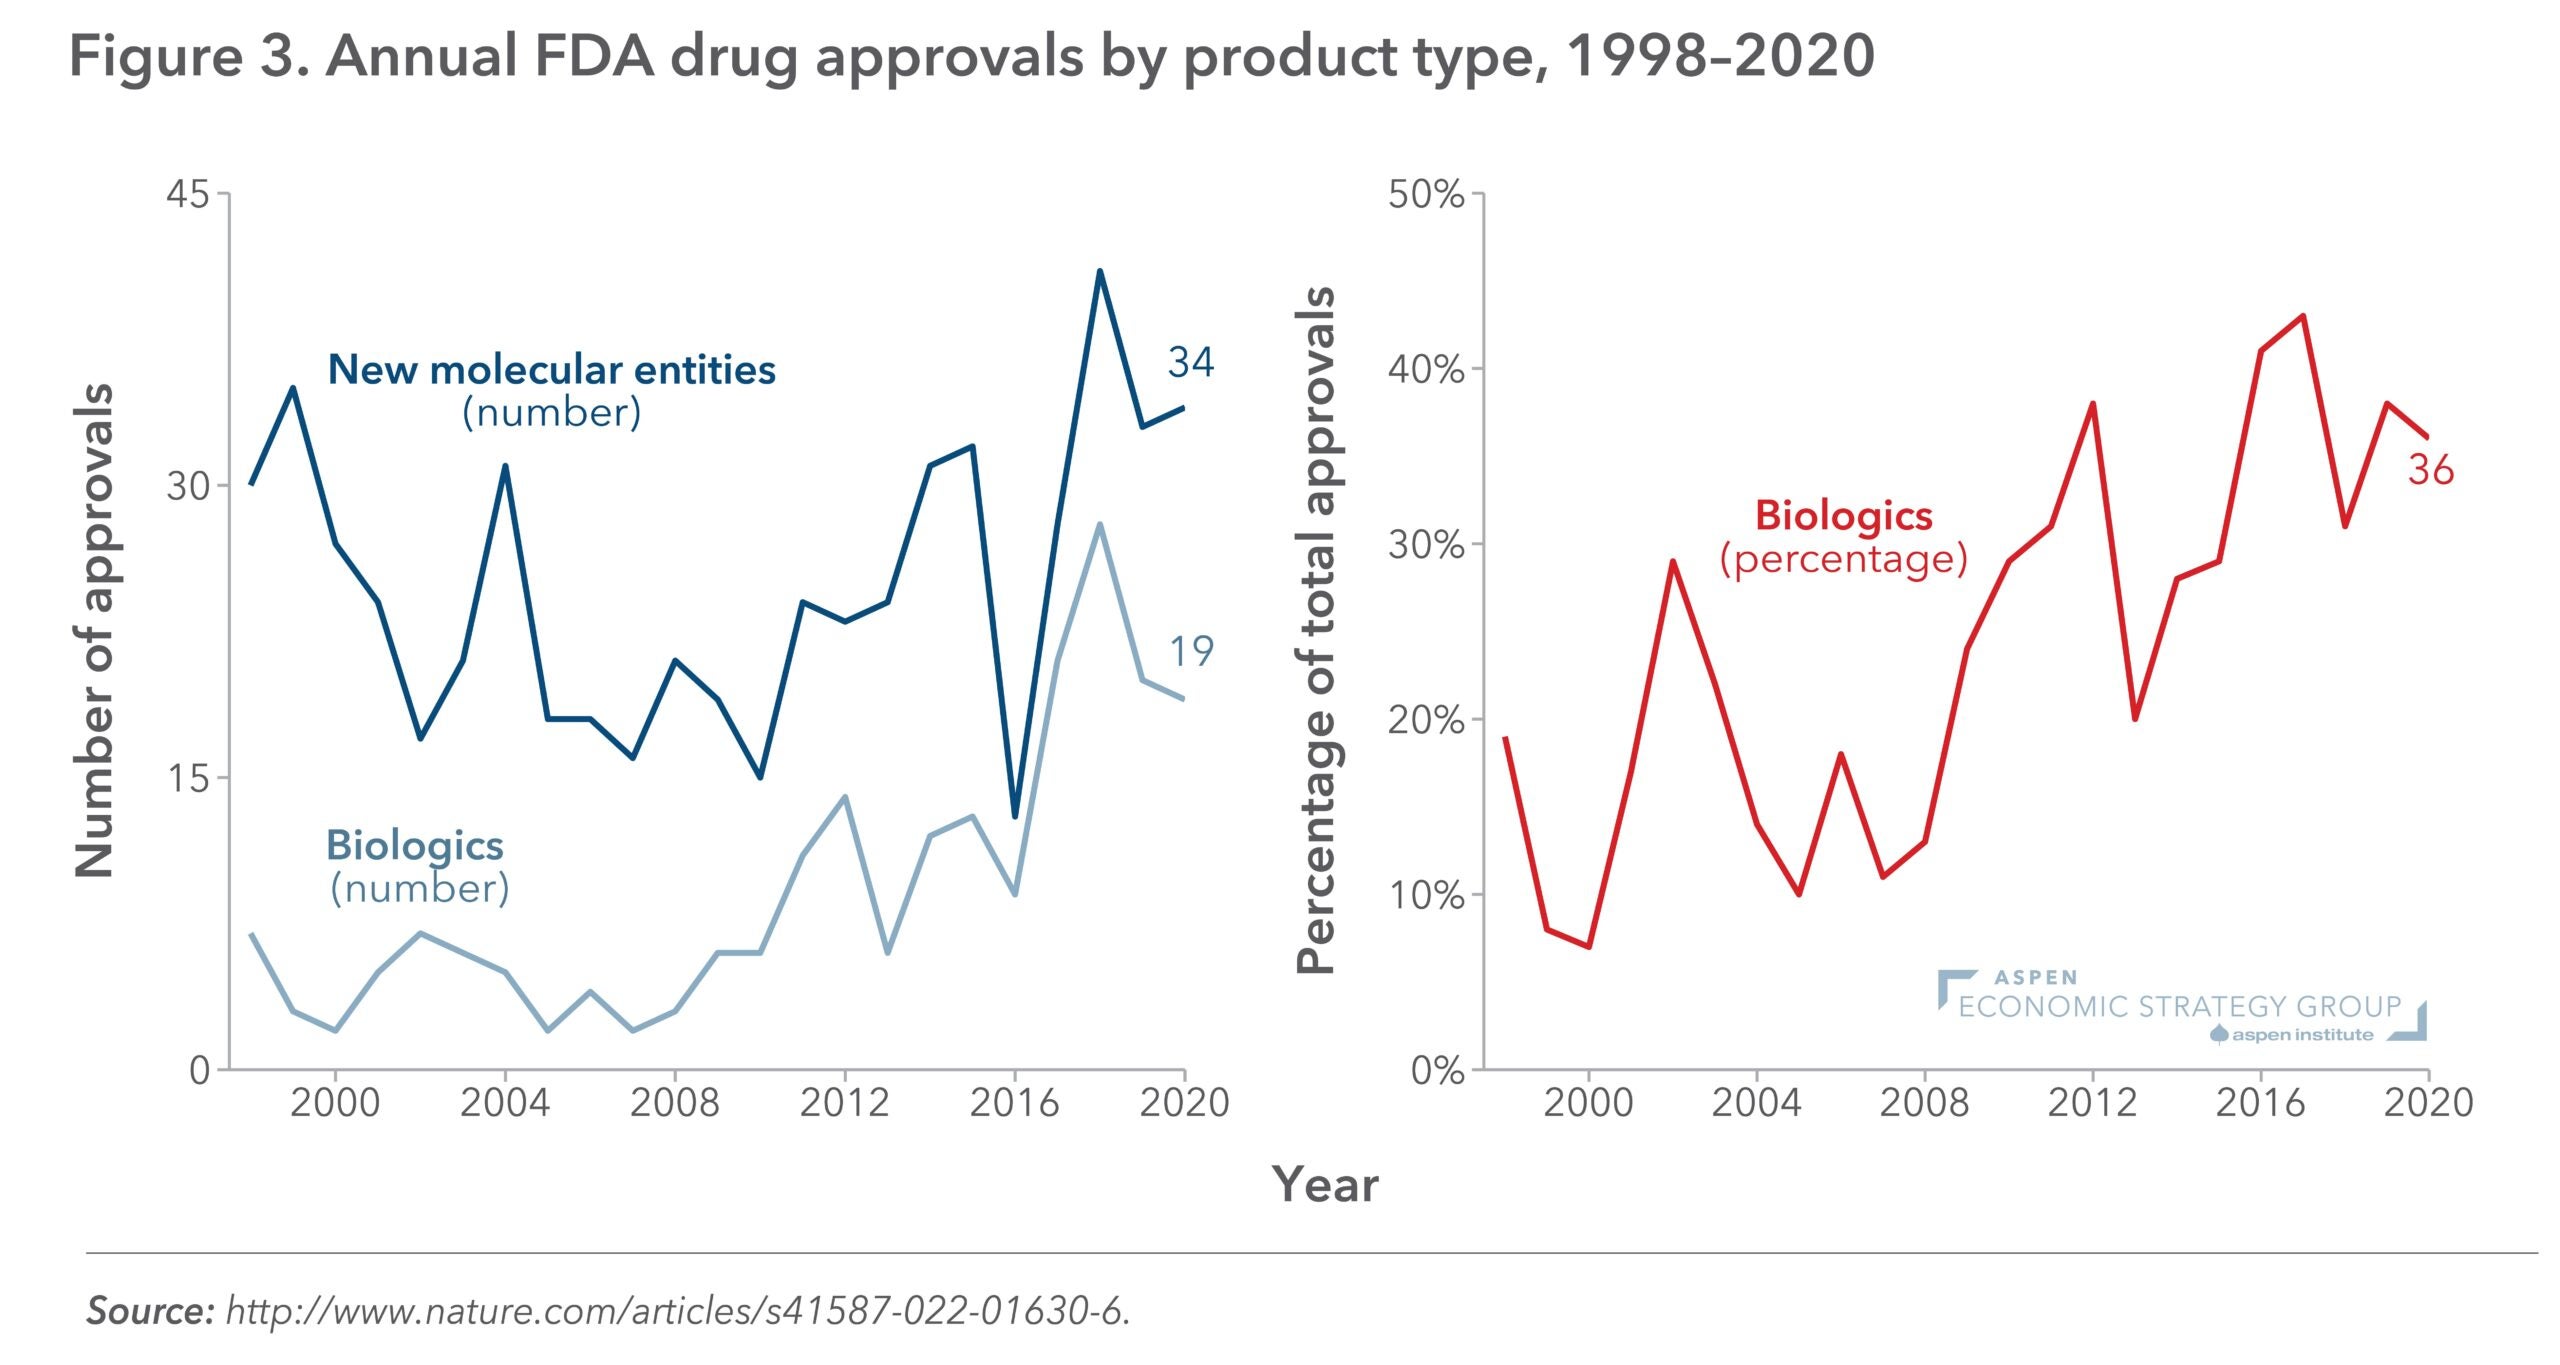
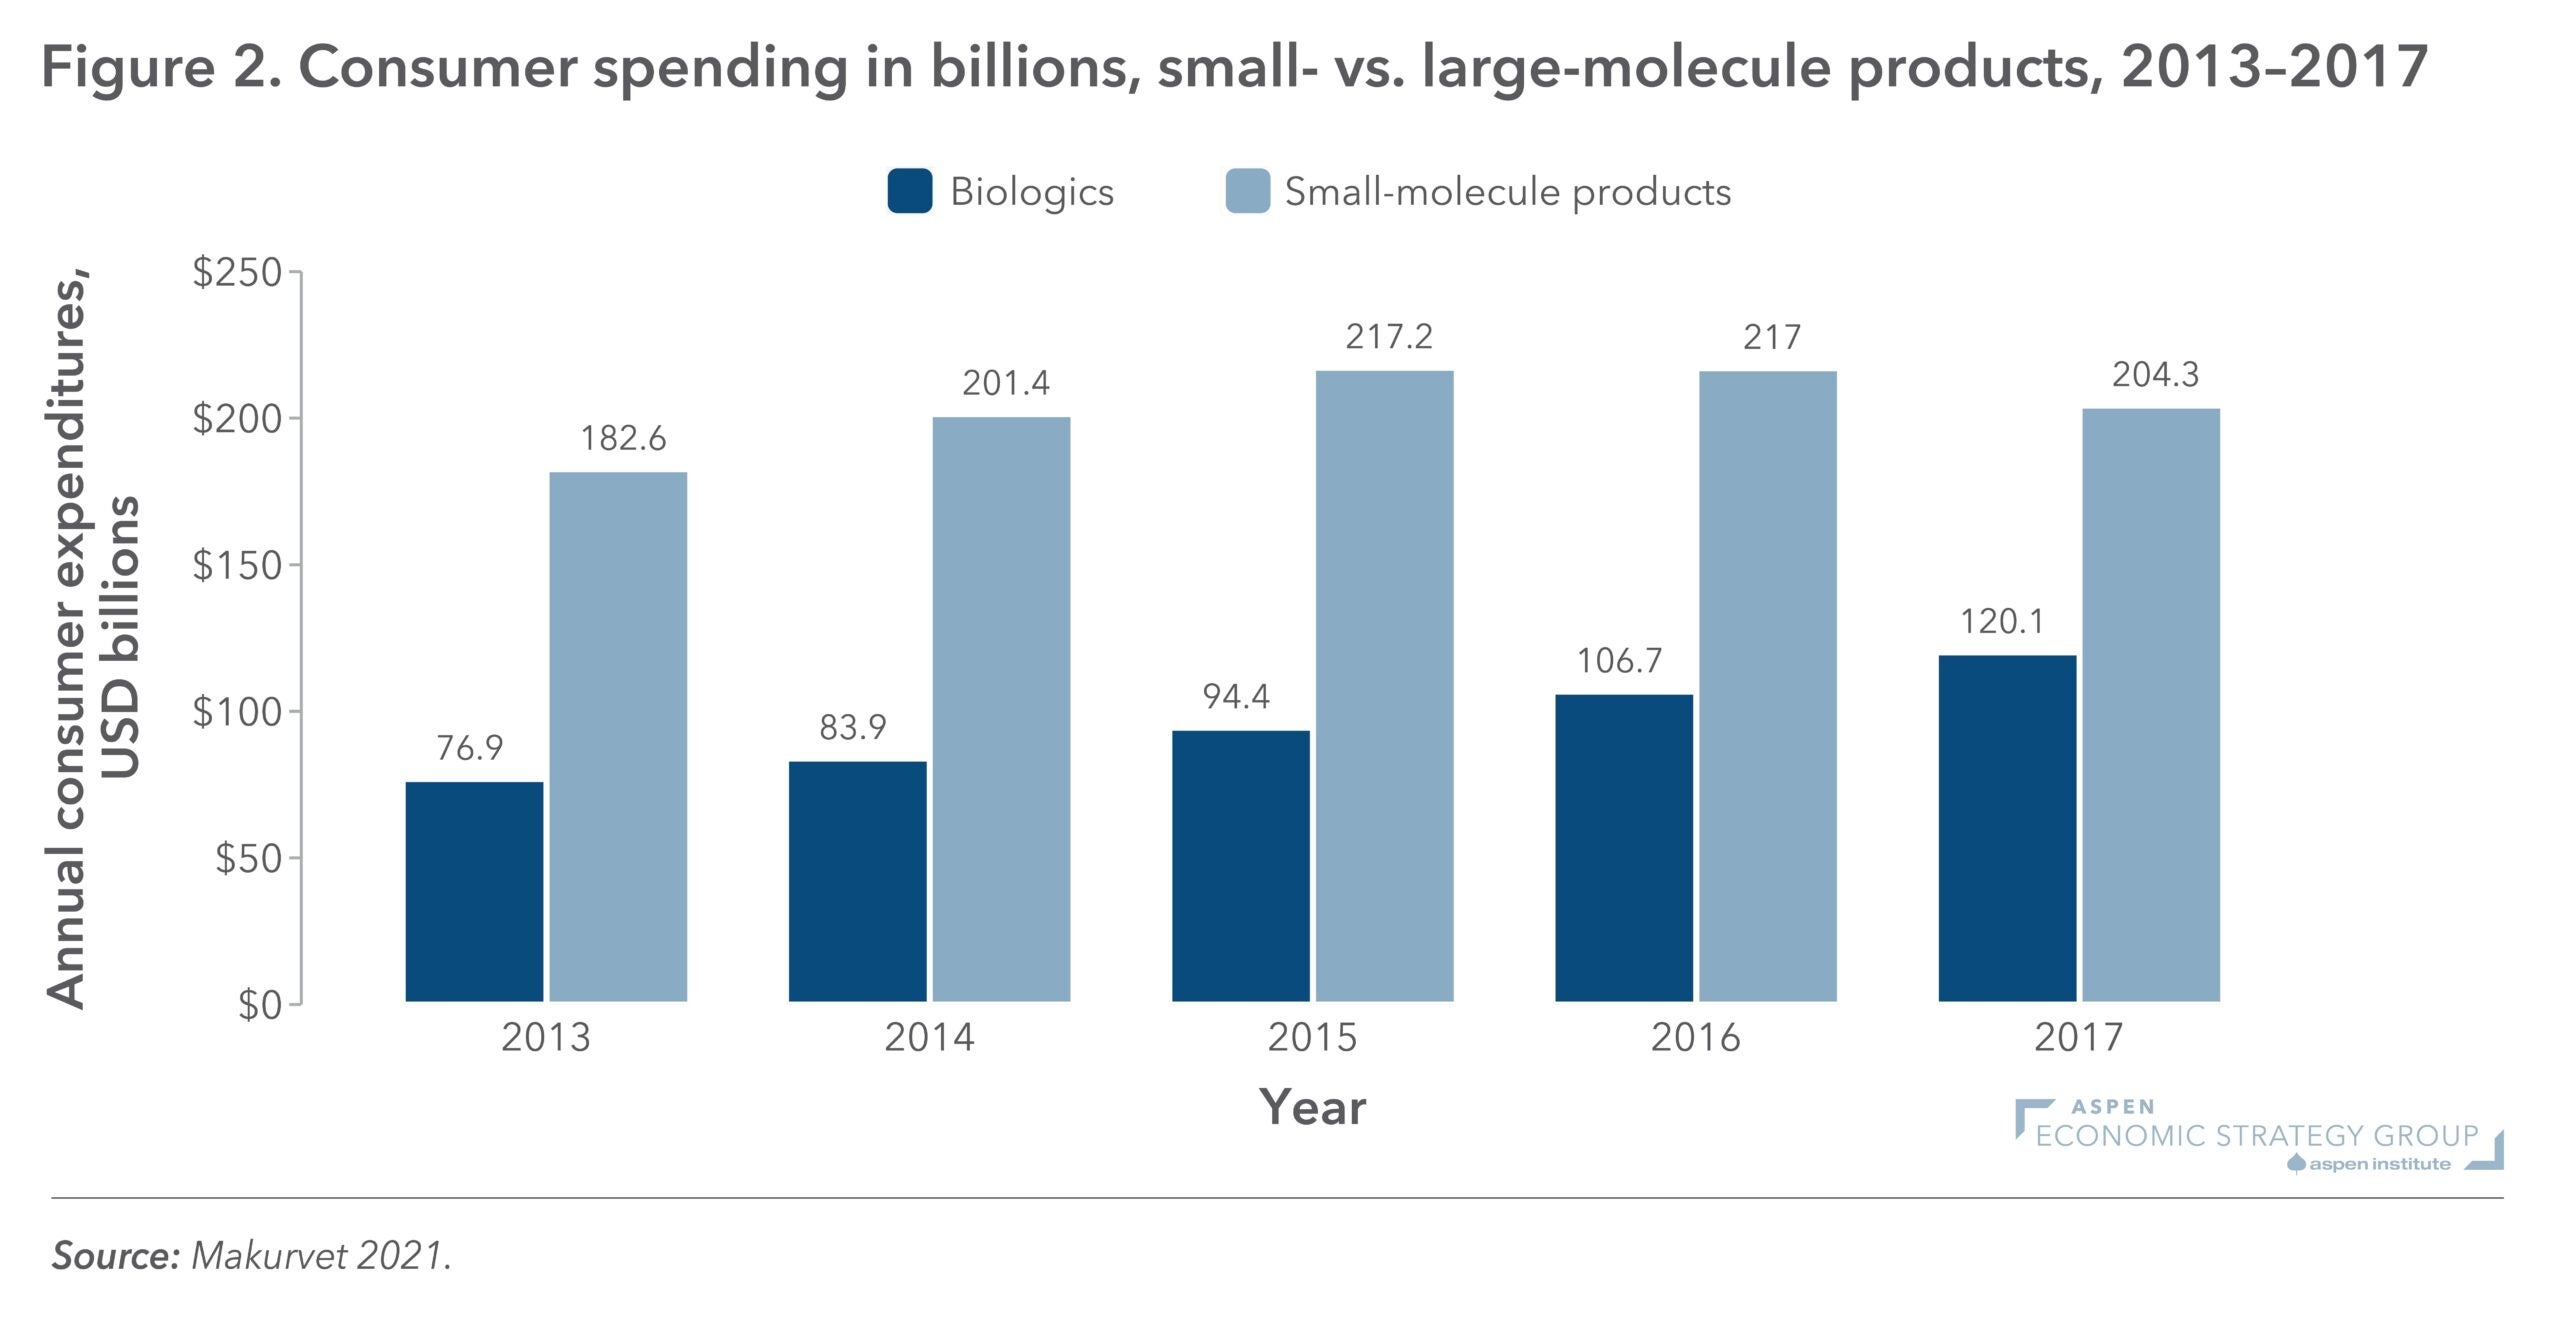
Figure 2: Consumer Spending in Billions, Small vs. Large-Molecule Products, 2013-2017