Archives: Publications
These are AIESG Publications
Figure 12: Share of Medicare Part D Drug Costs Paid by Enrollees, Plans, Drug Manufacturers, and Medicare, 2023-2025

Figure 4: Parsing the change in the federal deficit, 2024-2053
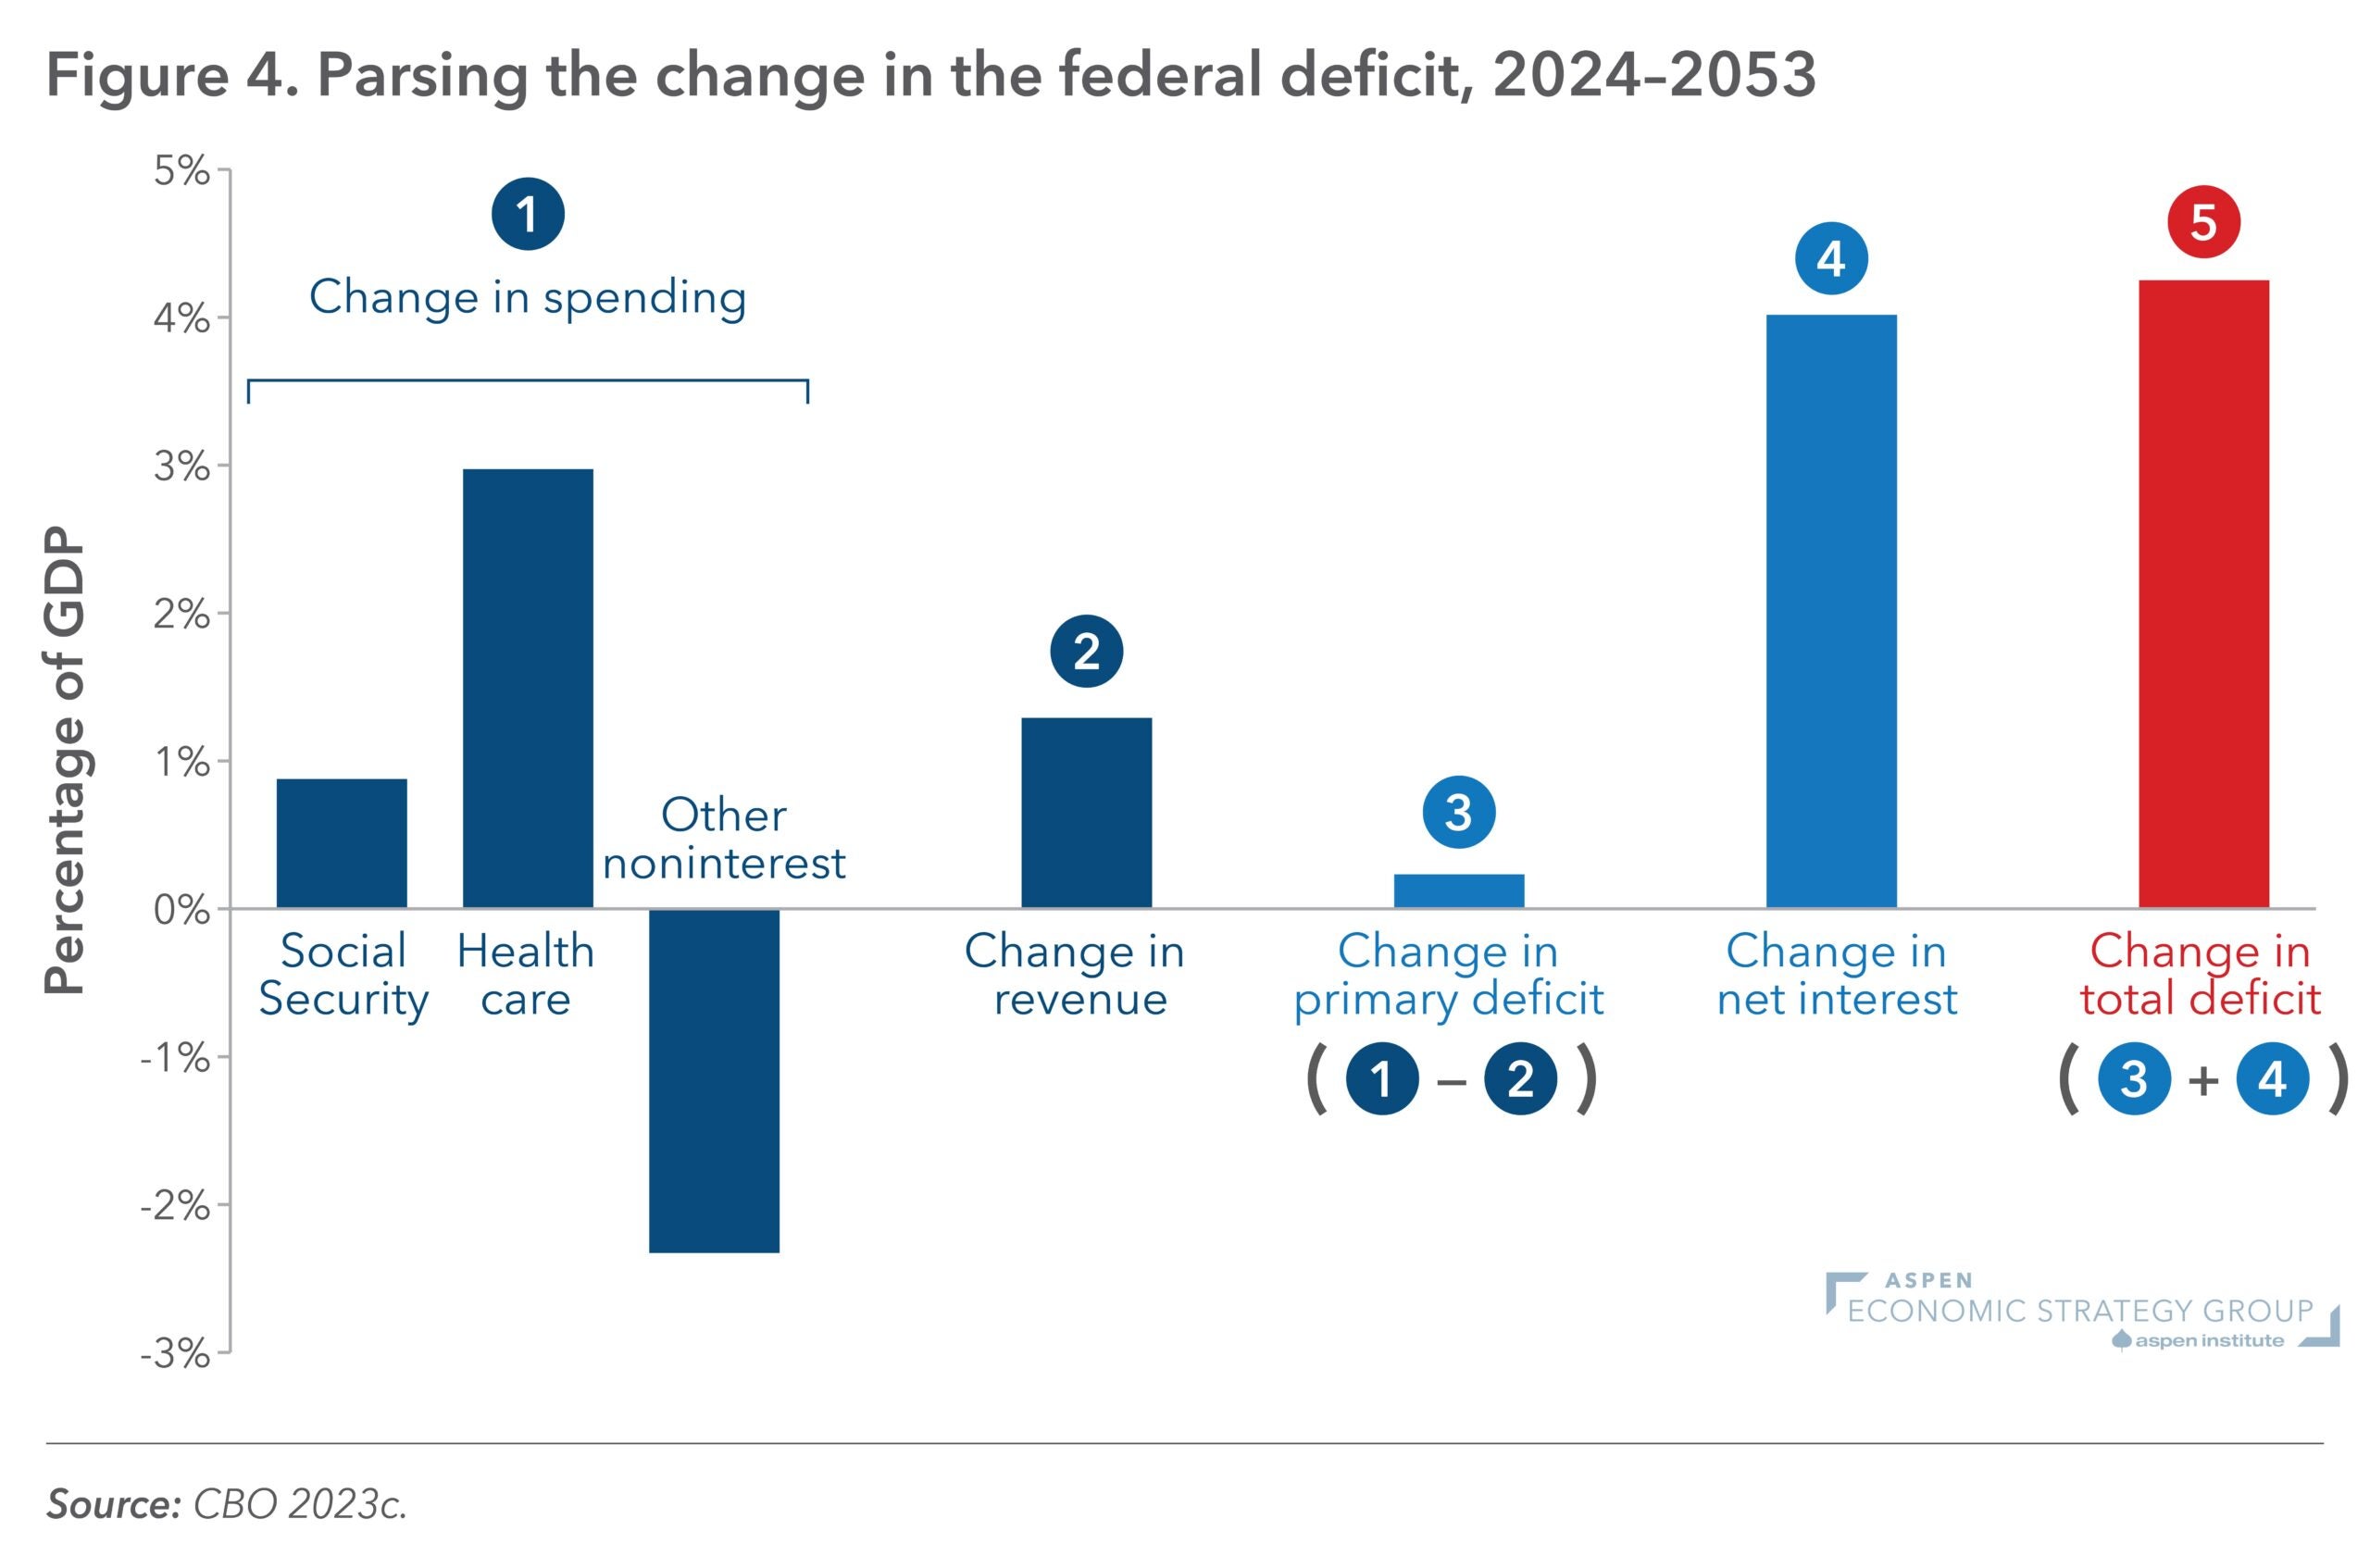
Figure 2: Ratio of covered workers to Social Security beneficiaries
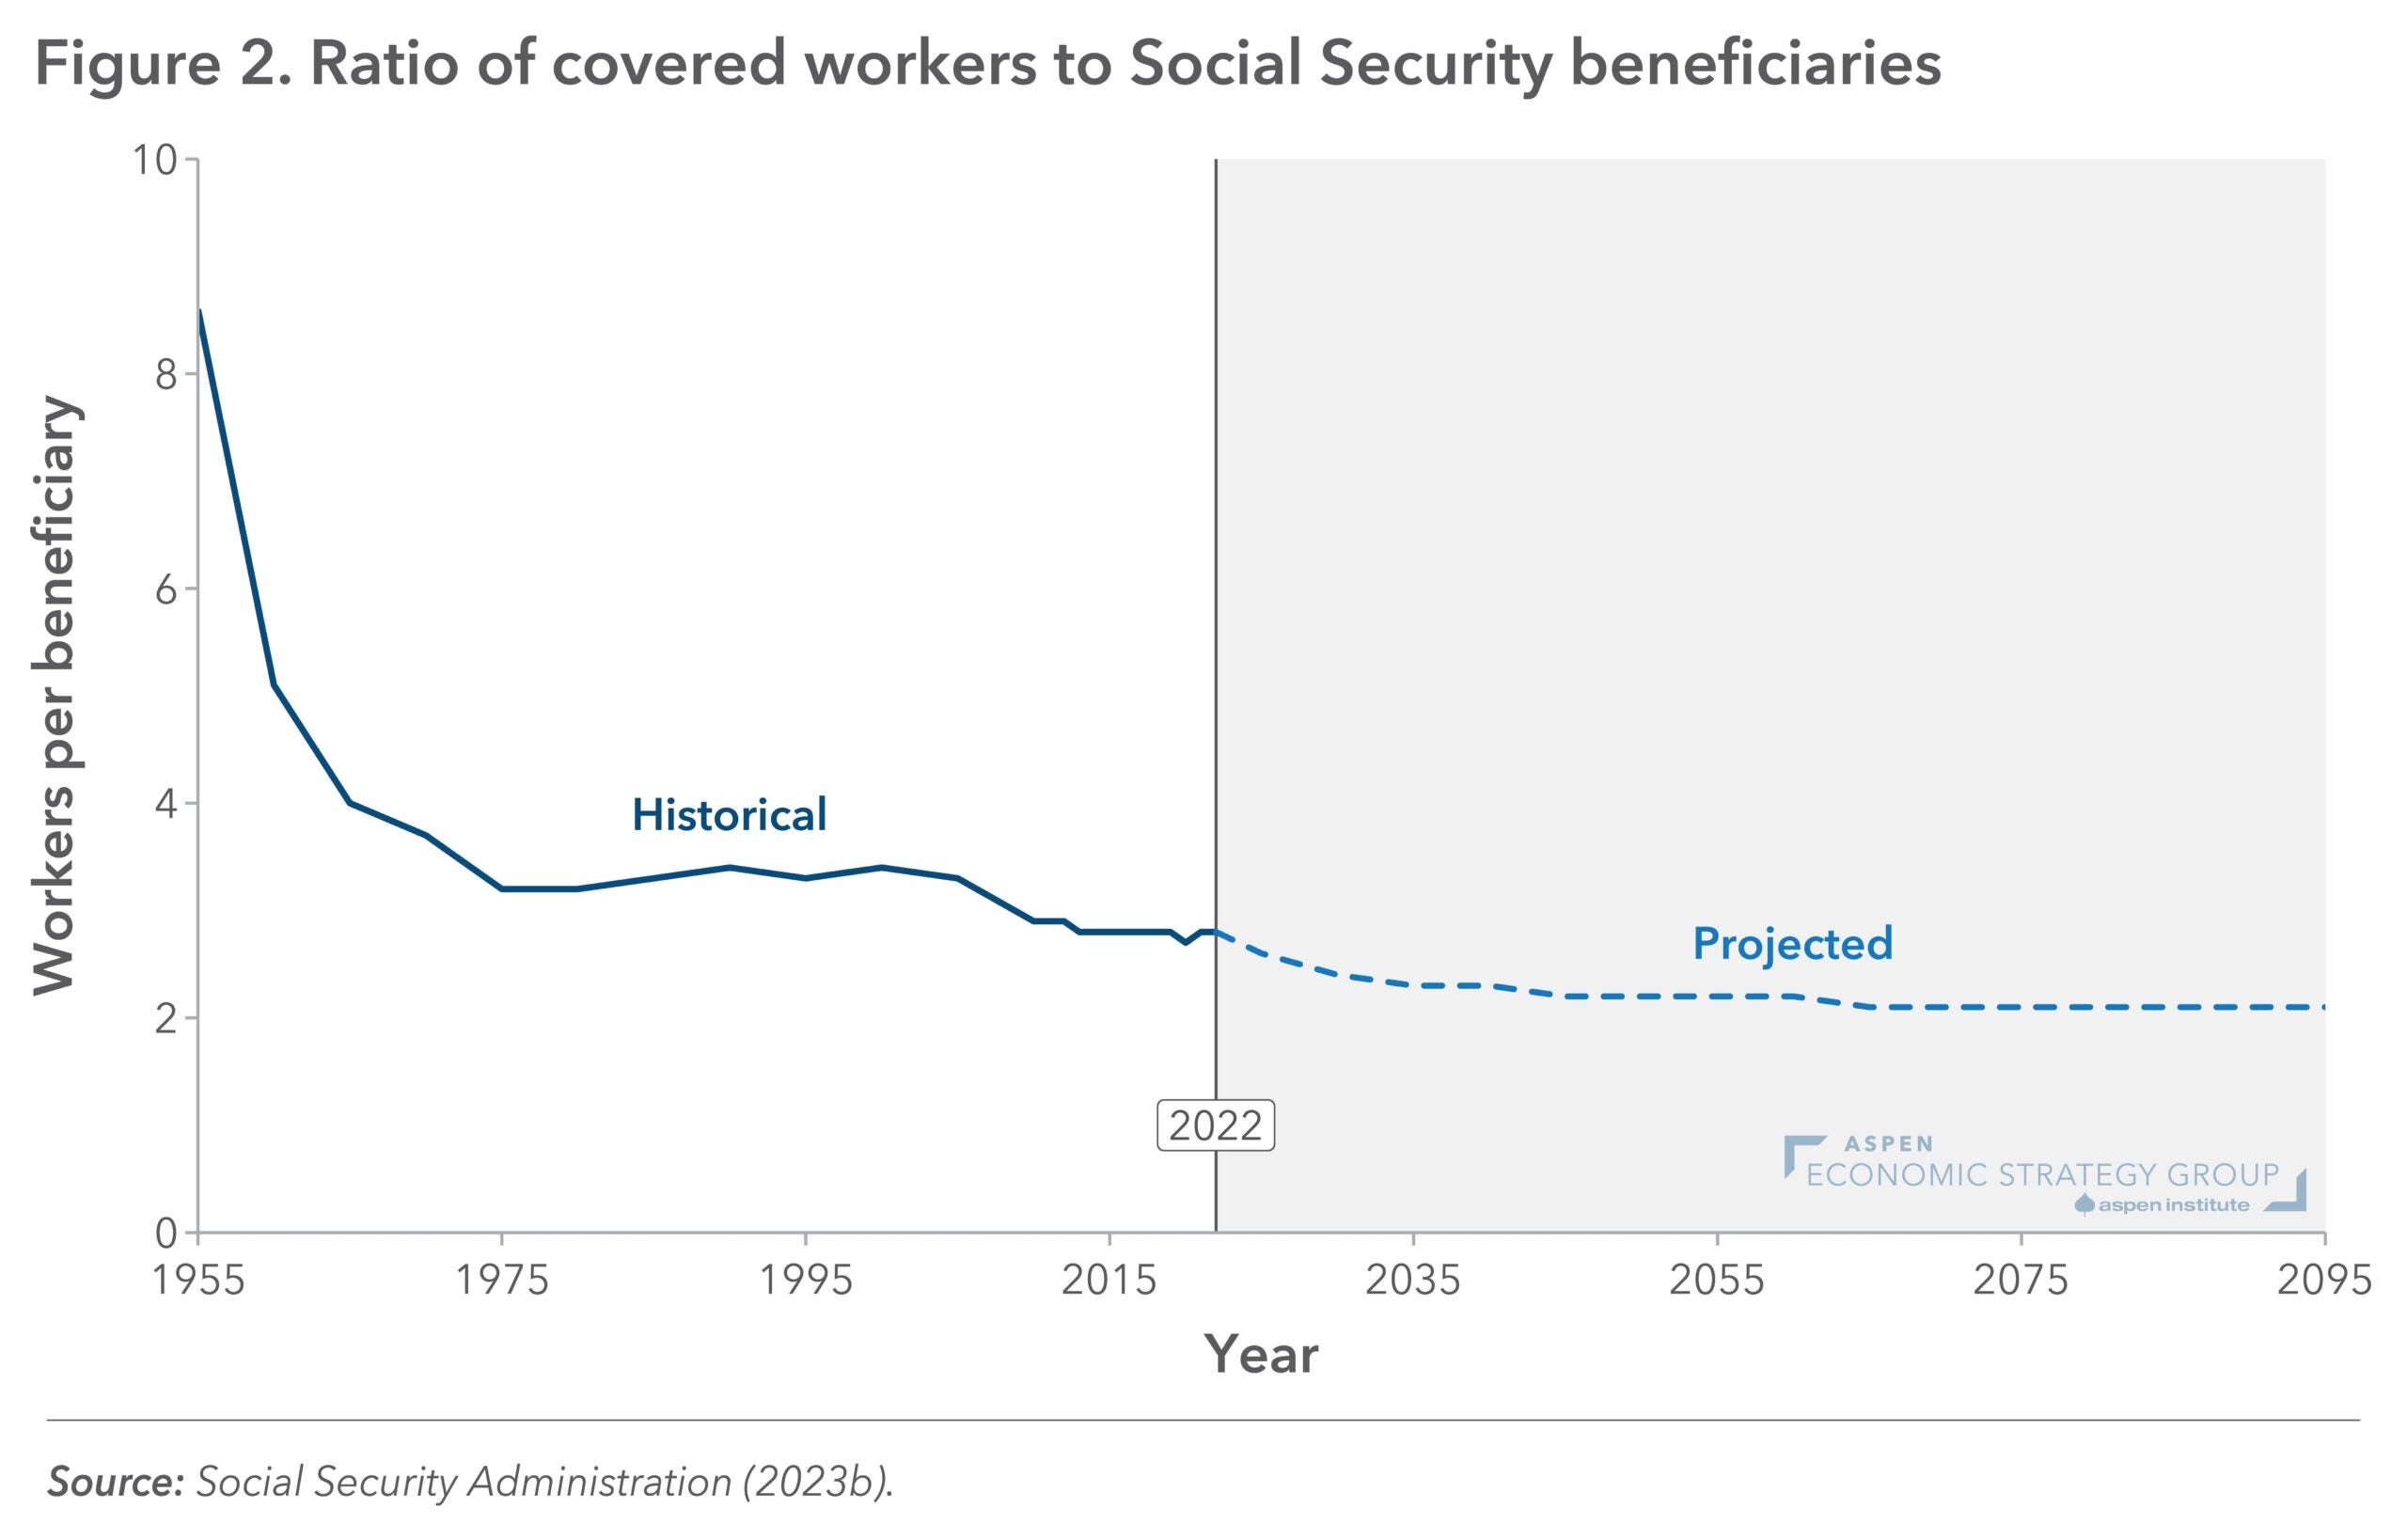
Figure 16: Biosimilar Uptake Curve
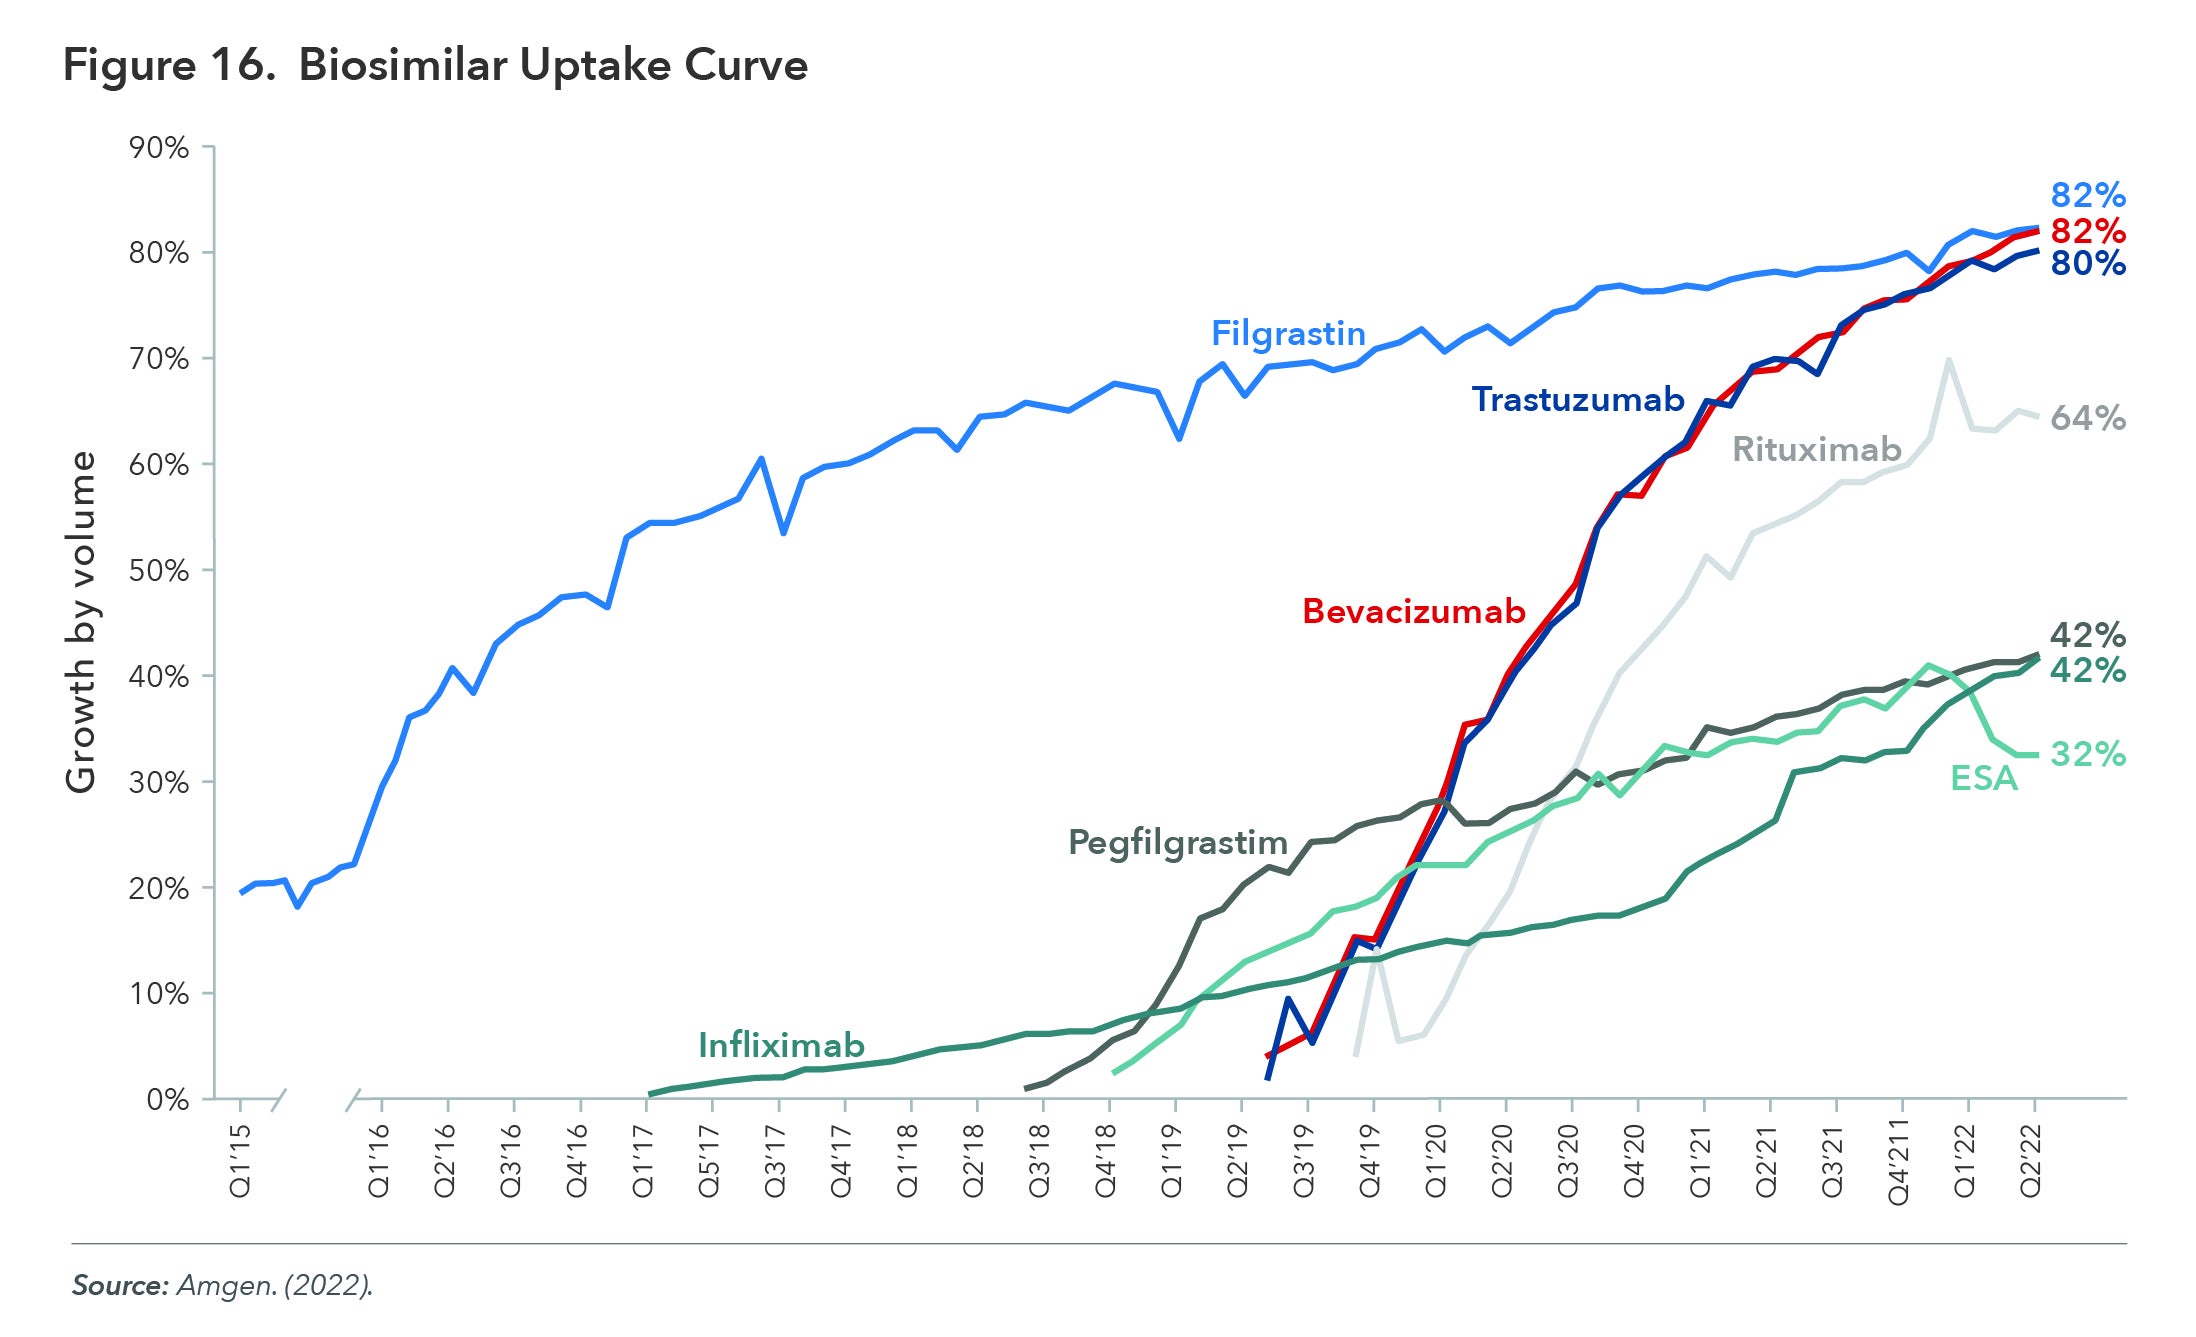
Figure 1: Semiconductor Supply Chain Investments Announced from May 2020 to June 2023
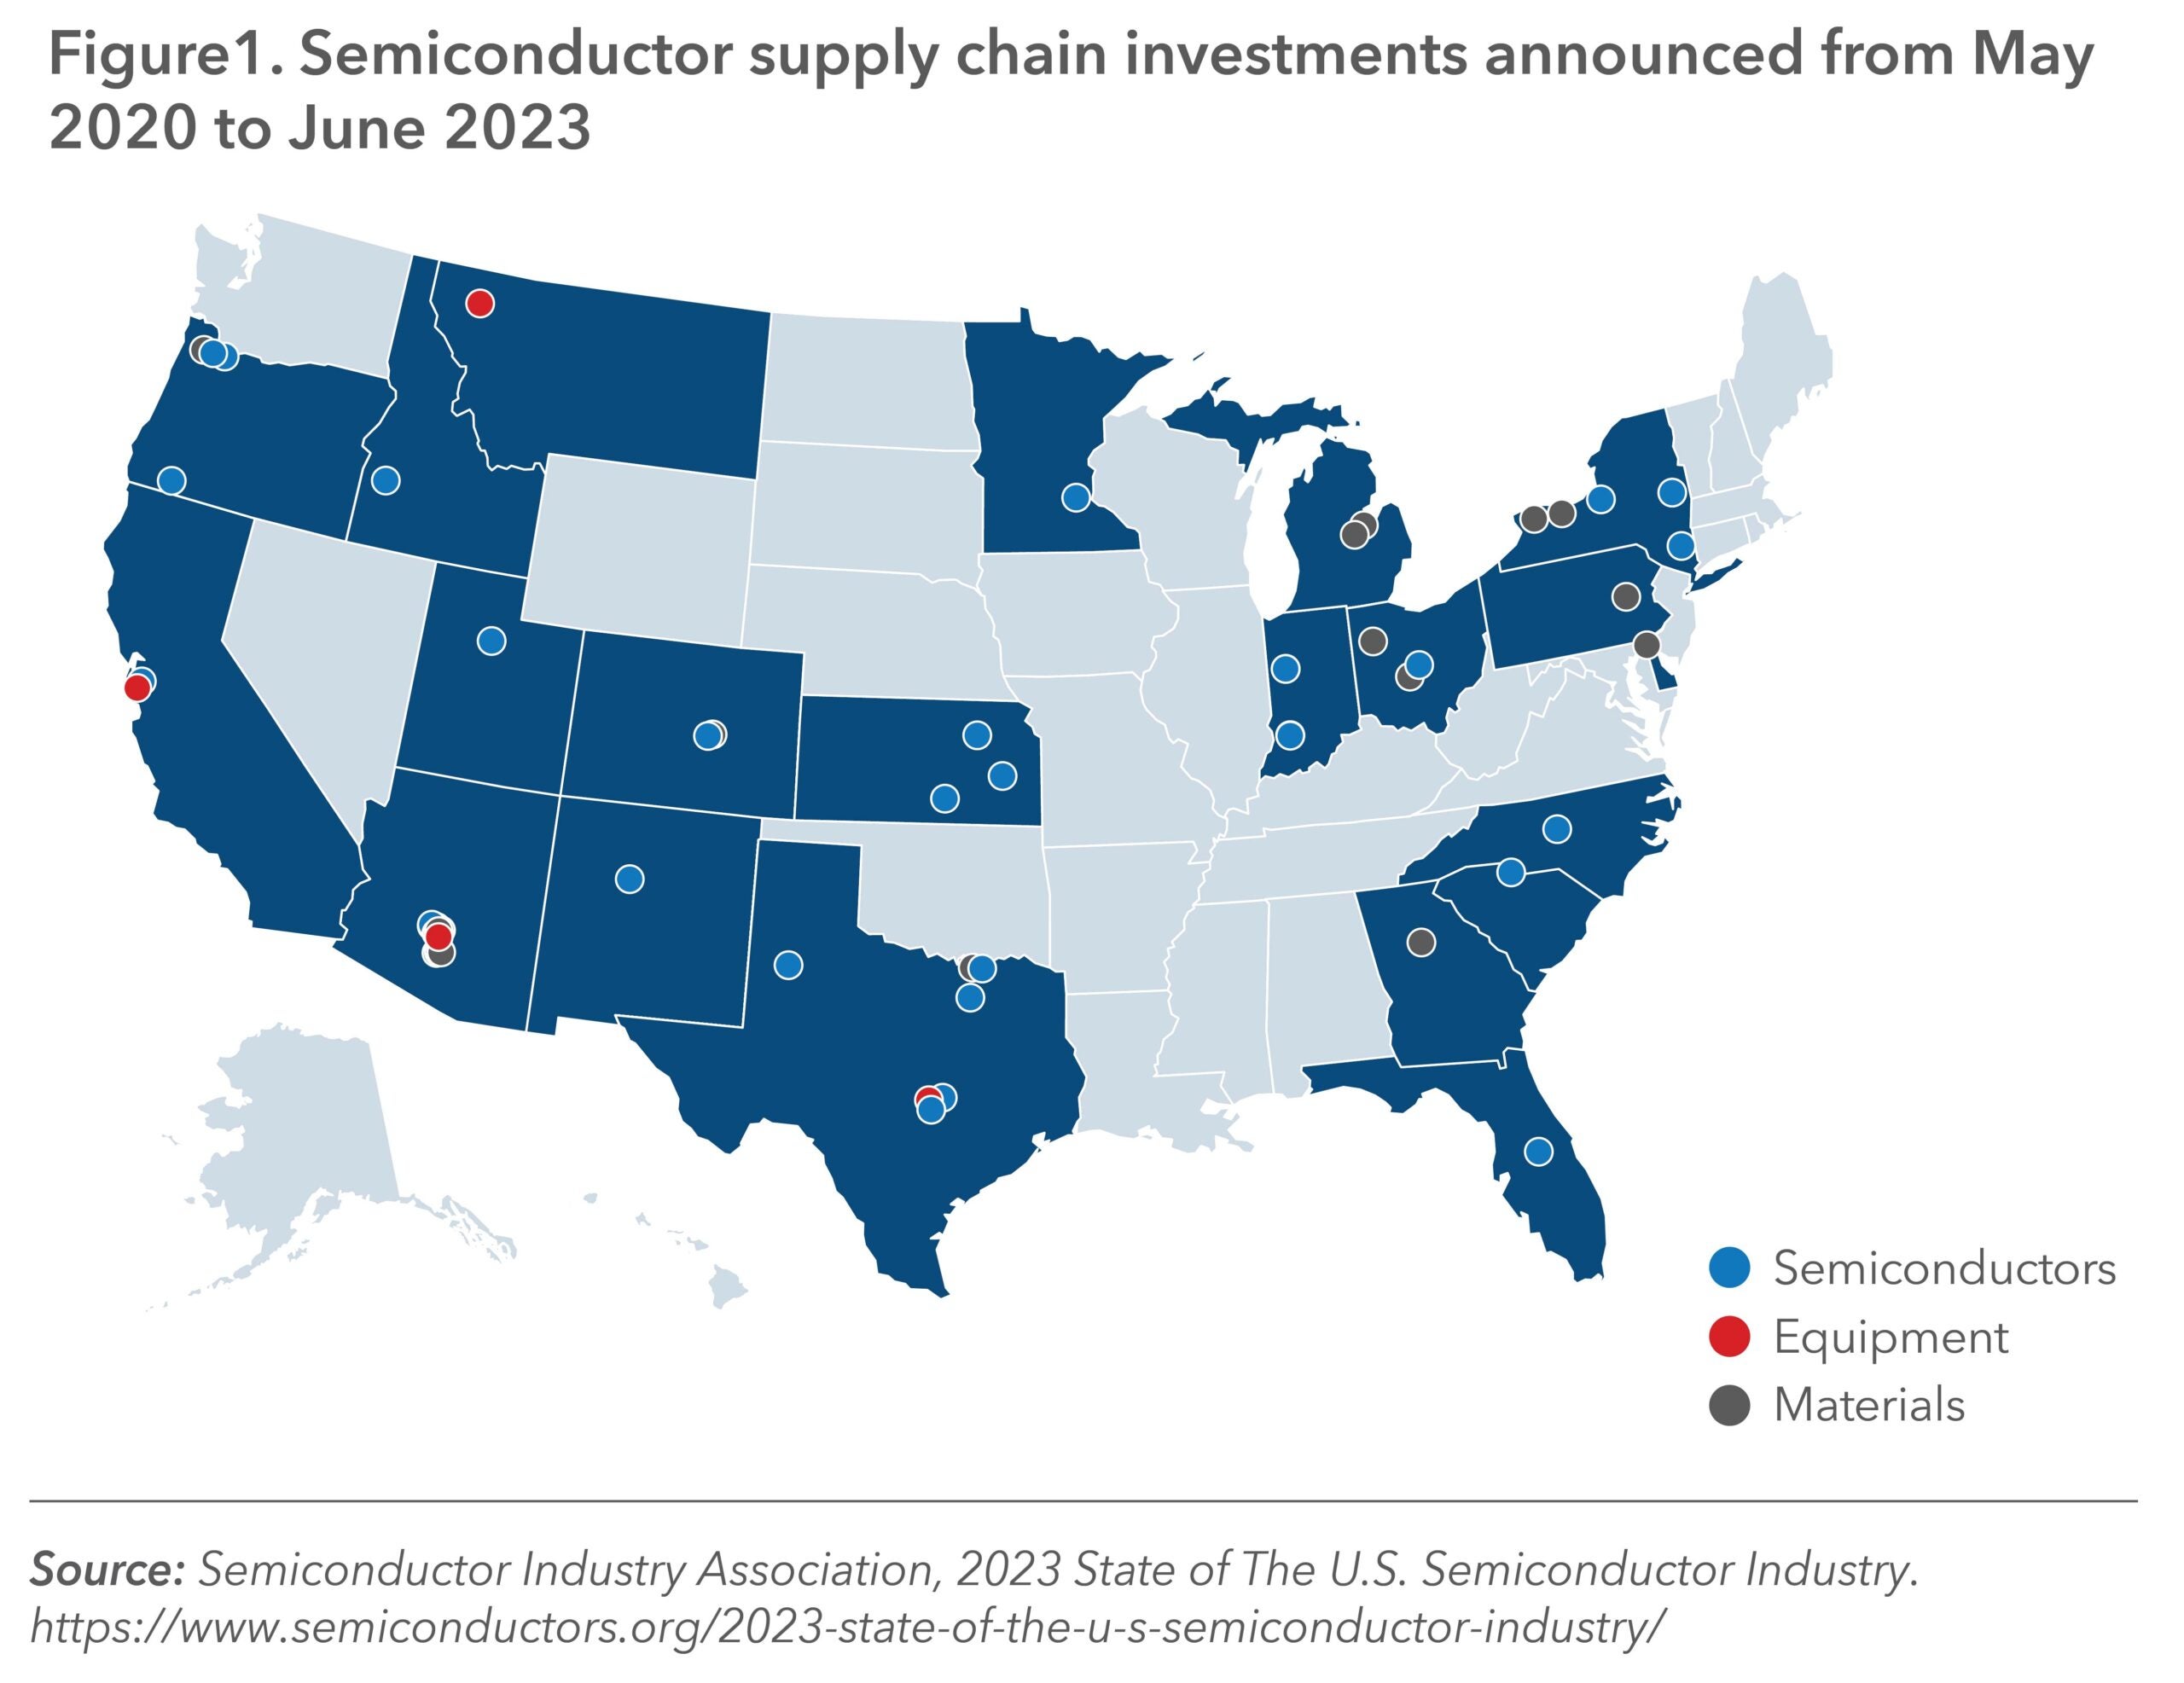
Figure 9: Average Cost Sharing by Prescription Drug Tier, Employer-Sponsored Plans, 2022
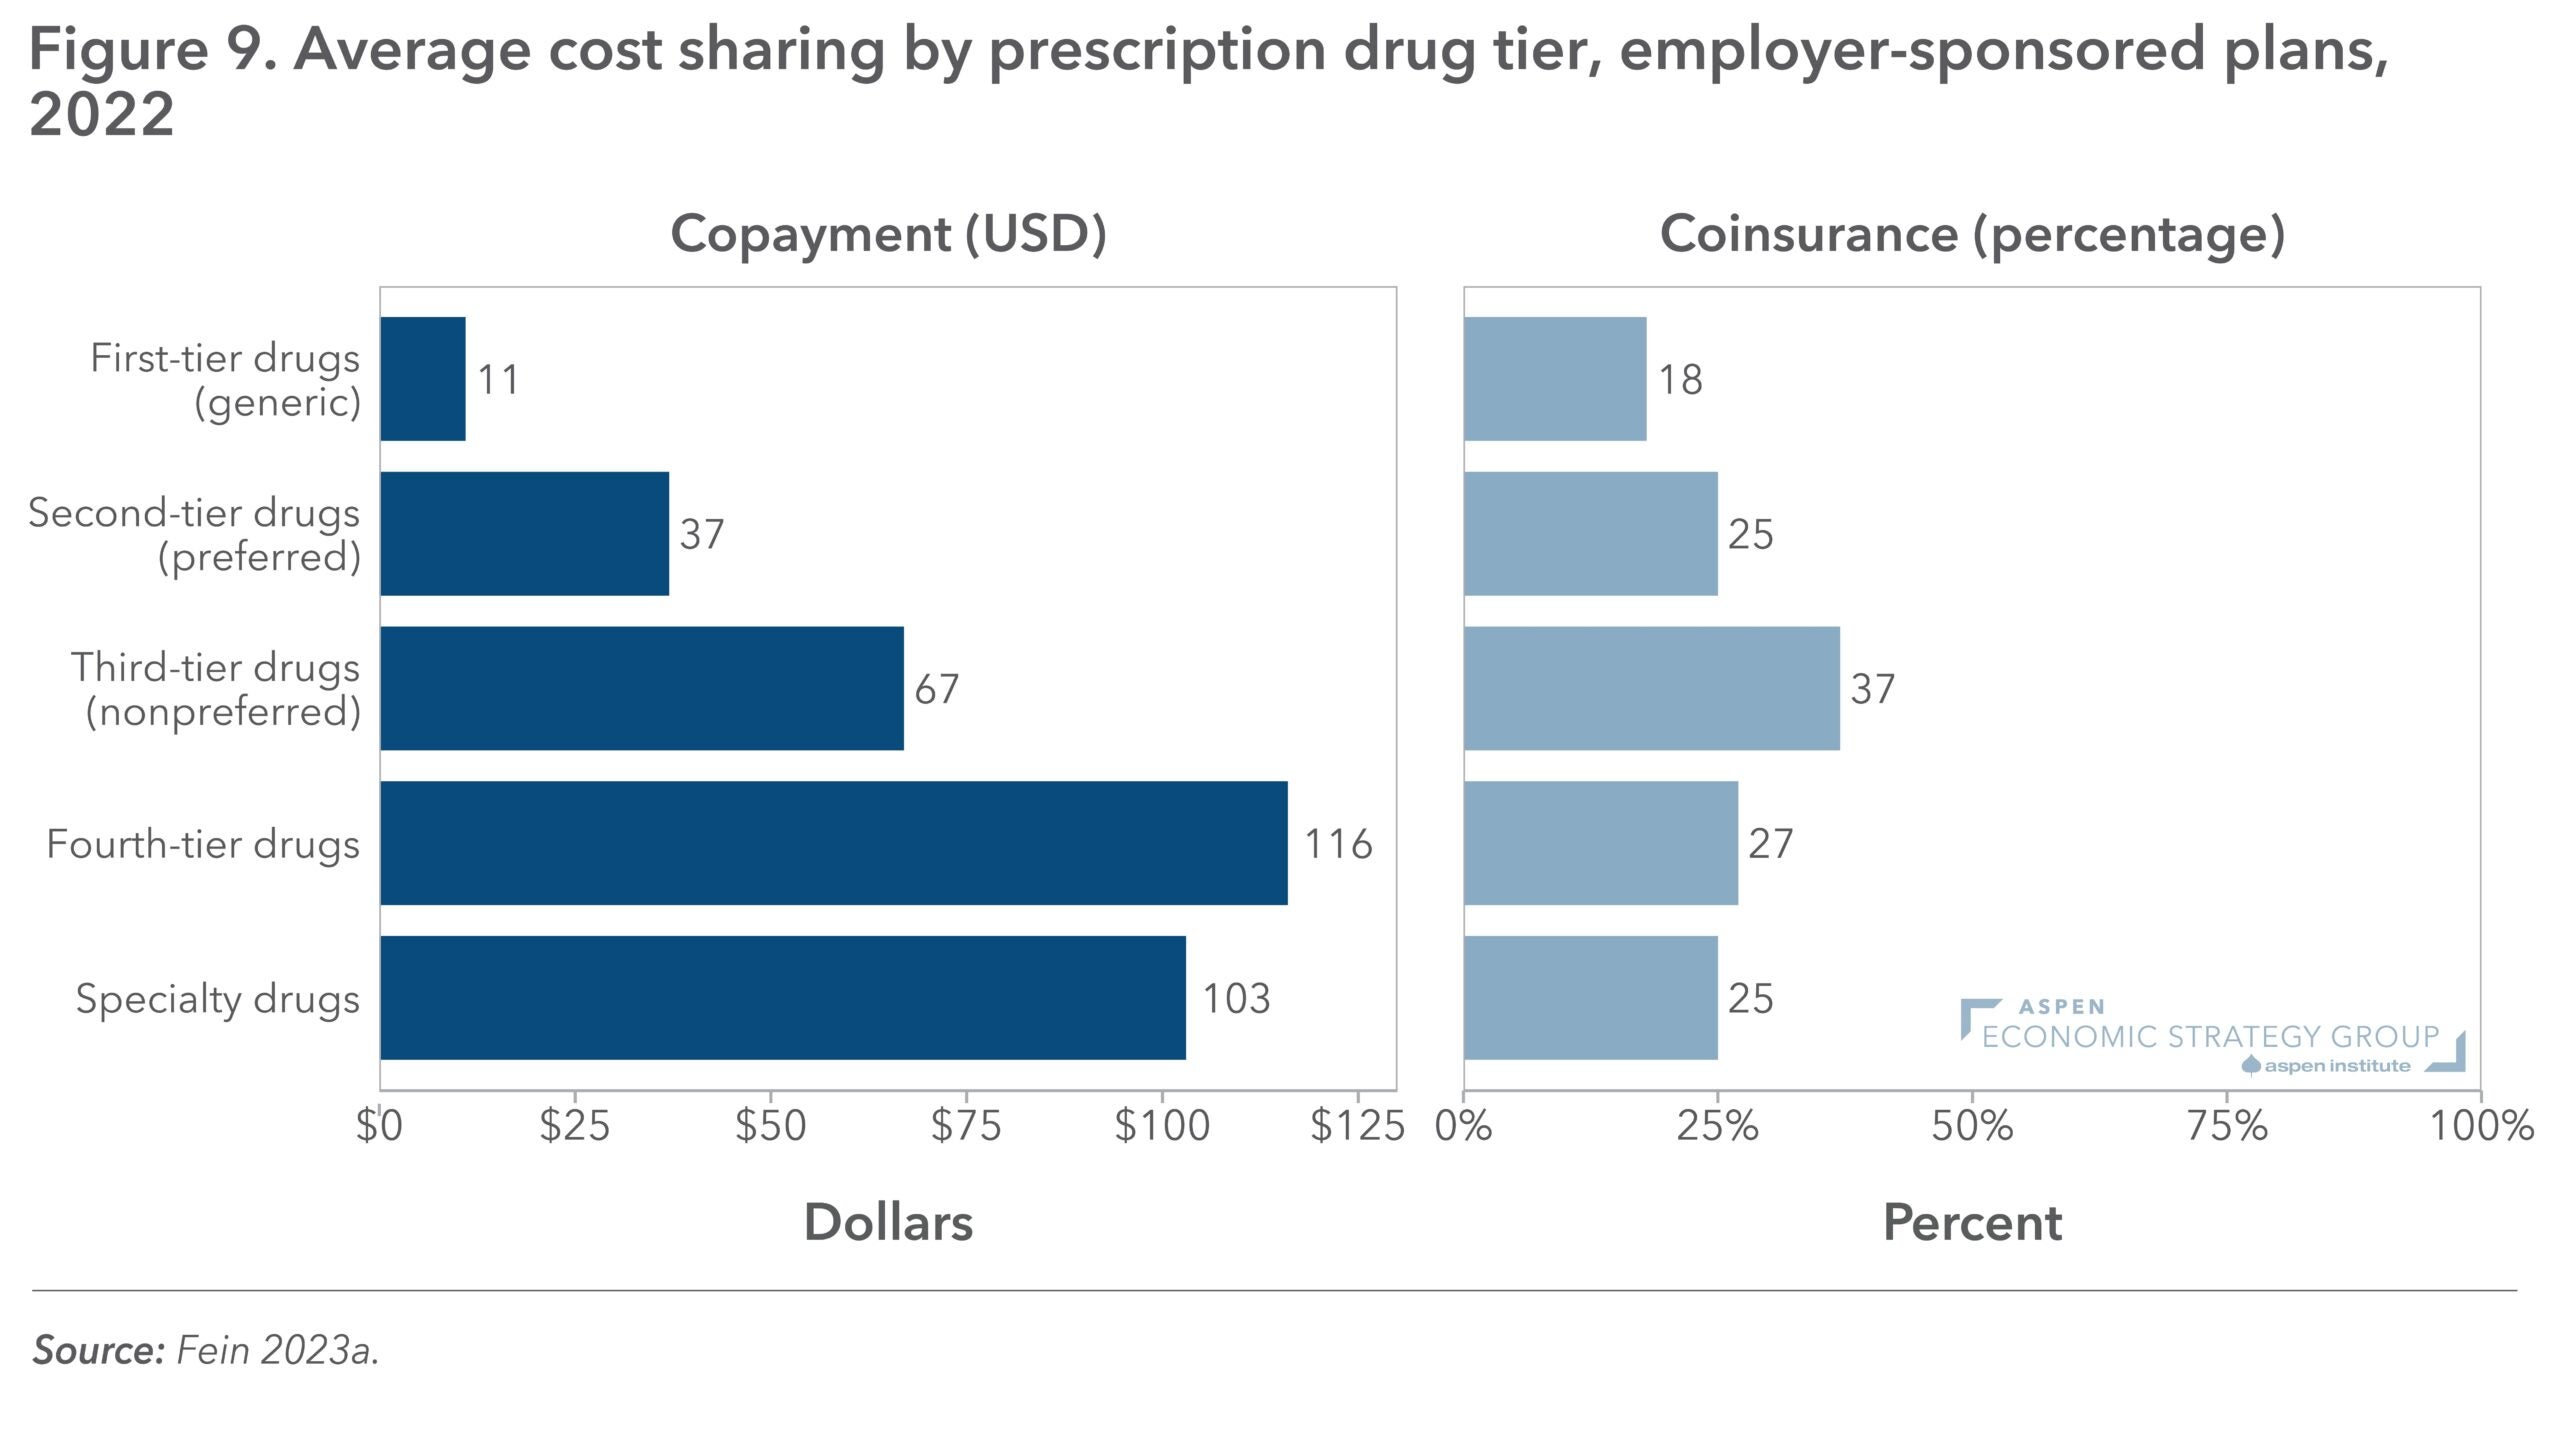
Figure 8: Projected debt/GDP under alternative assumptions, 2023, 2033, and 2053
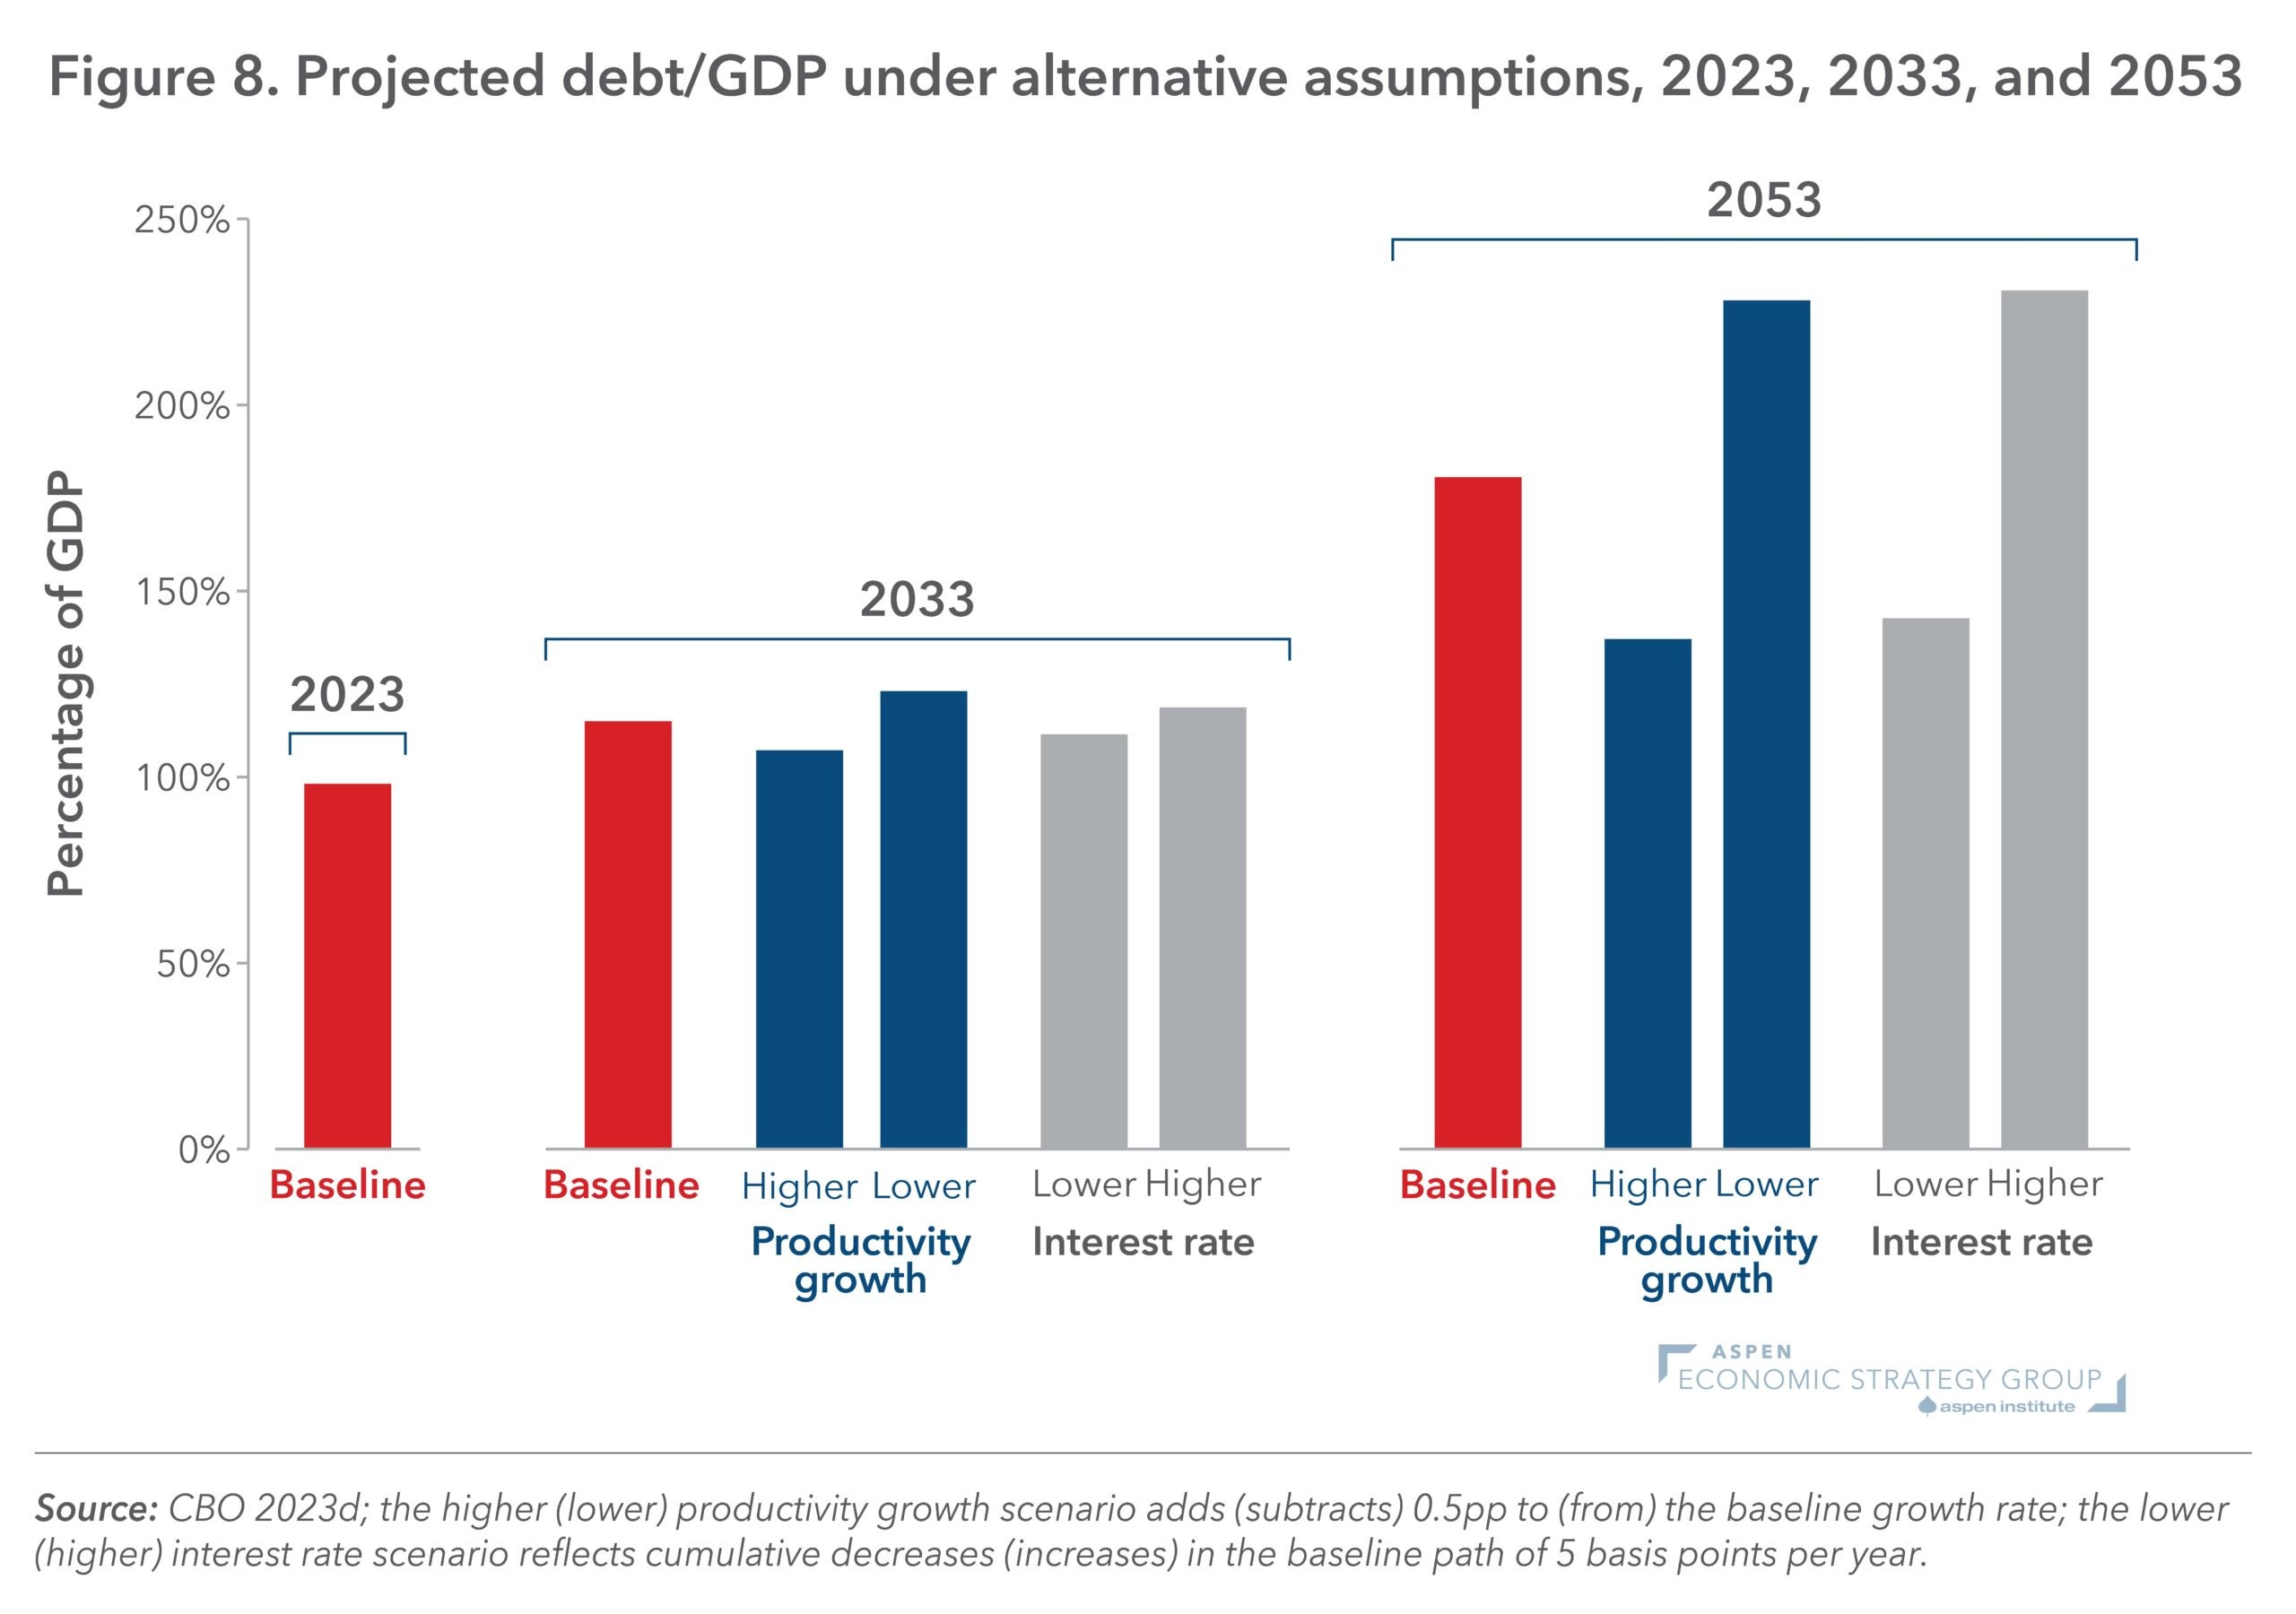
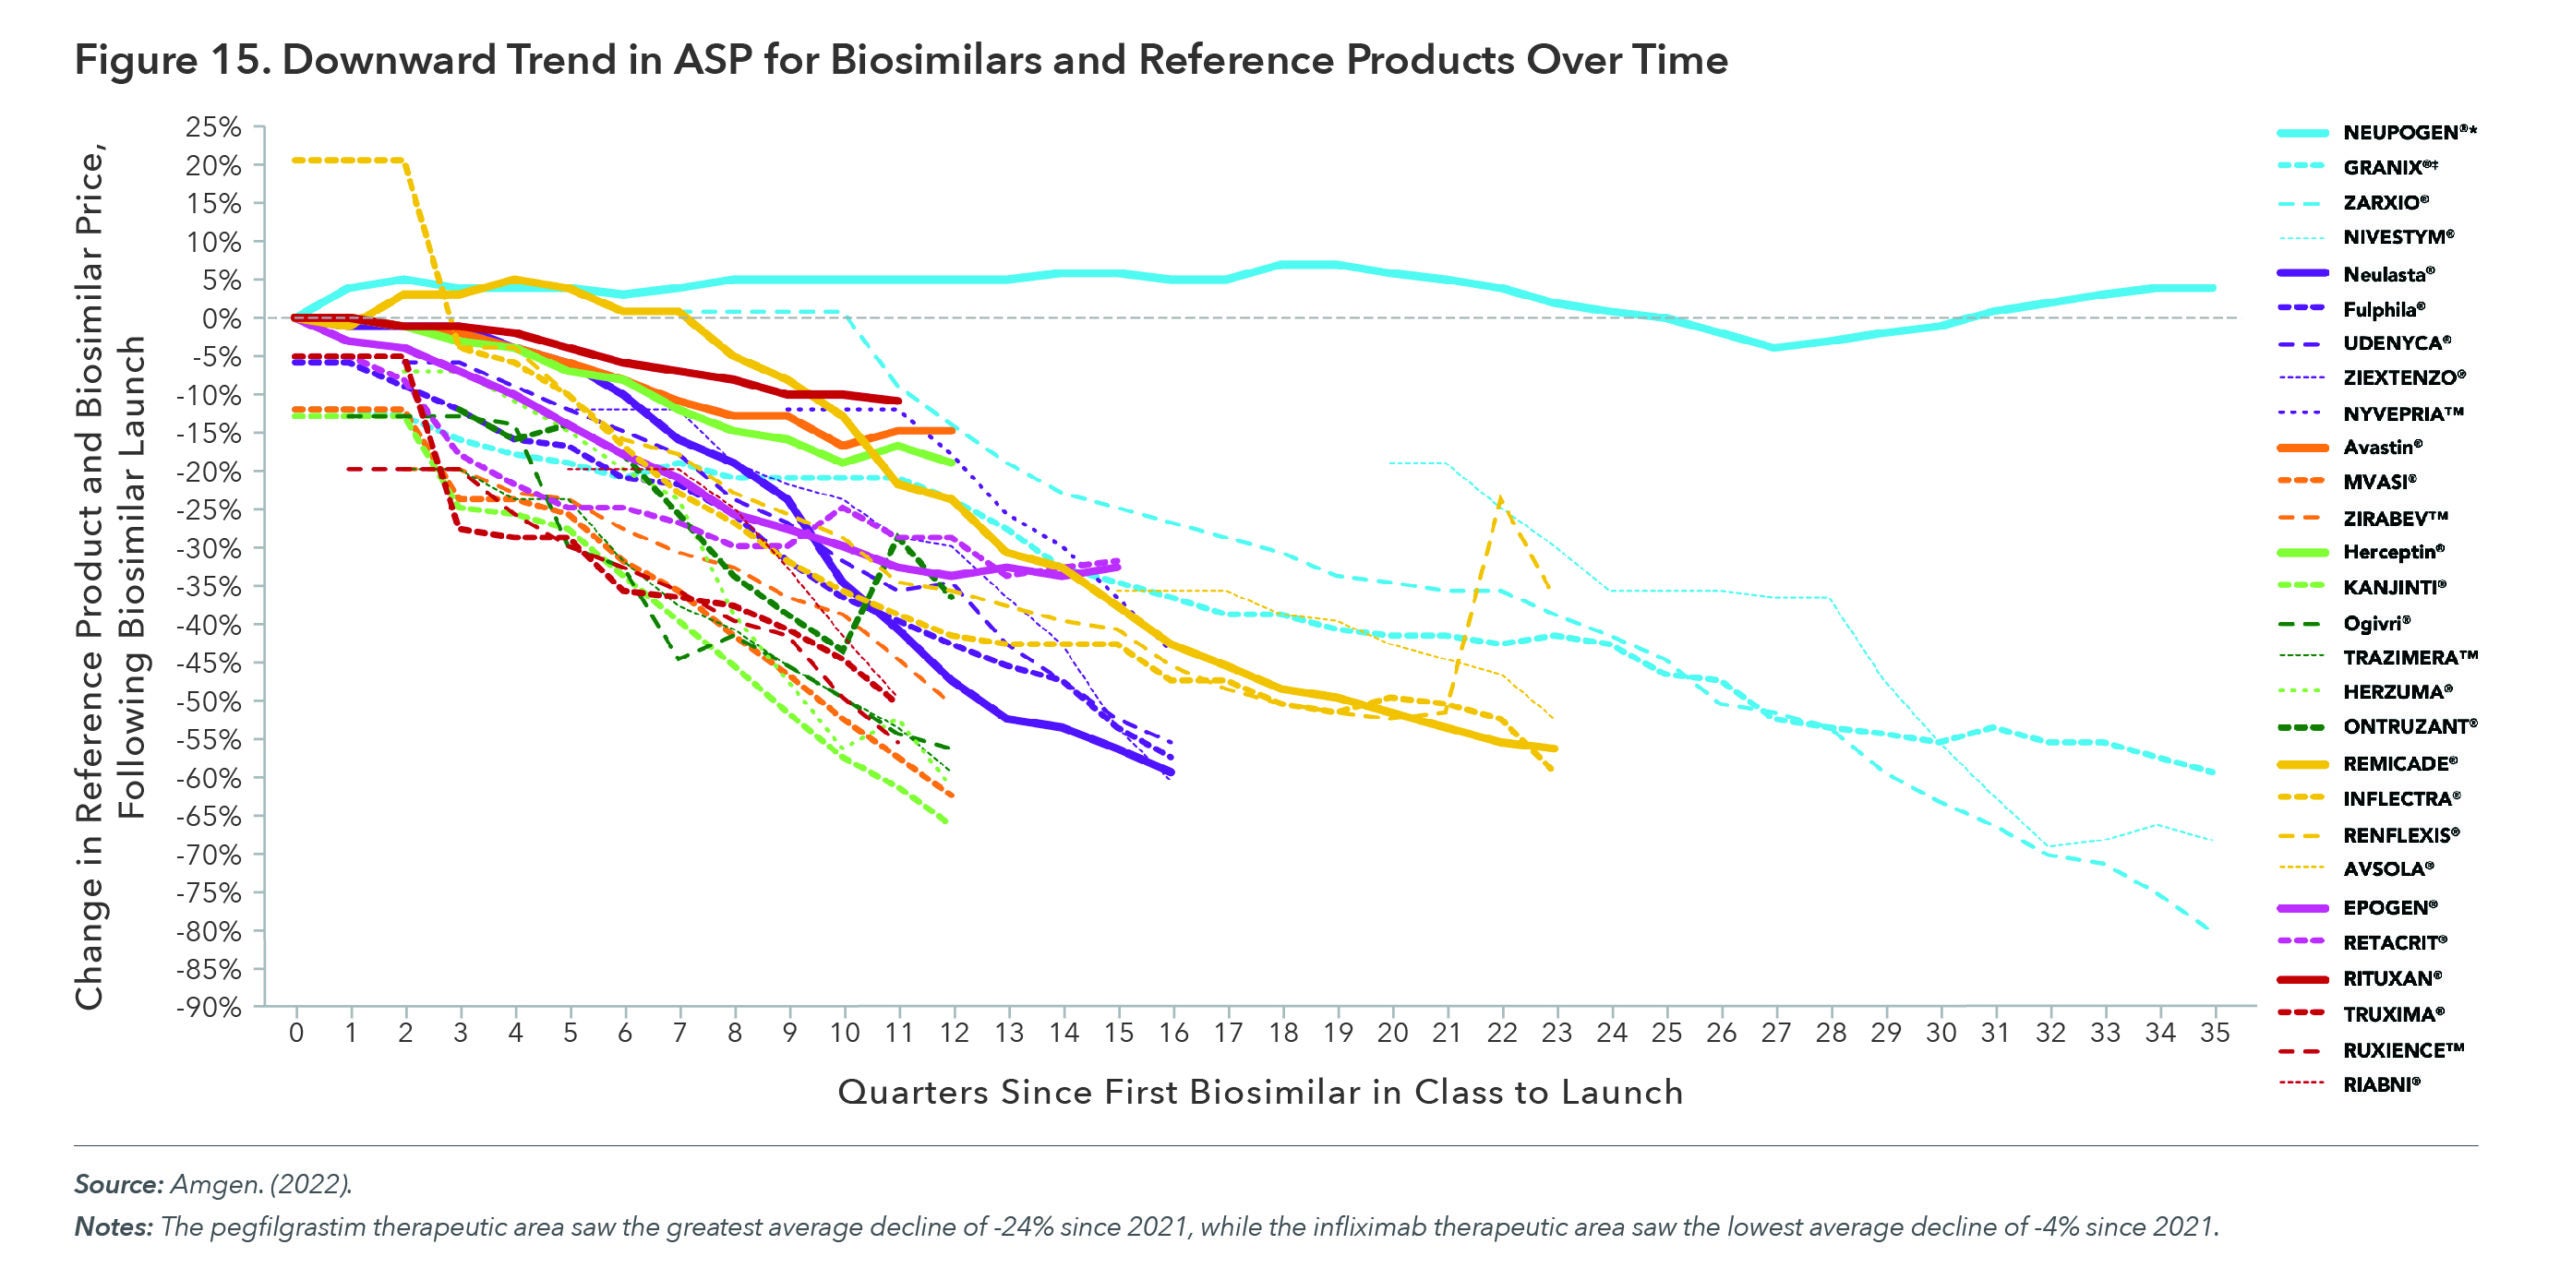
Figure 15: Downward Trend in ASP for Biosimilars and Reference Products Over Time