Archives: Publications
These are AIESG Publications
Figure 6: MVPF vs. Per Capita Spending, by Age
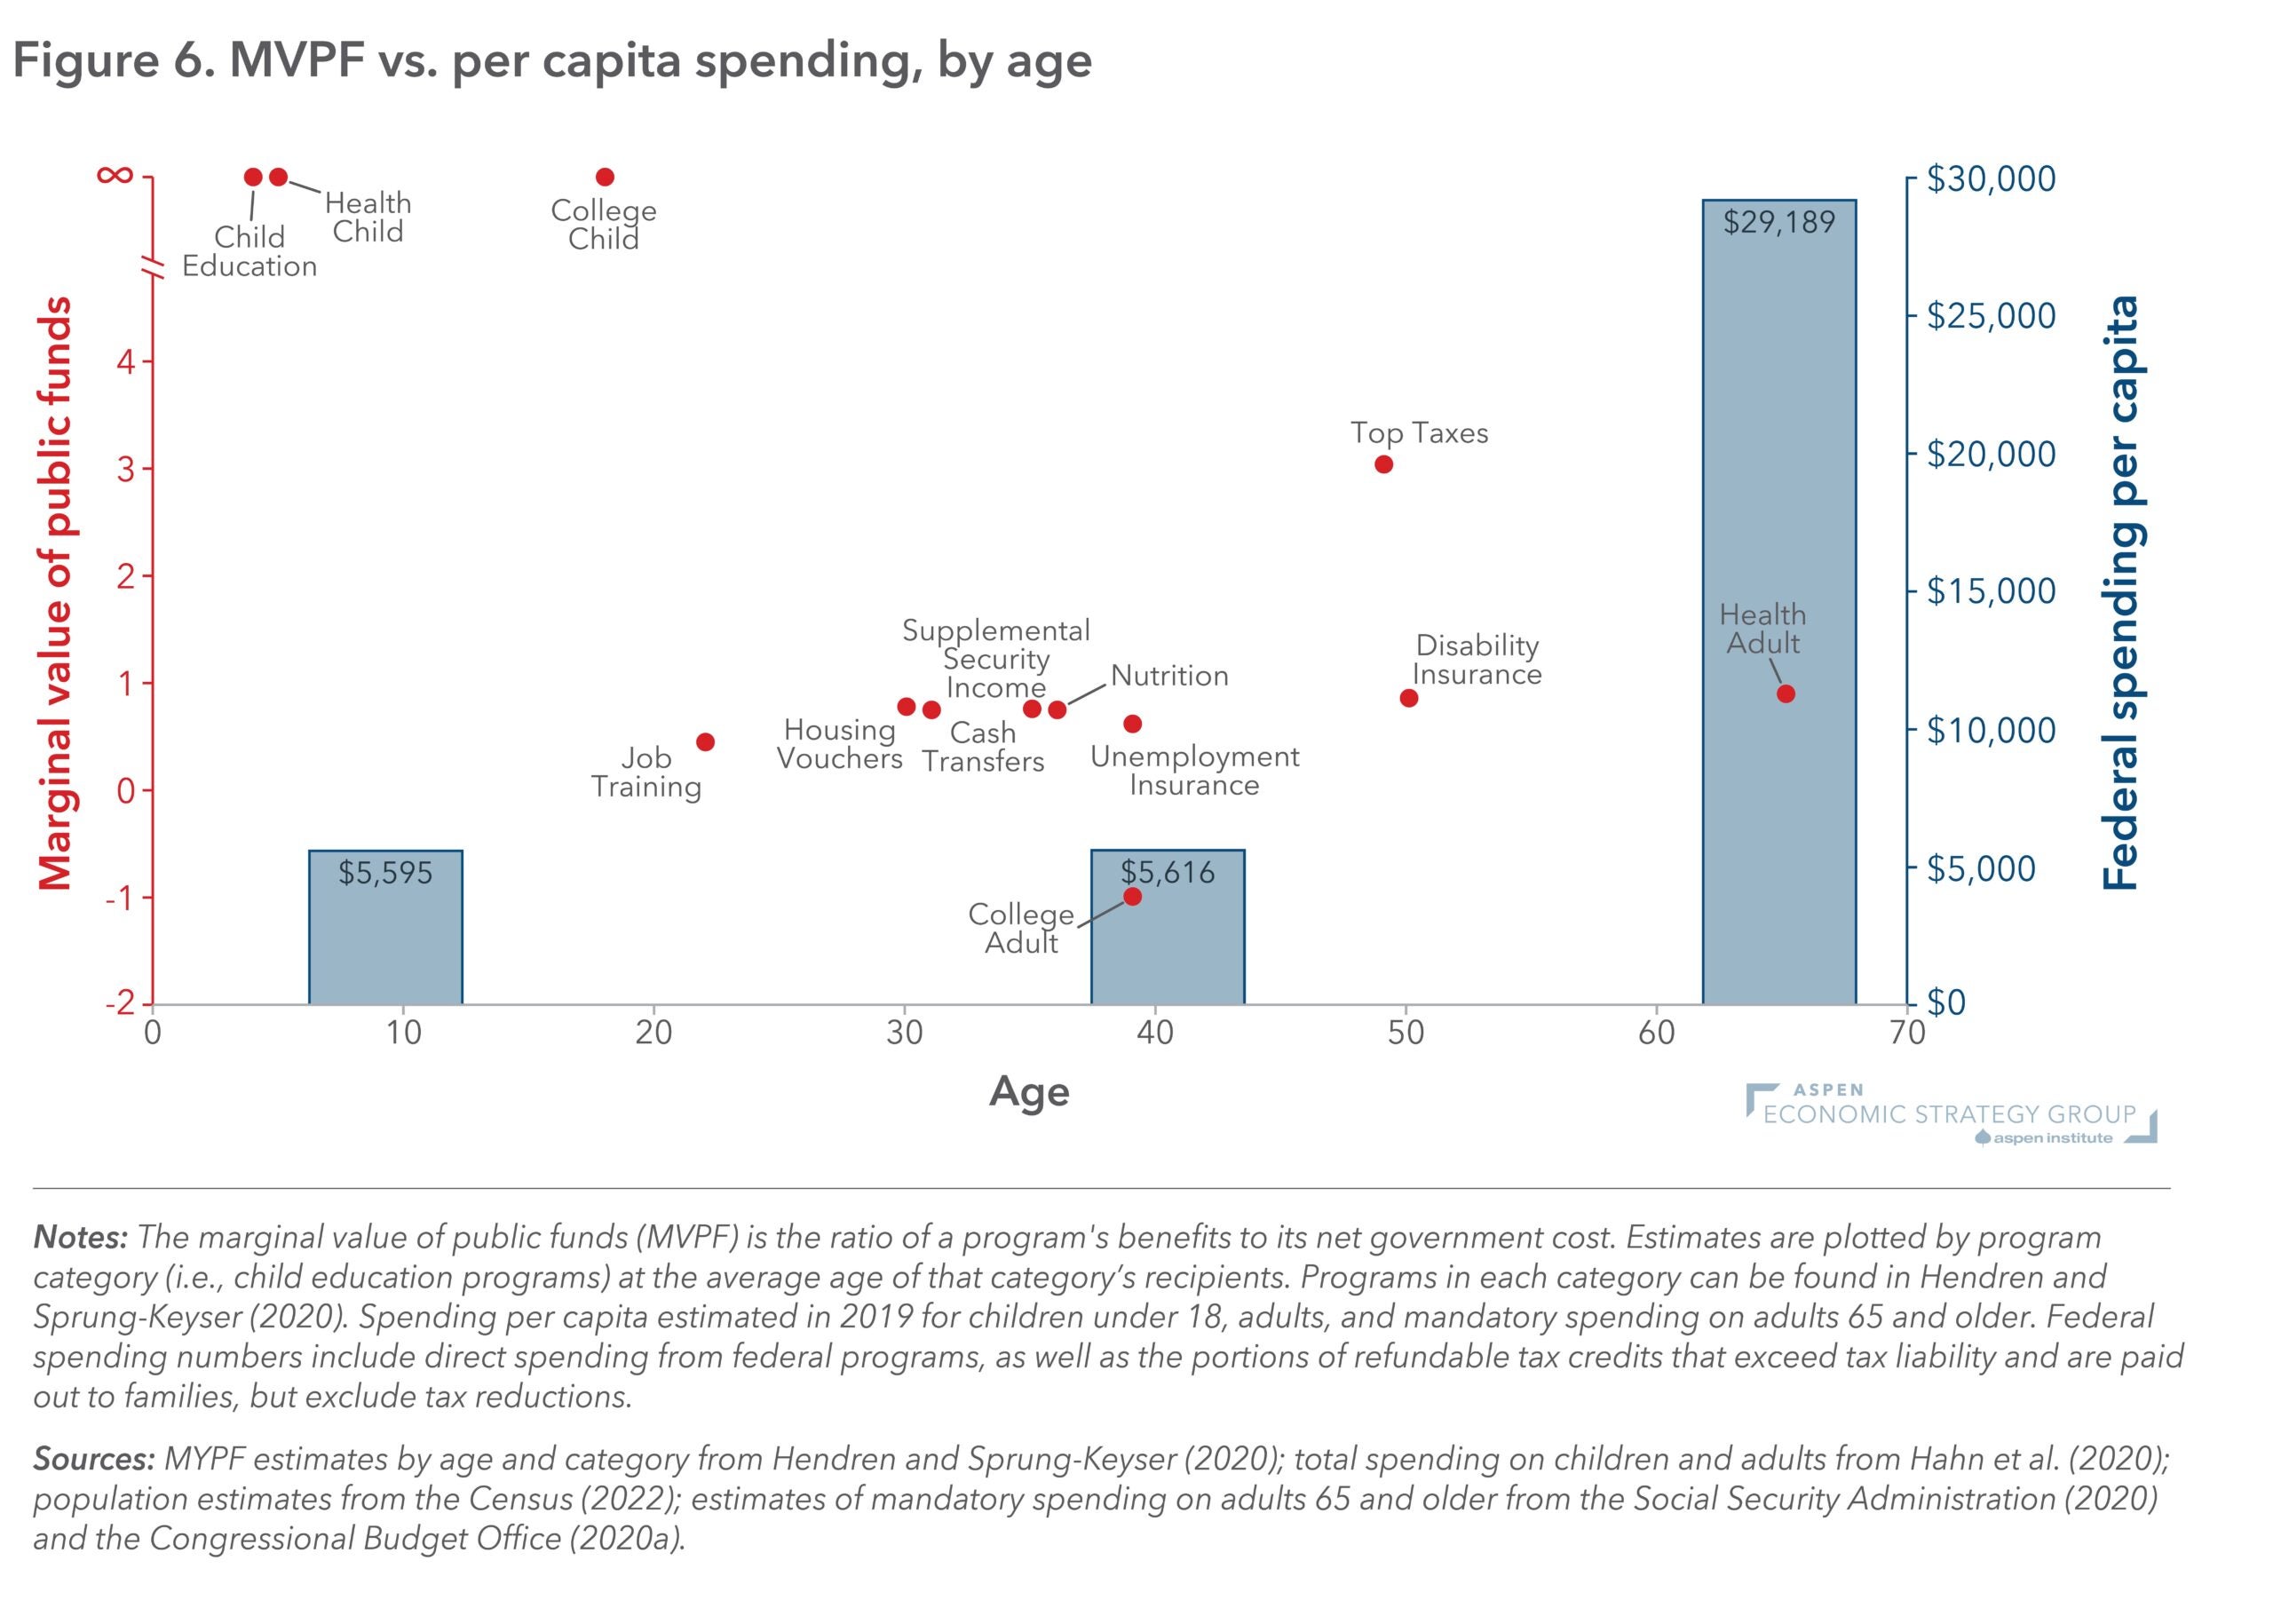
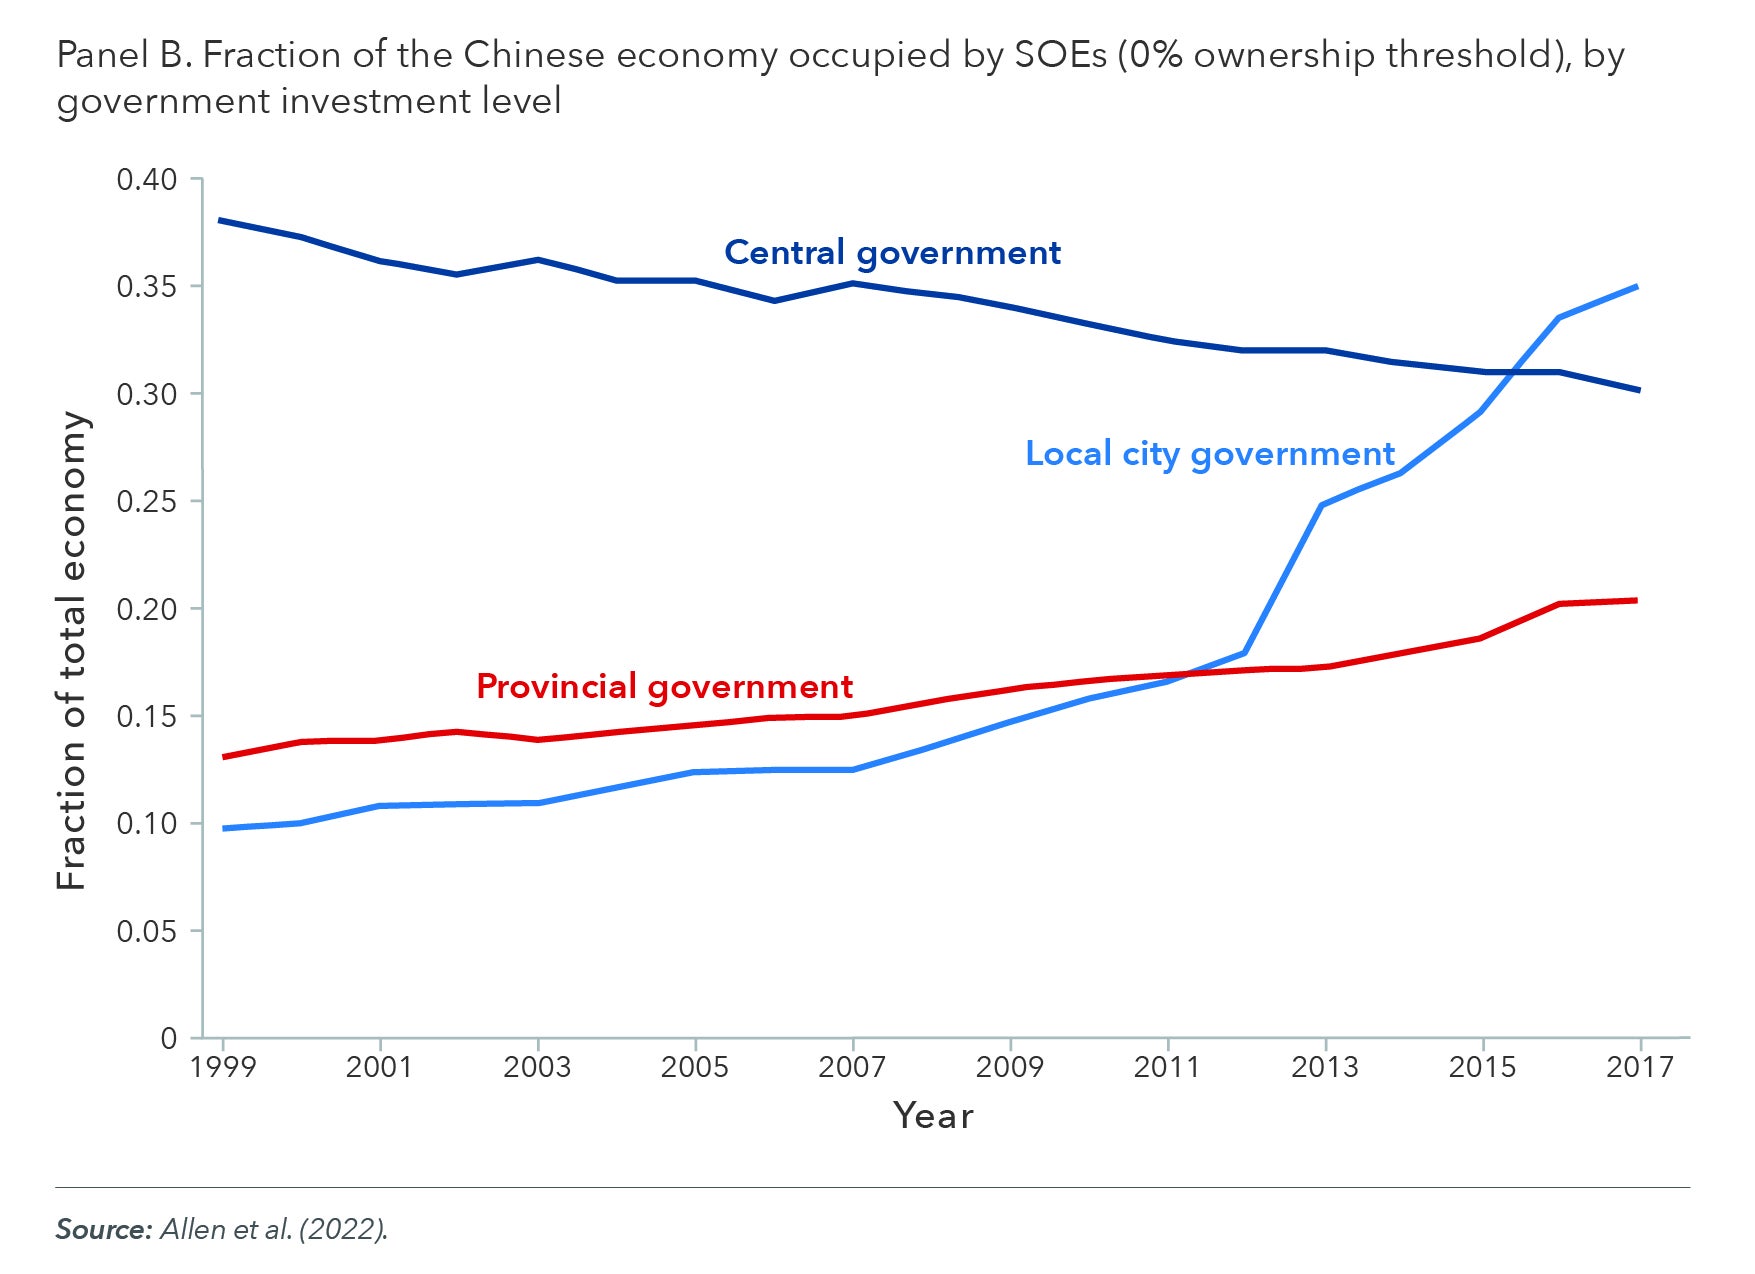
Figure 6A: Presence of State Capital in the Chinese Economy
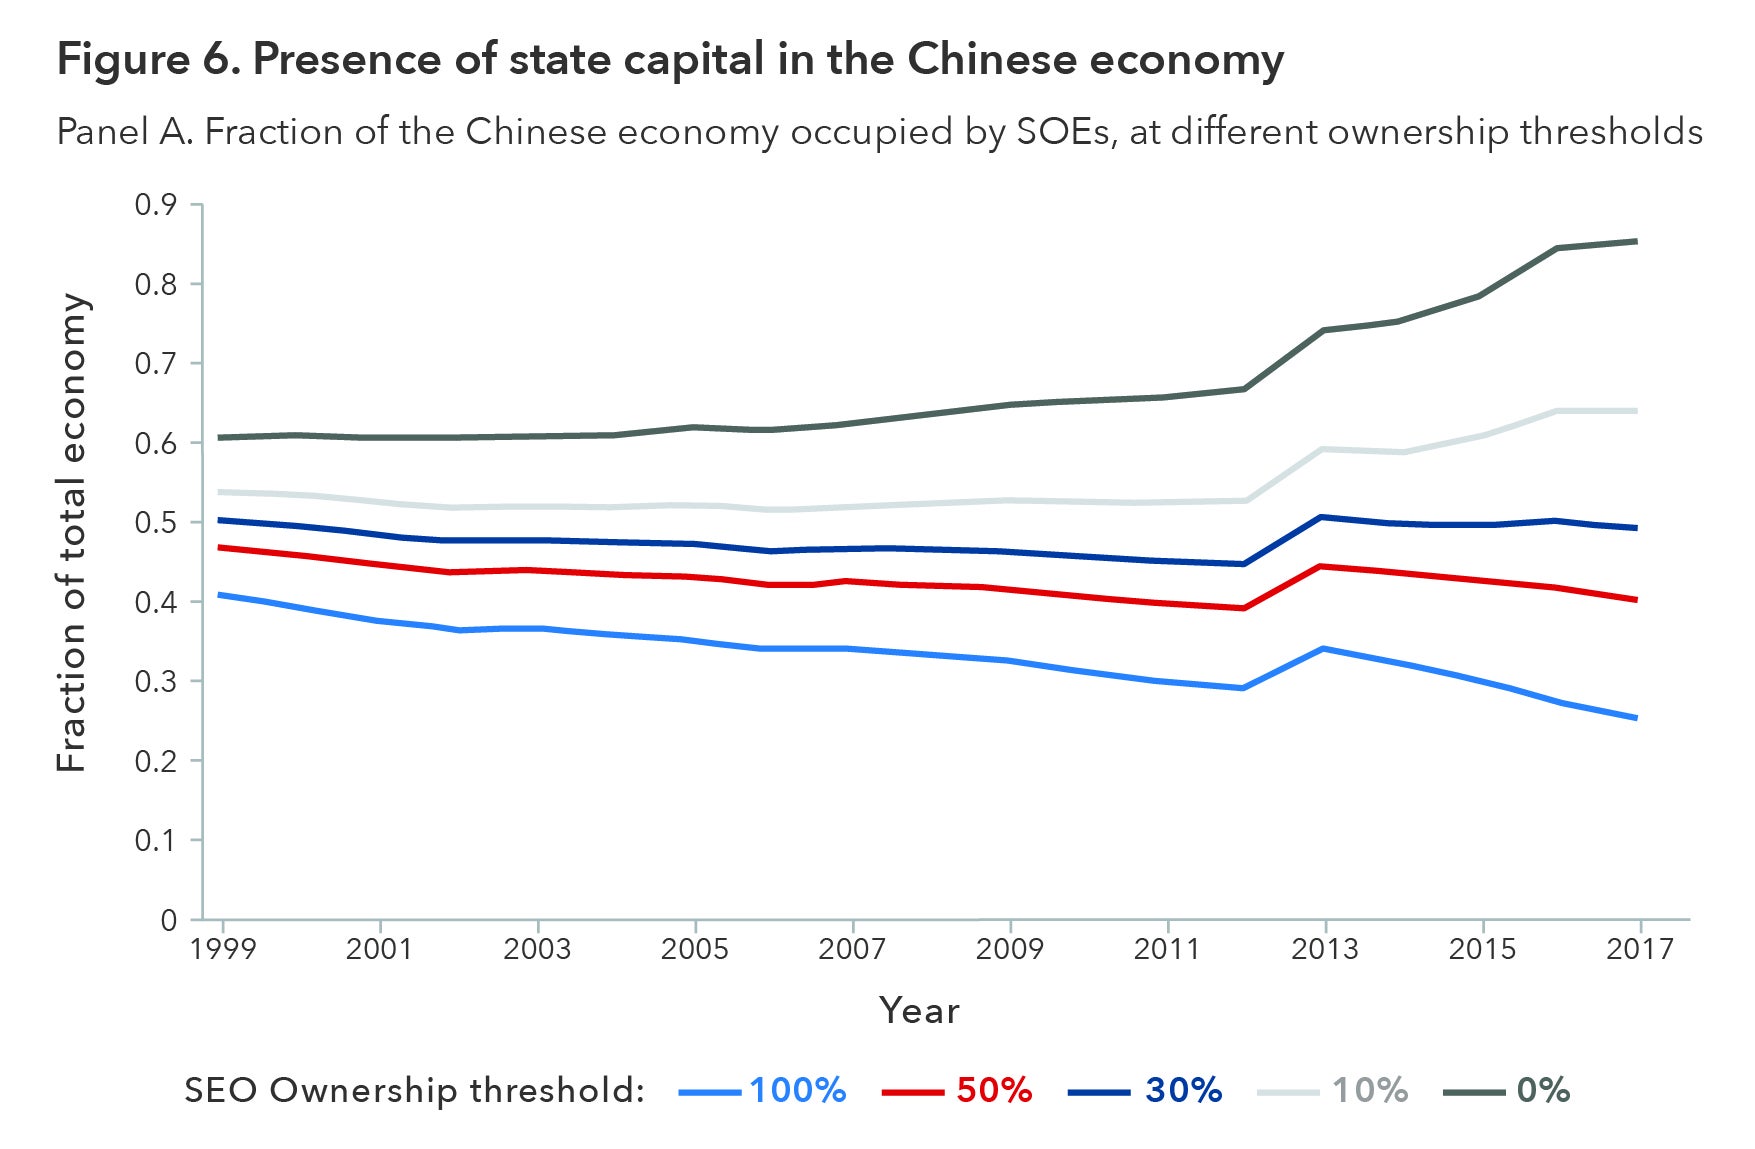
Figure 3: Actual and projected annual deficits for Social Security
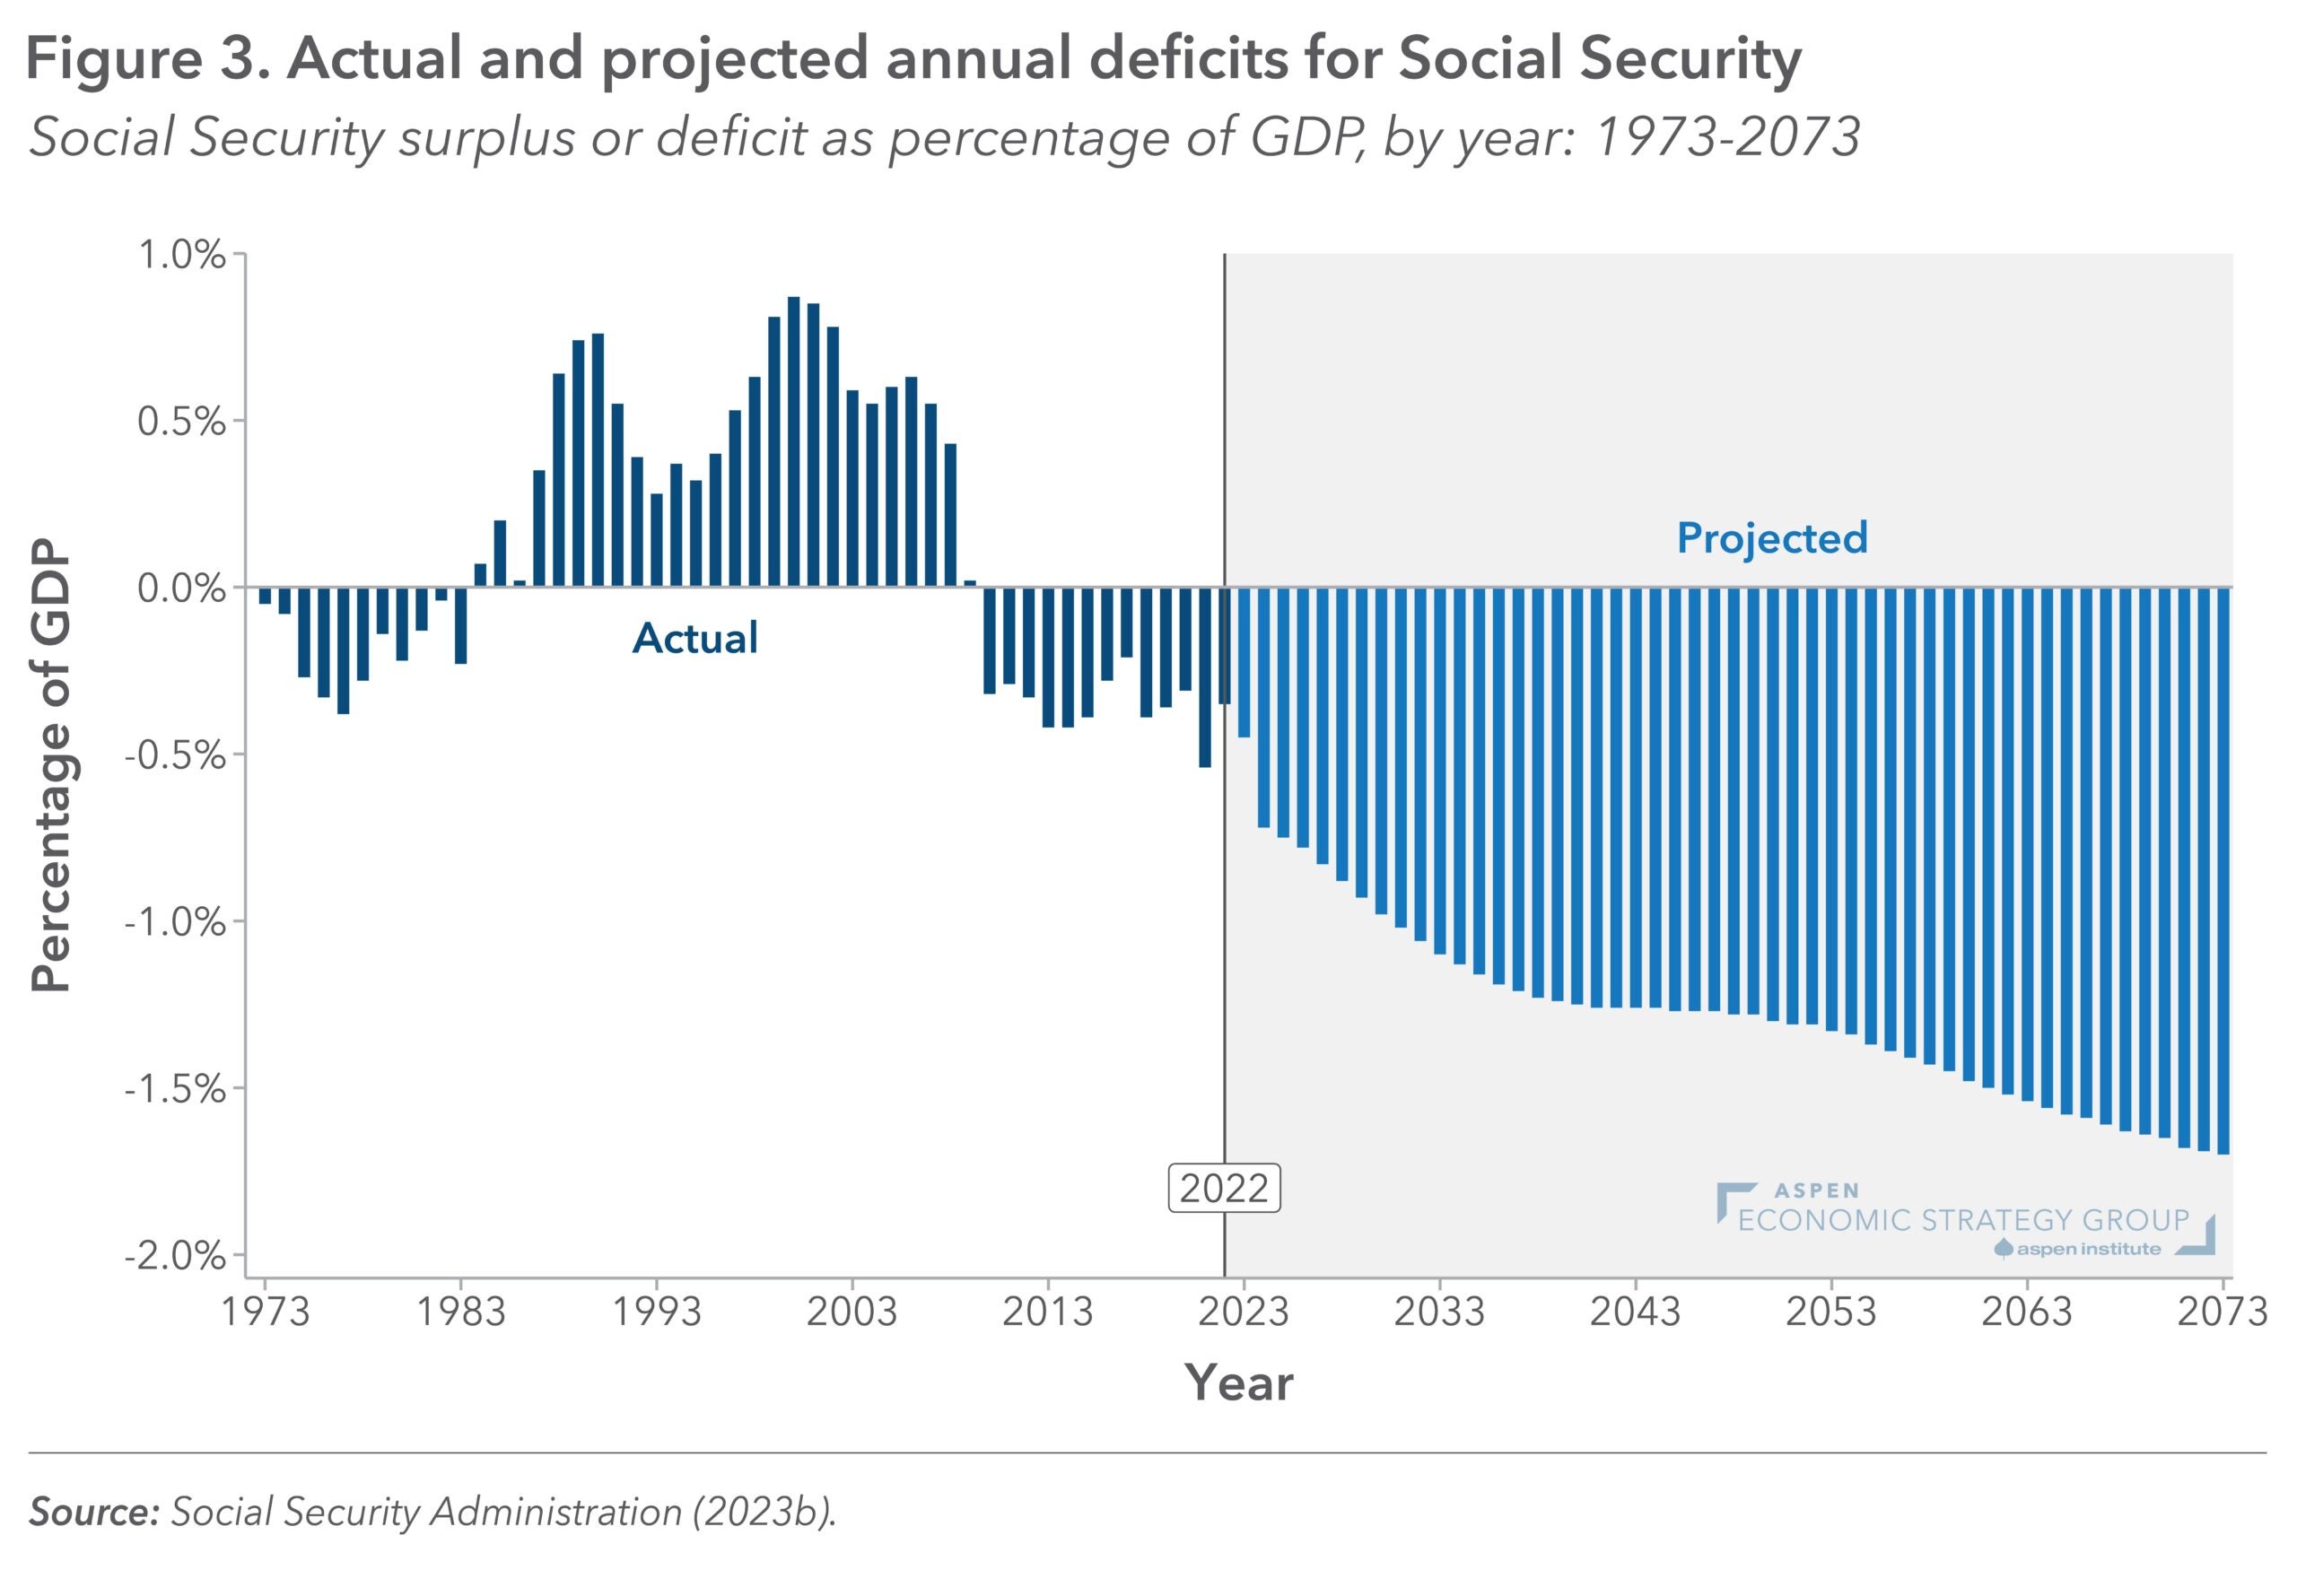
From, “Reforming Social Security for the Long Haul,” by Mark Duggan
Figure 1: Per Capita GDP Ratio (China/US)
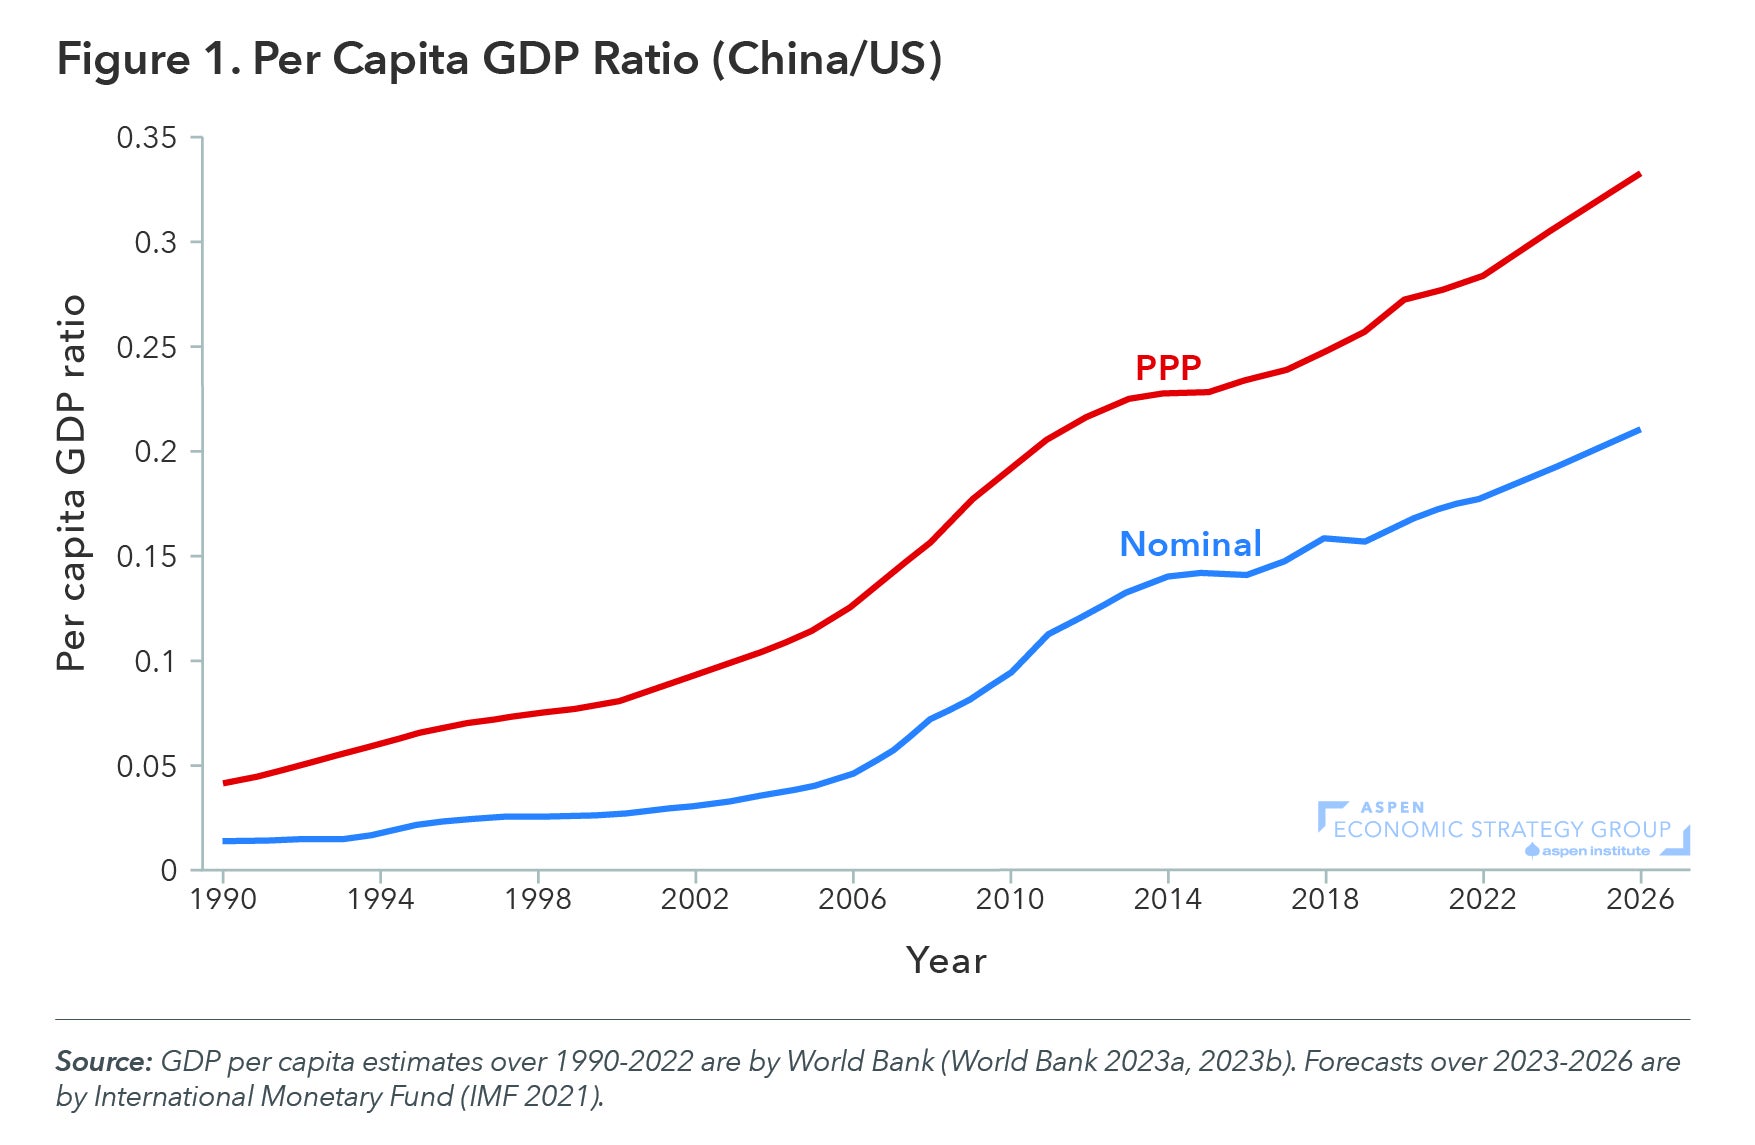
Figure 3: Annual FDA Drug Approvals by Product Type, 1998-2020
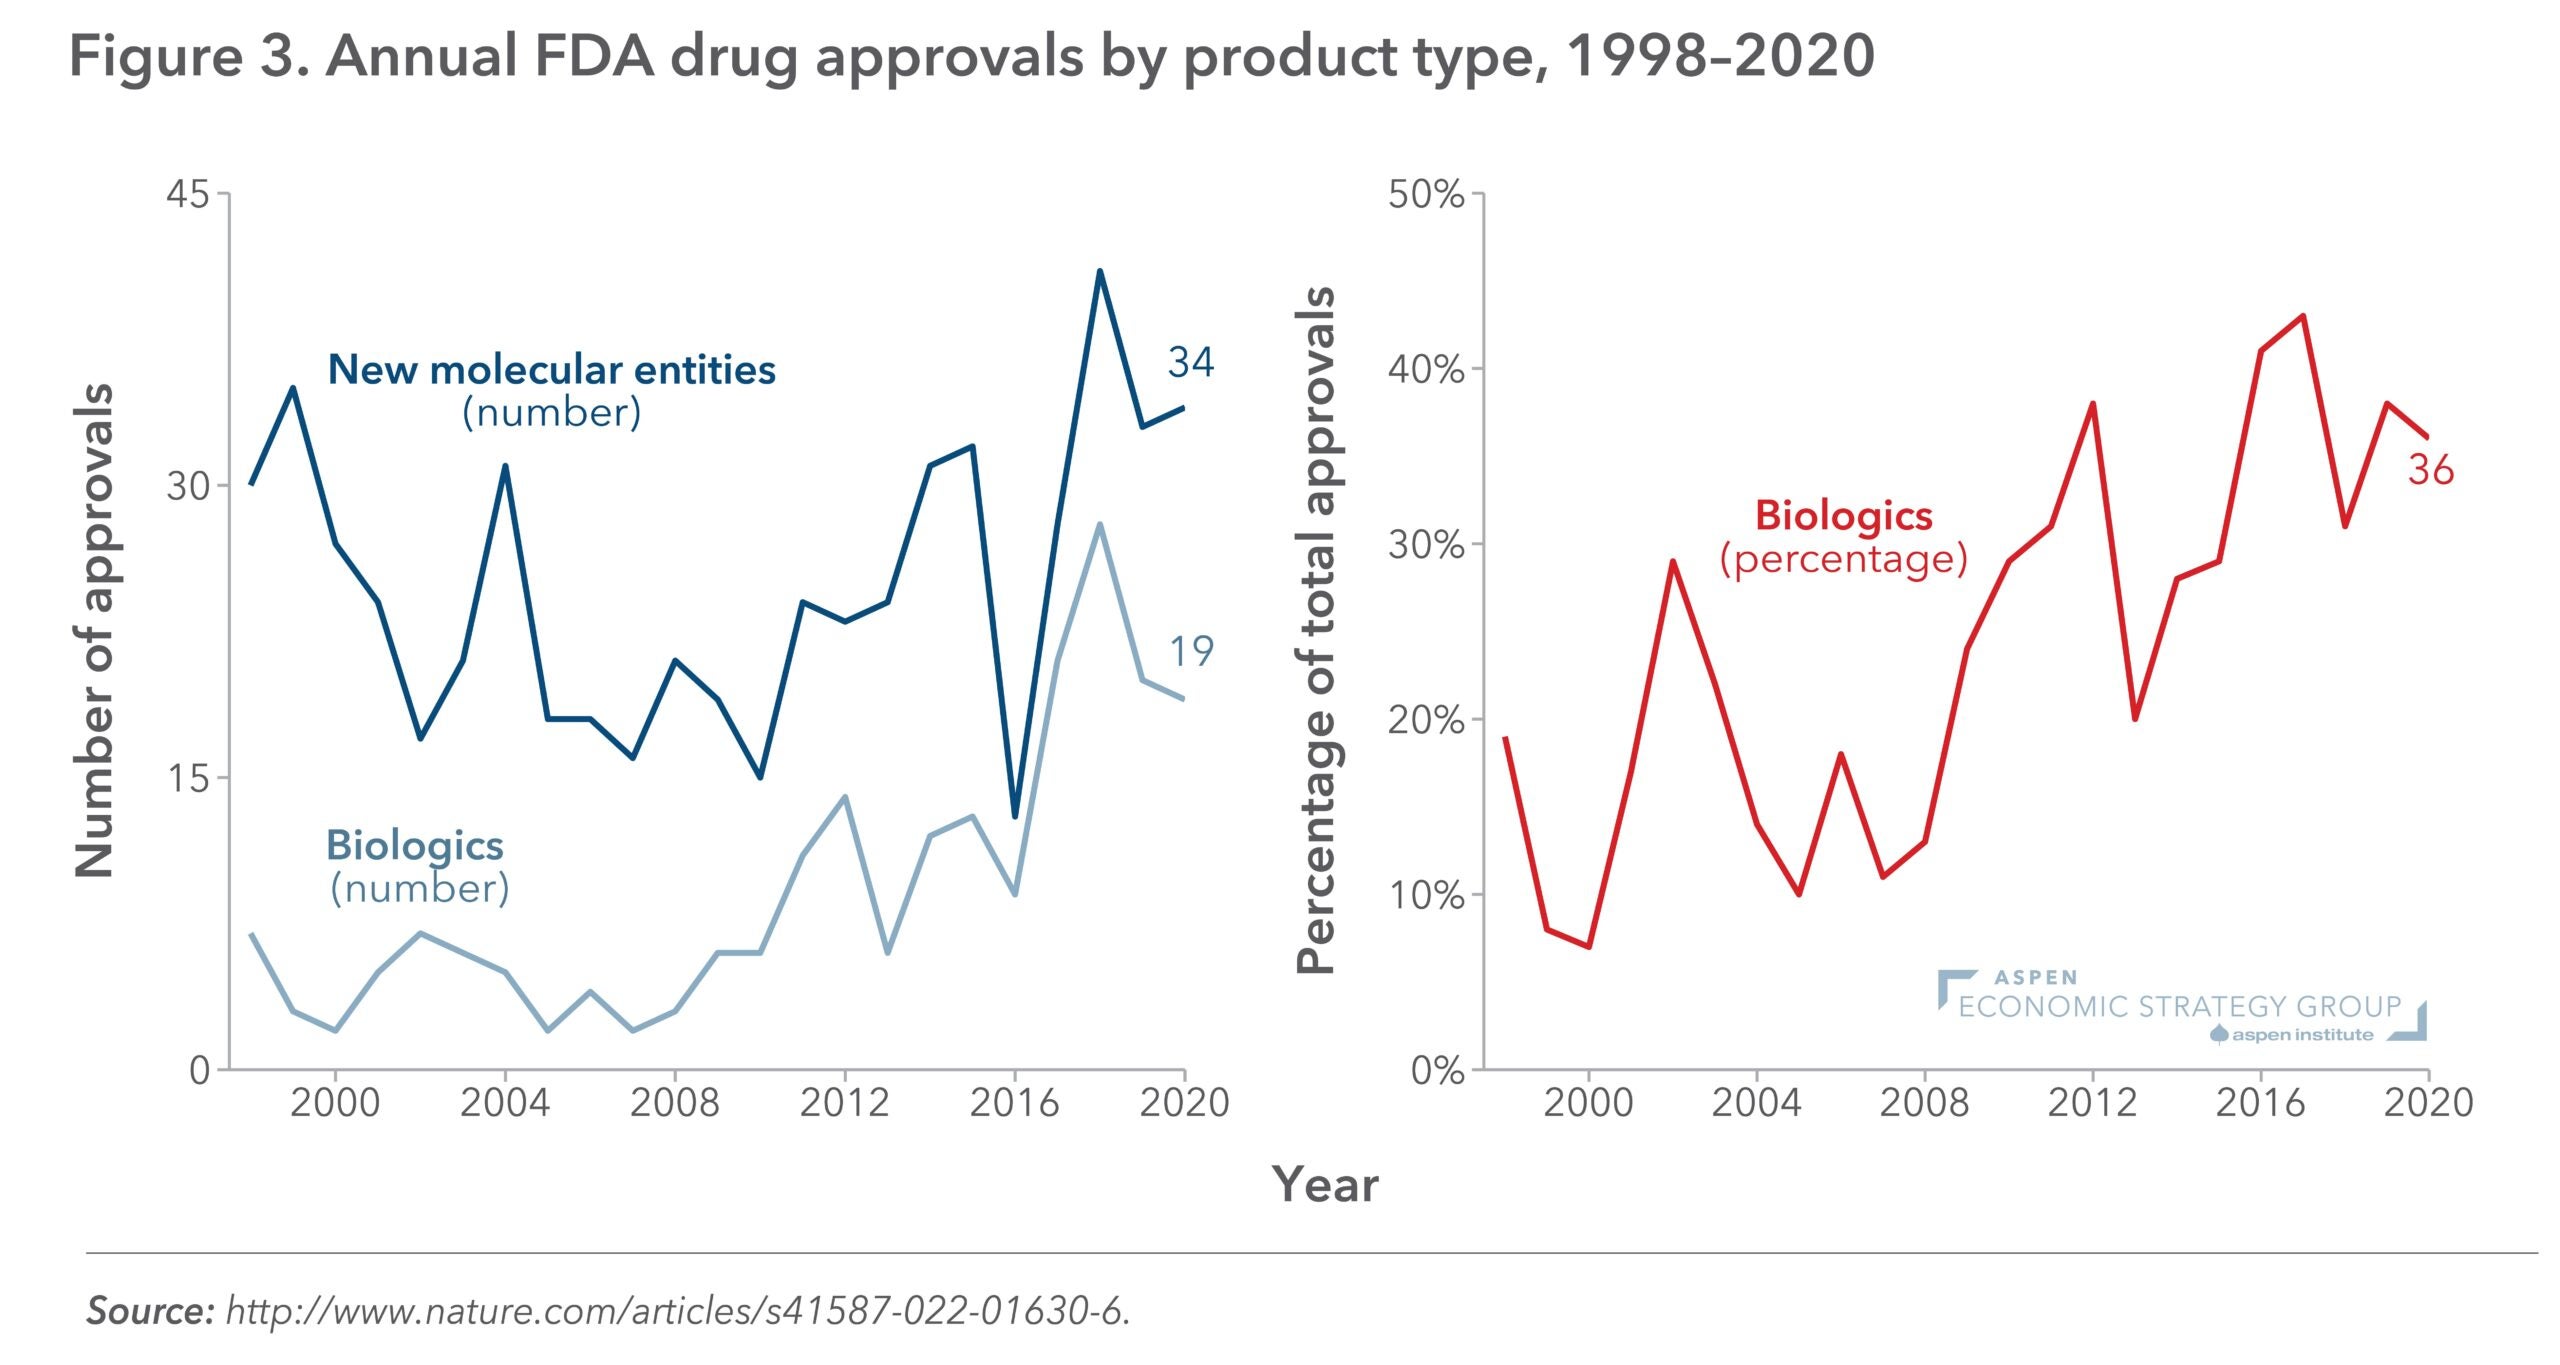
Figure 2: Consumer Spending in Billions, Small vs. Large-Molecule Products, 2013-2017
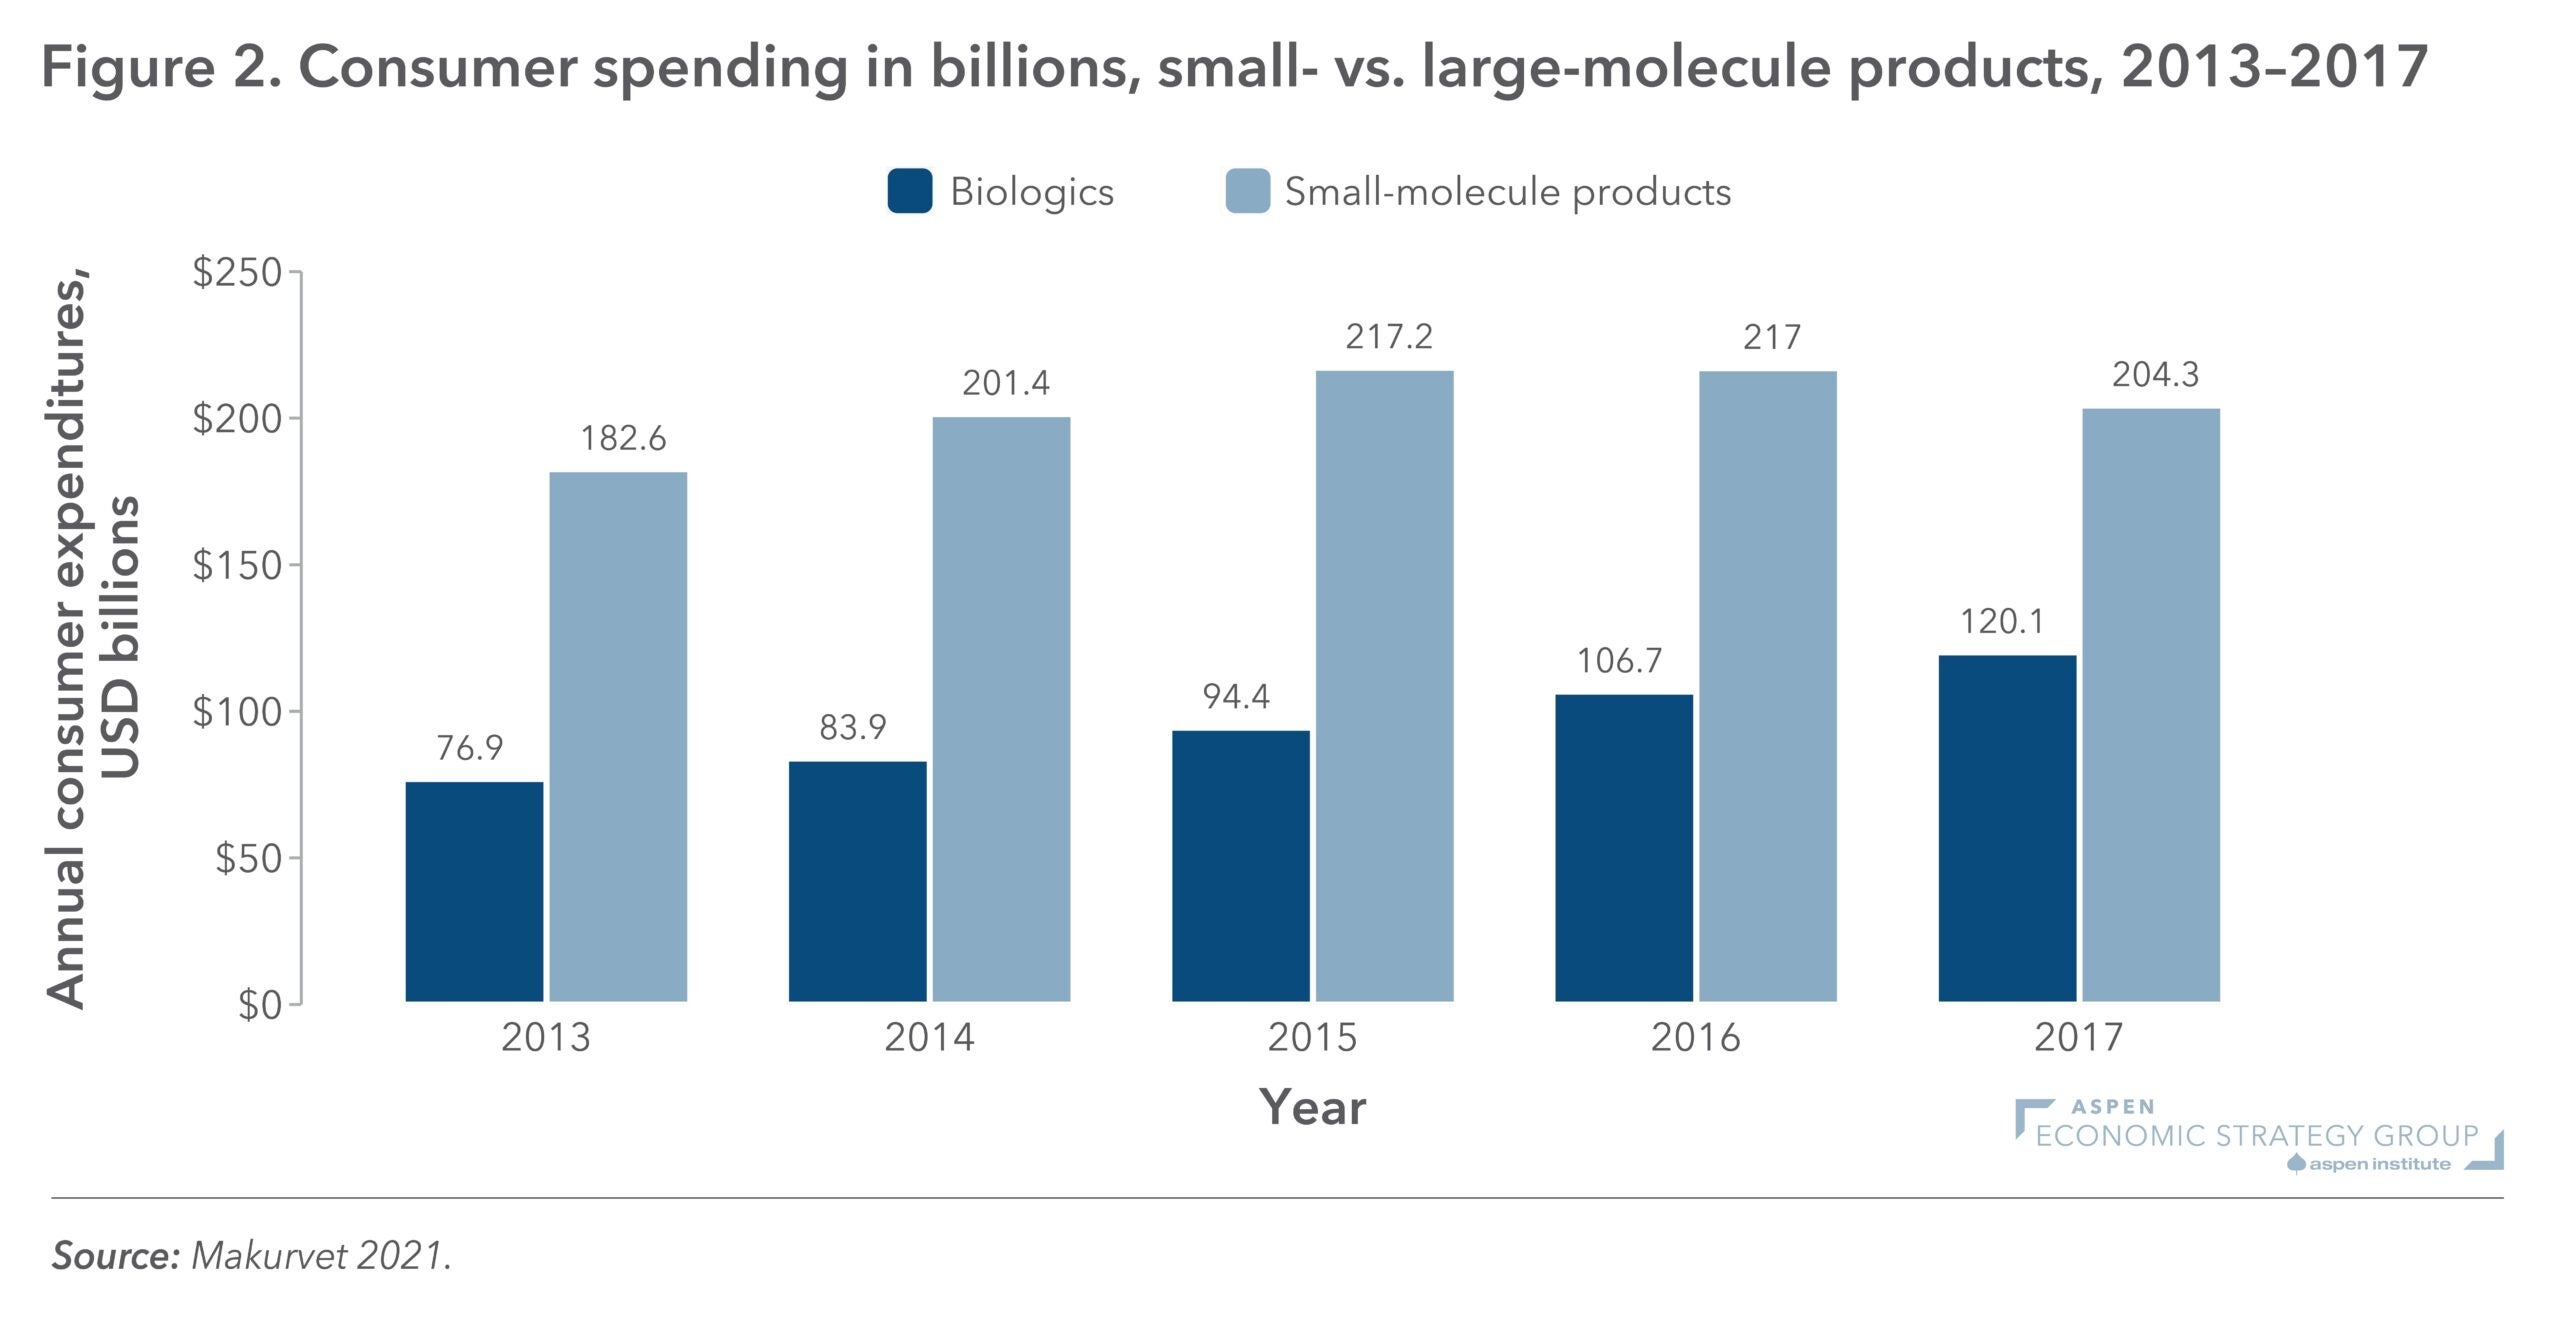
Figure 2: Pandemic-Induced Learning Loss Higher for Minority School Districts and Share of Students Learning Remotely
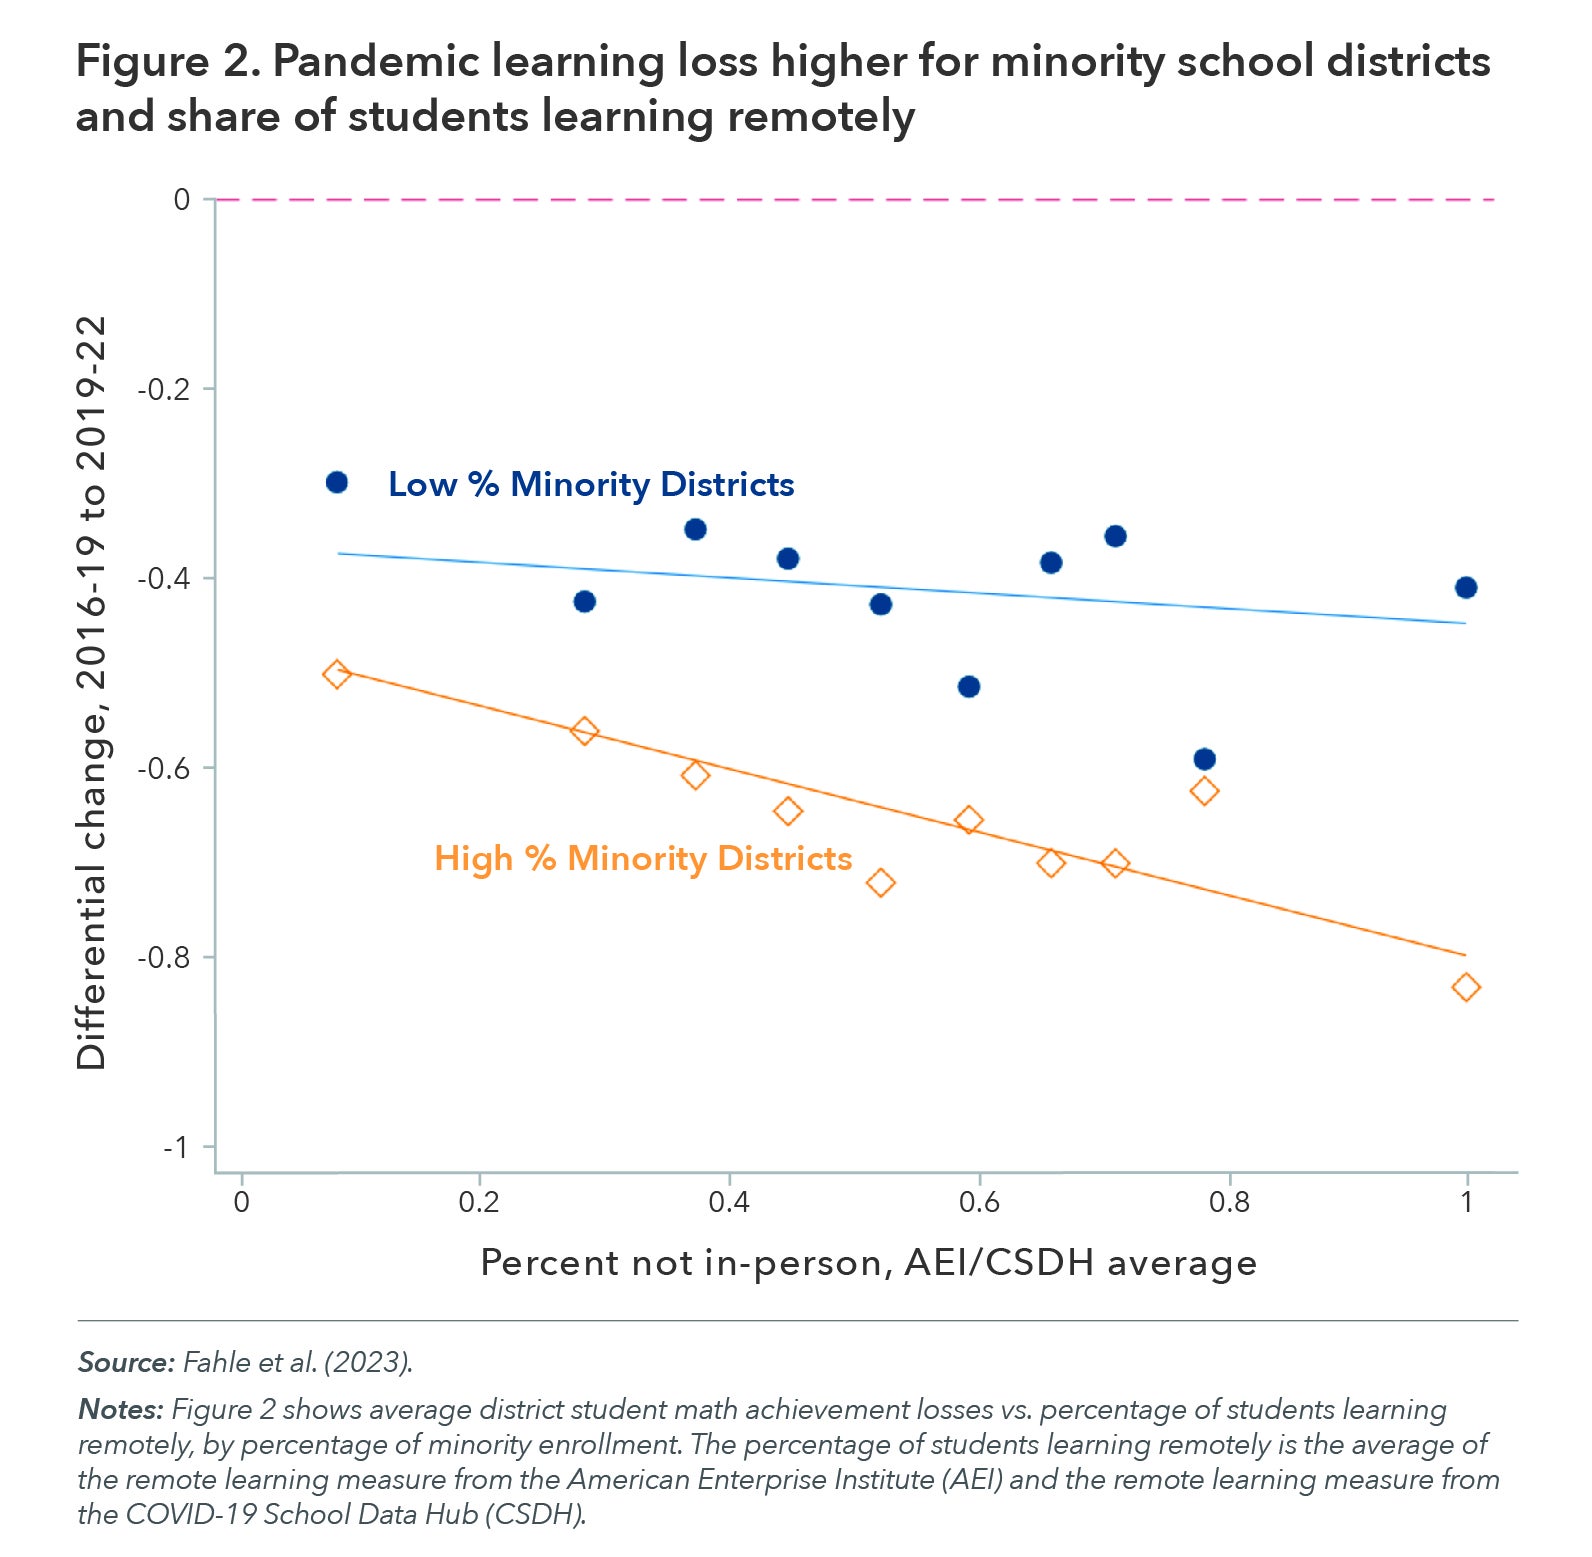
From, “Overcoming Pandemic-Induced Learning Loss,” by Jonathan Guryan and Jens Ludwig.
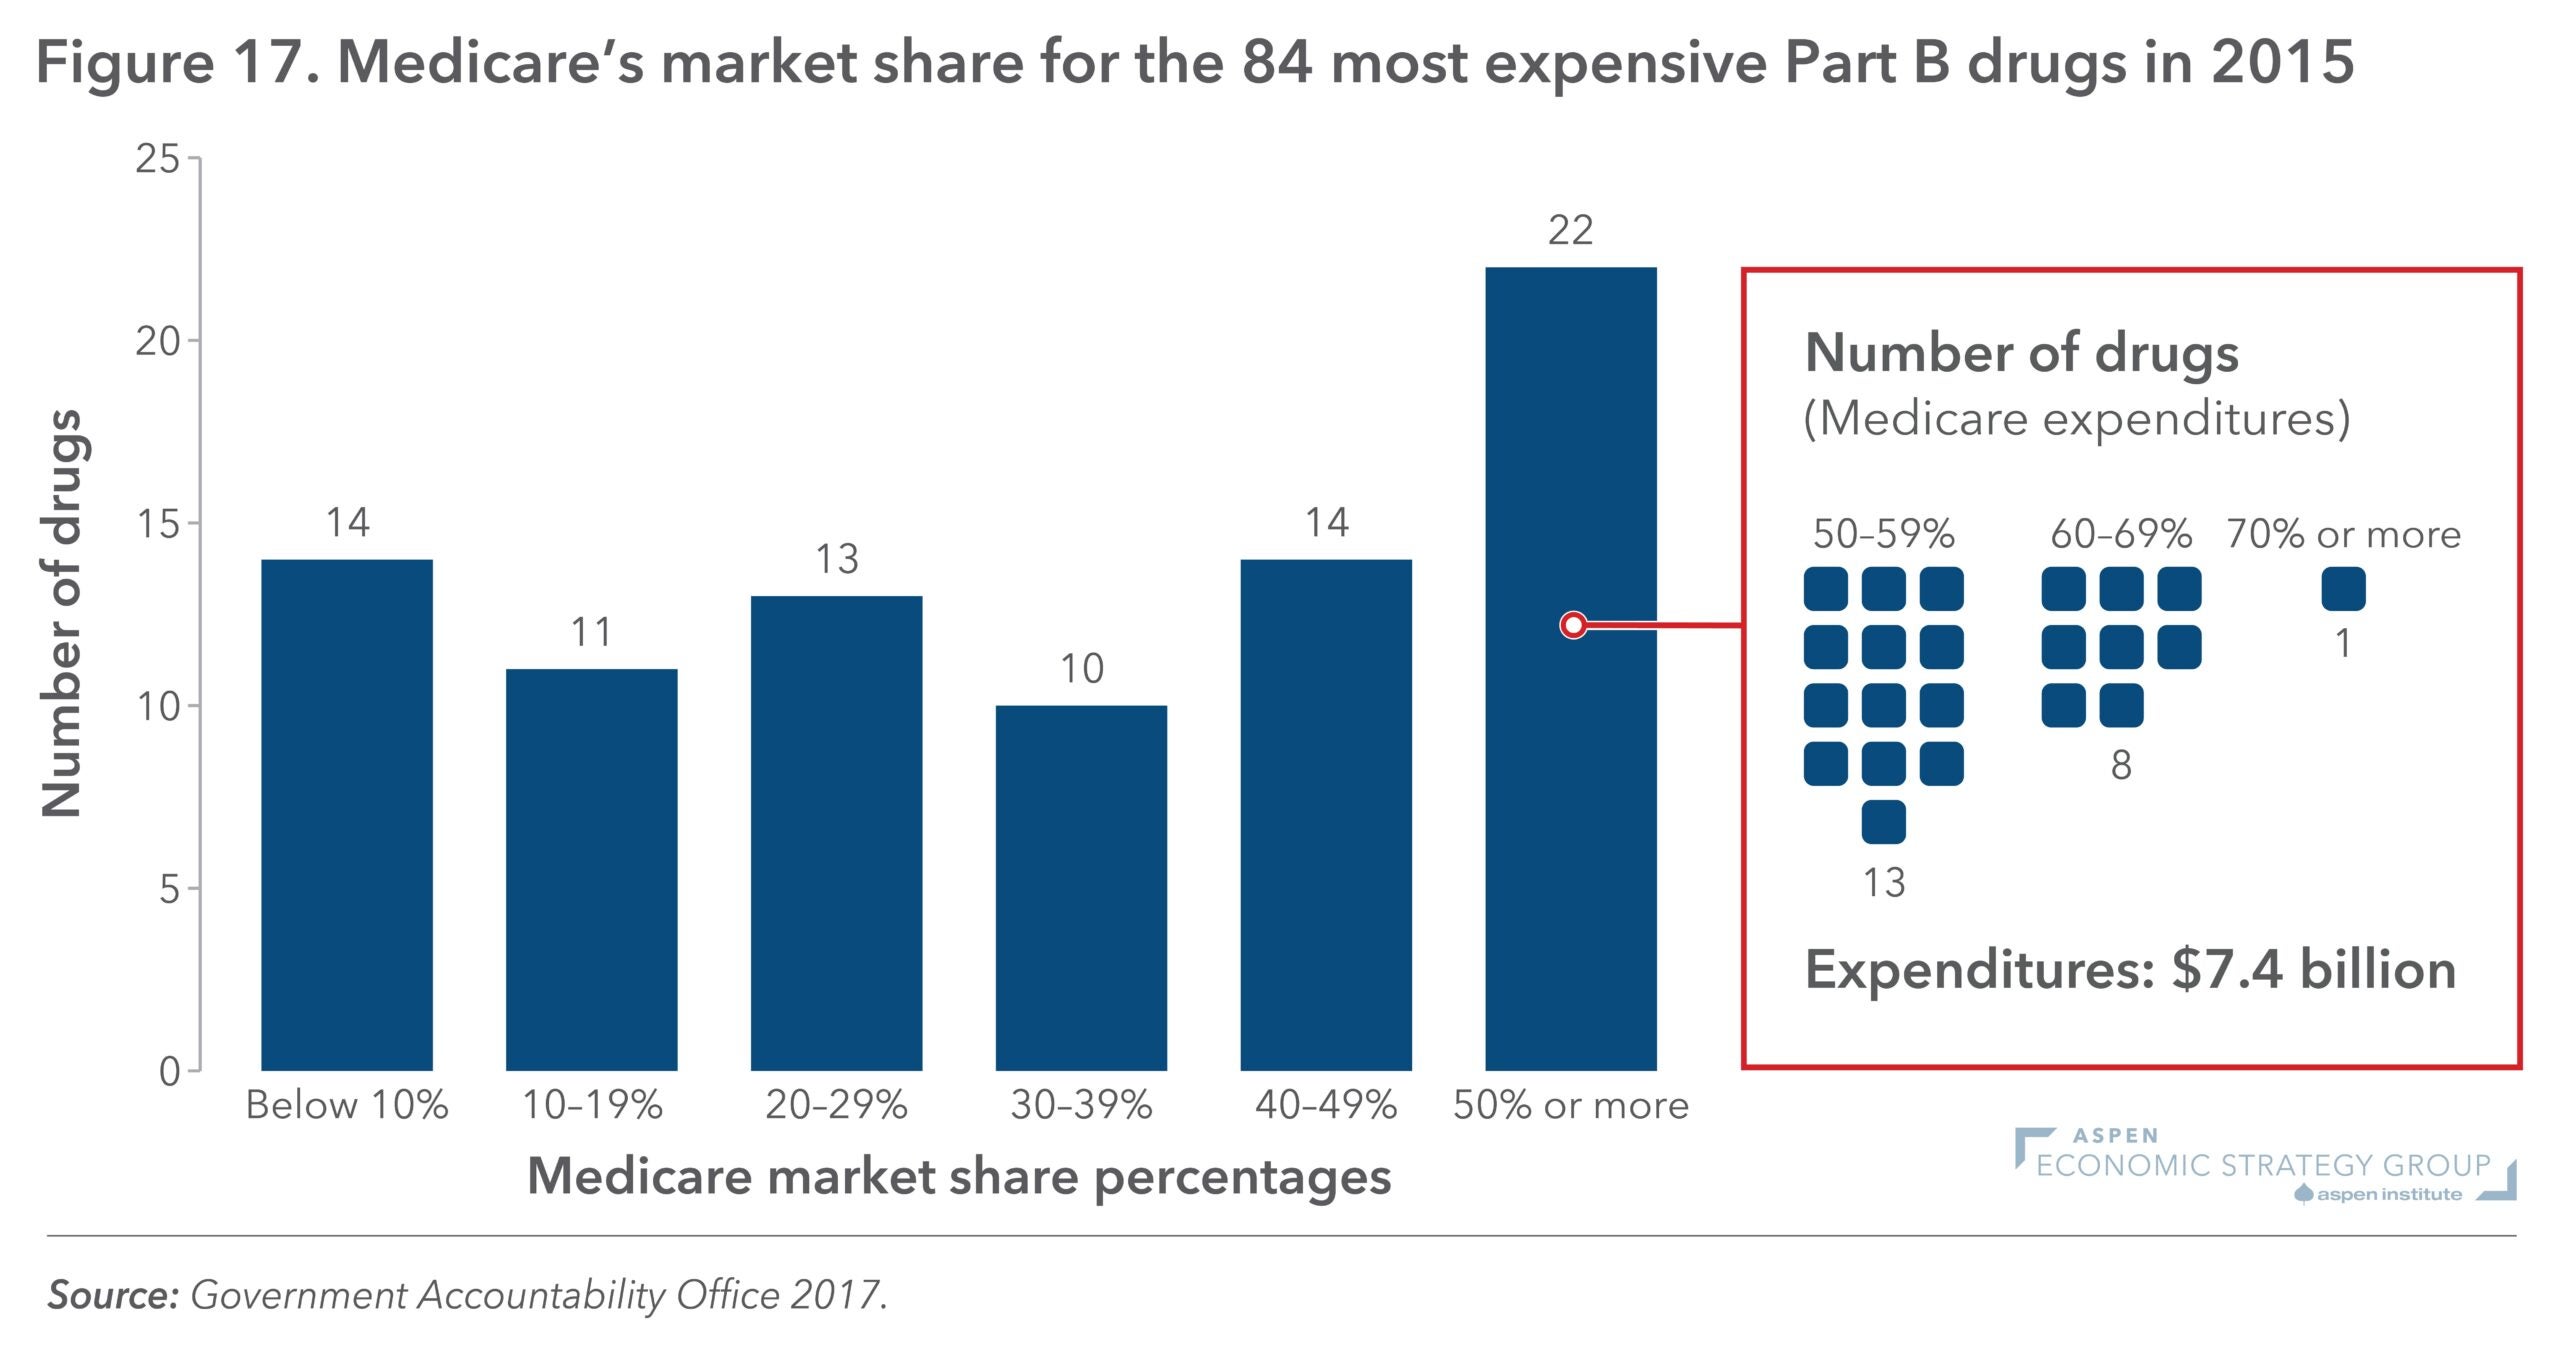
Figure 17: Medicare’s Market Share for the 84 Most Expensive Part B Drugs in 2015