Archives: Publications
These are AIESG Publications
Figure 2(a): CBO Projections for Federal Spending and Revenues, 2008–2053
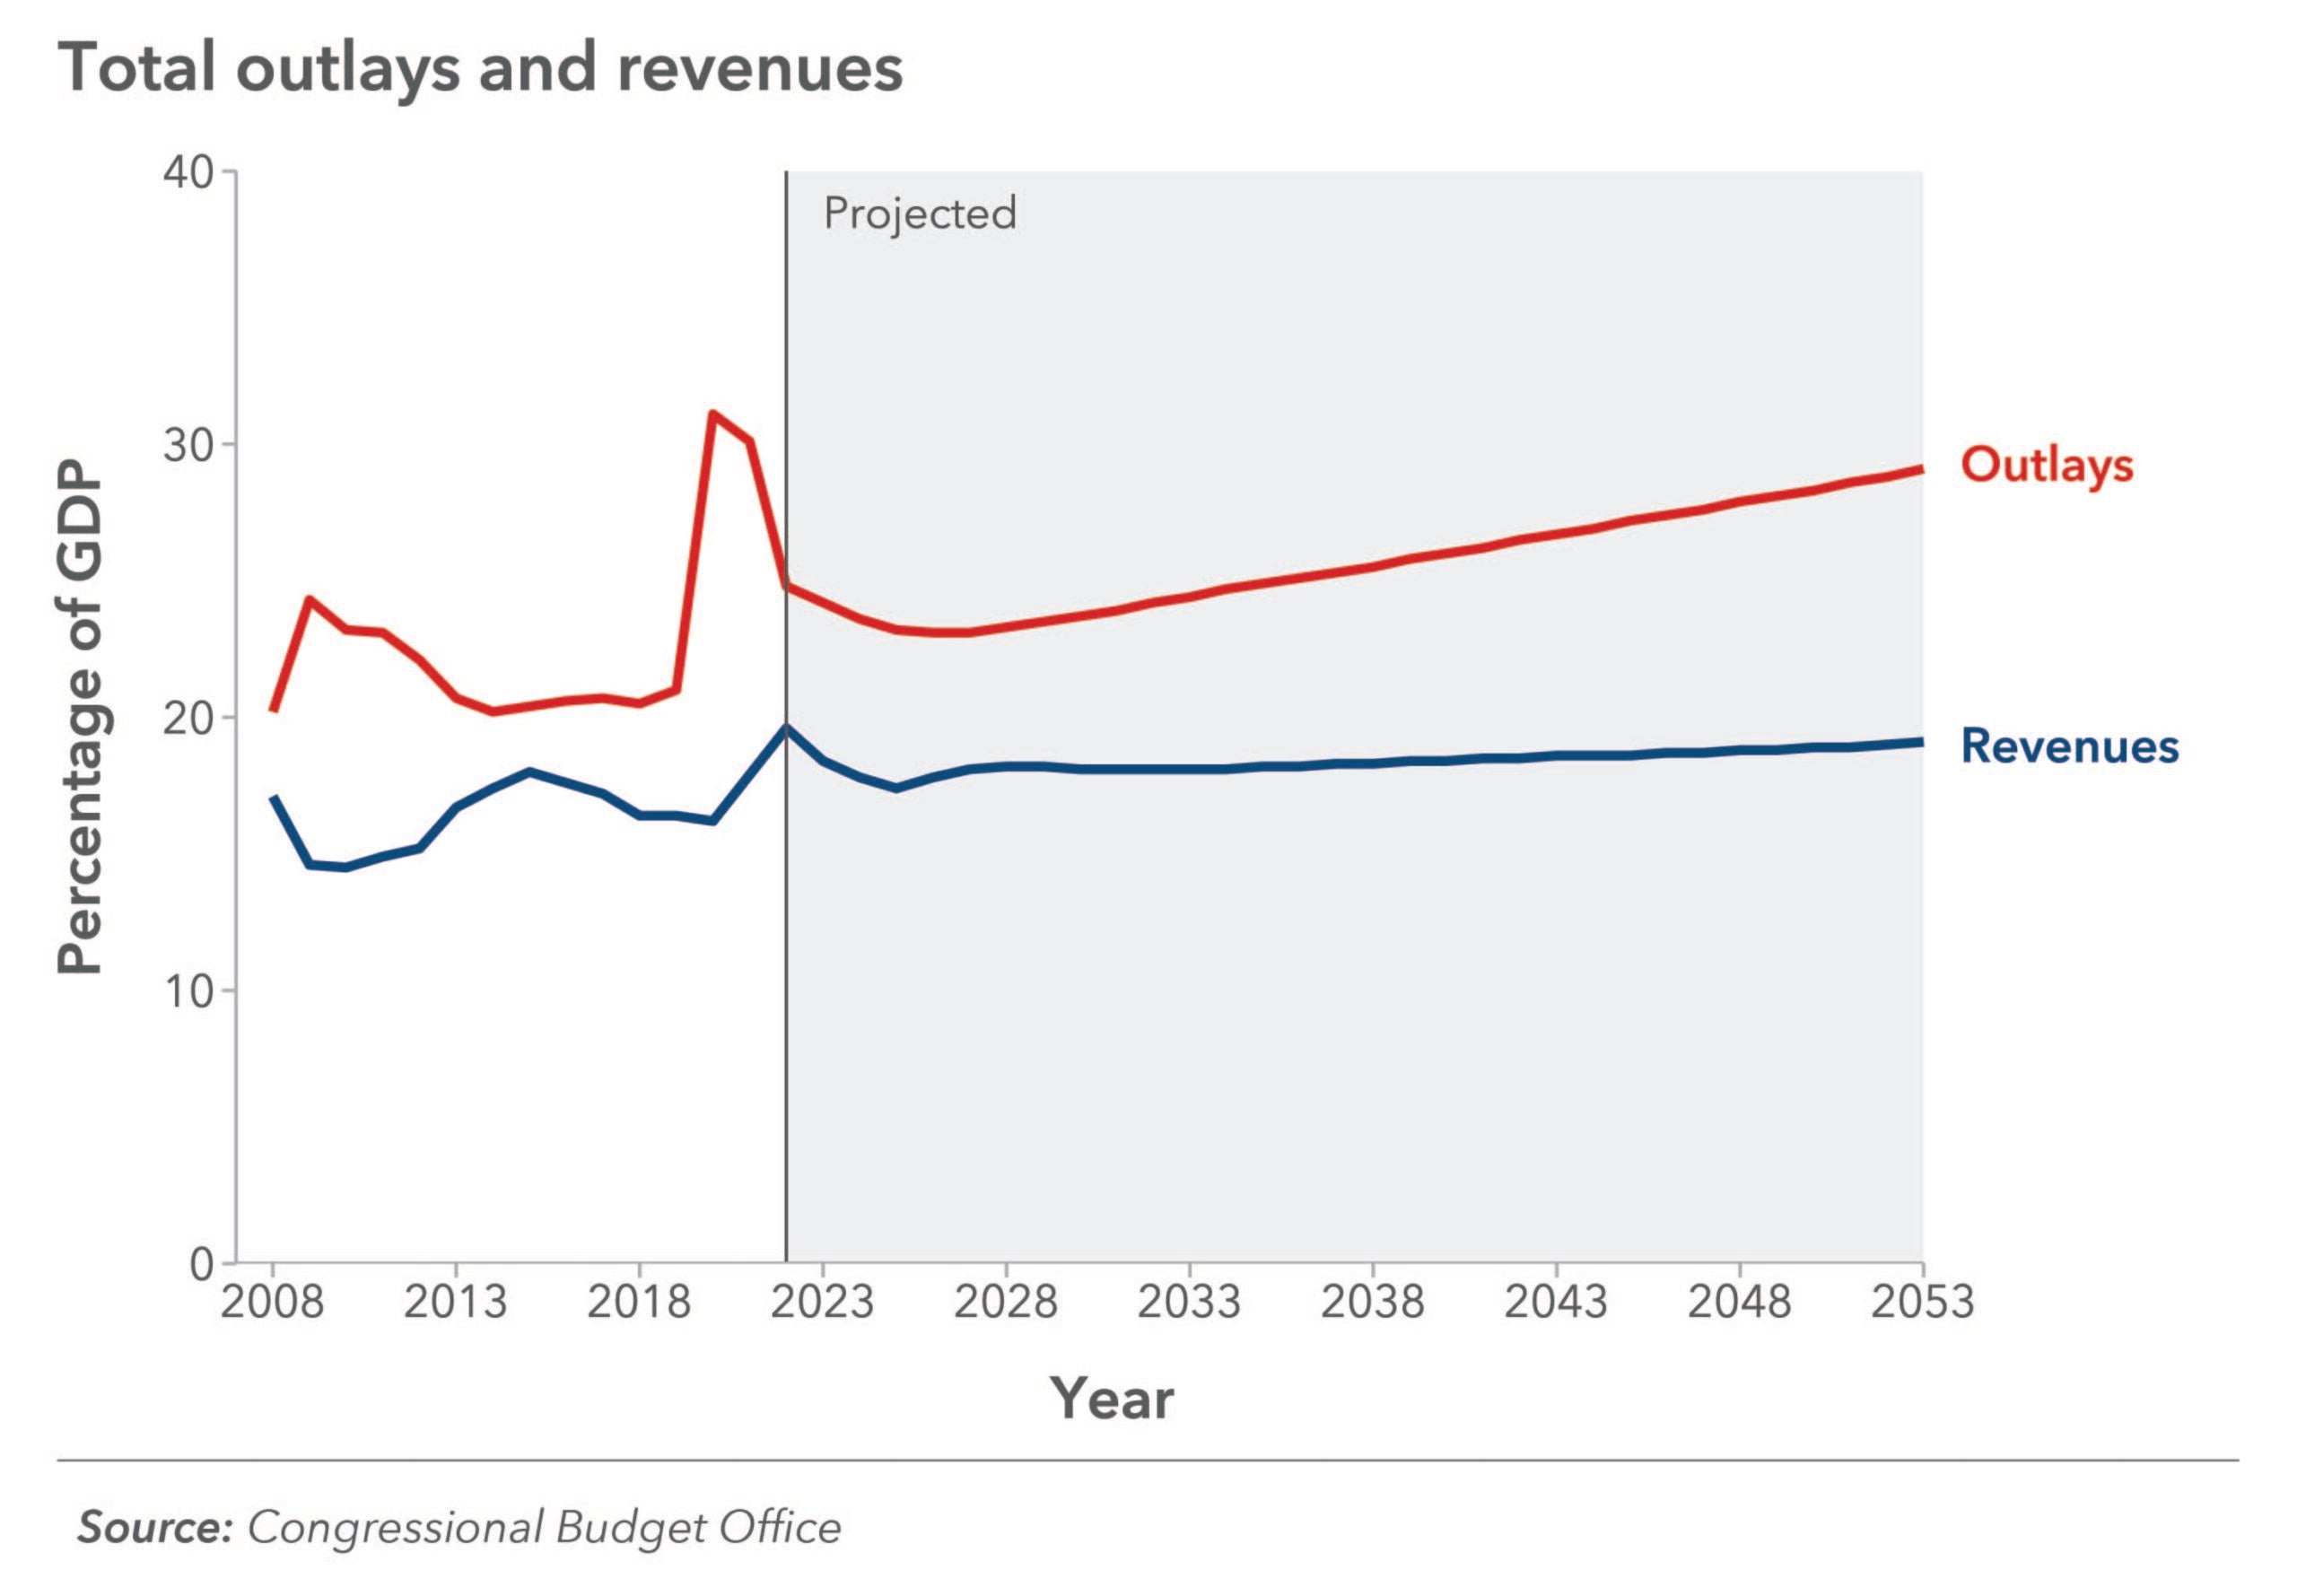
Figure 10: Average federal tax rates by income bracket, 1979-2019
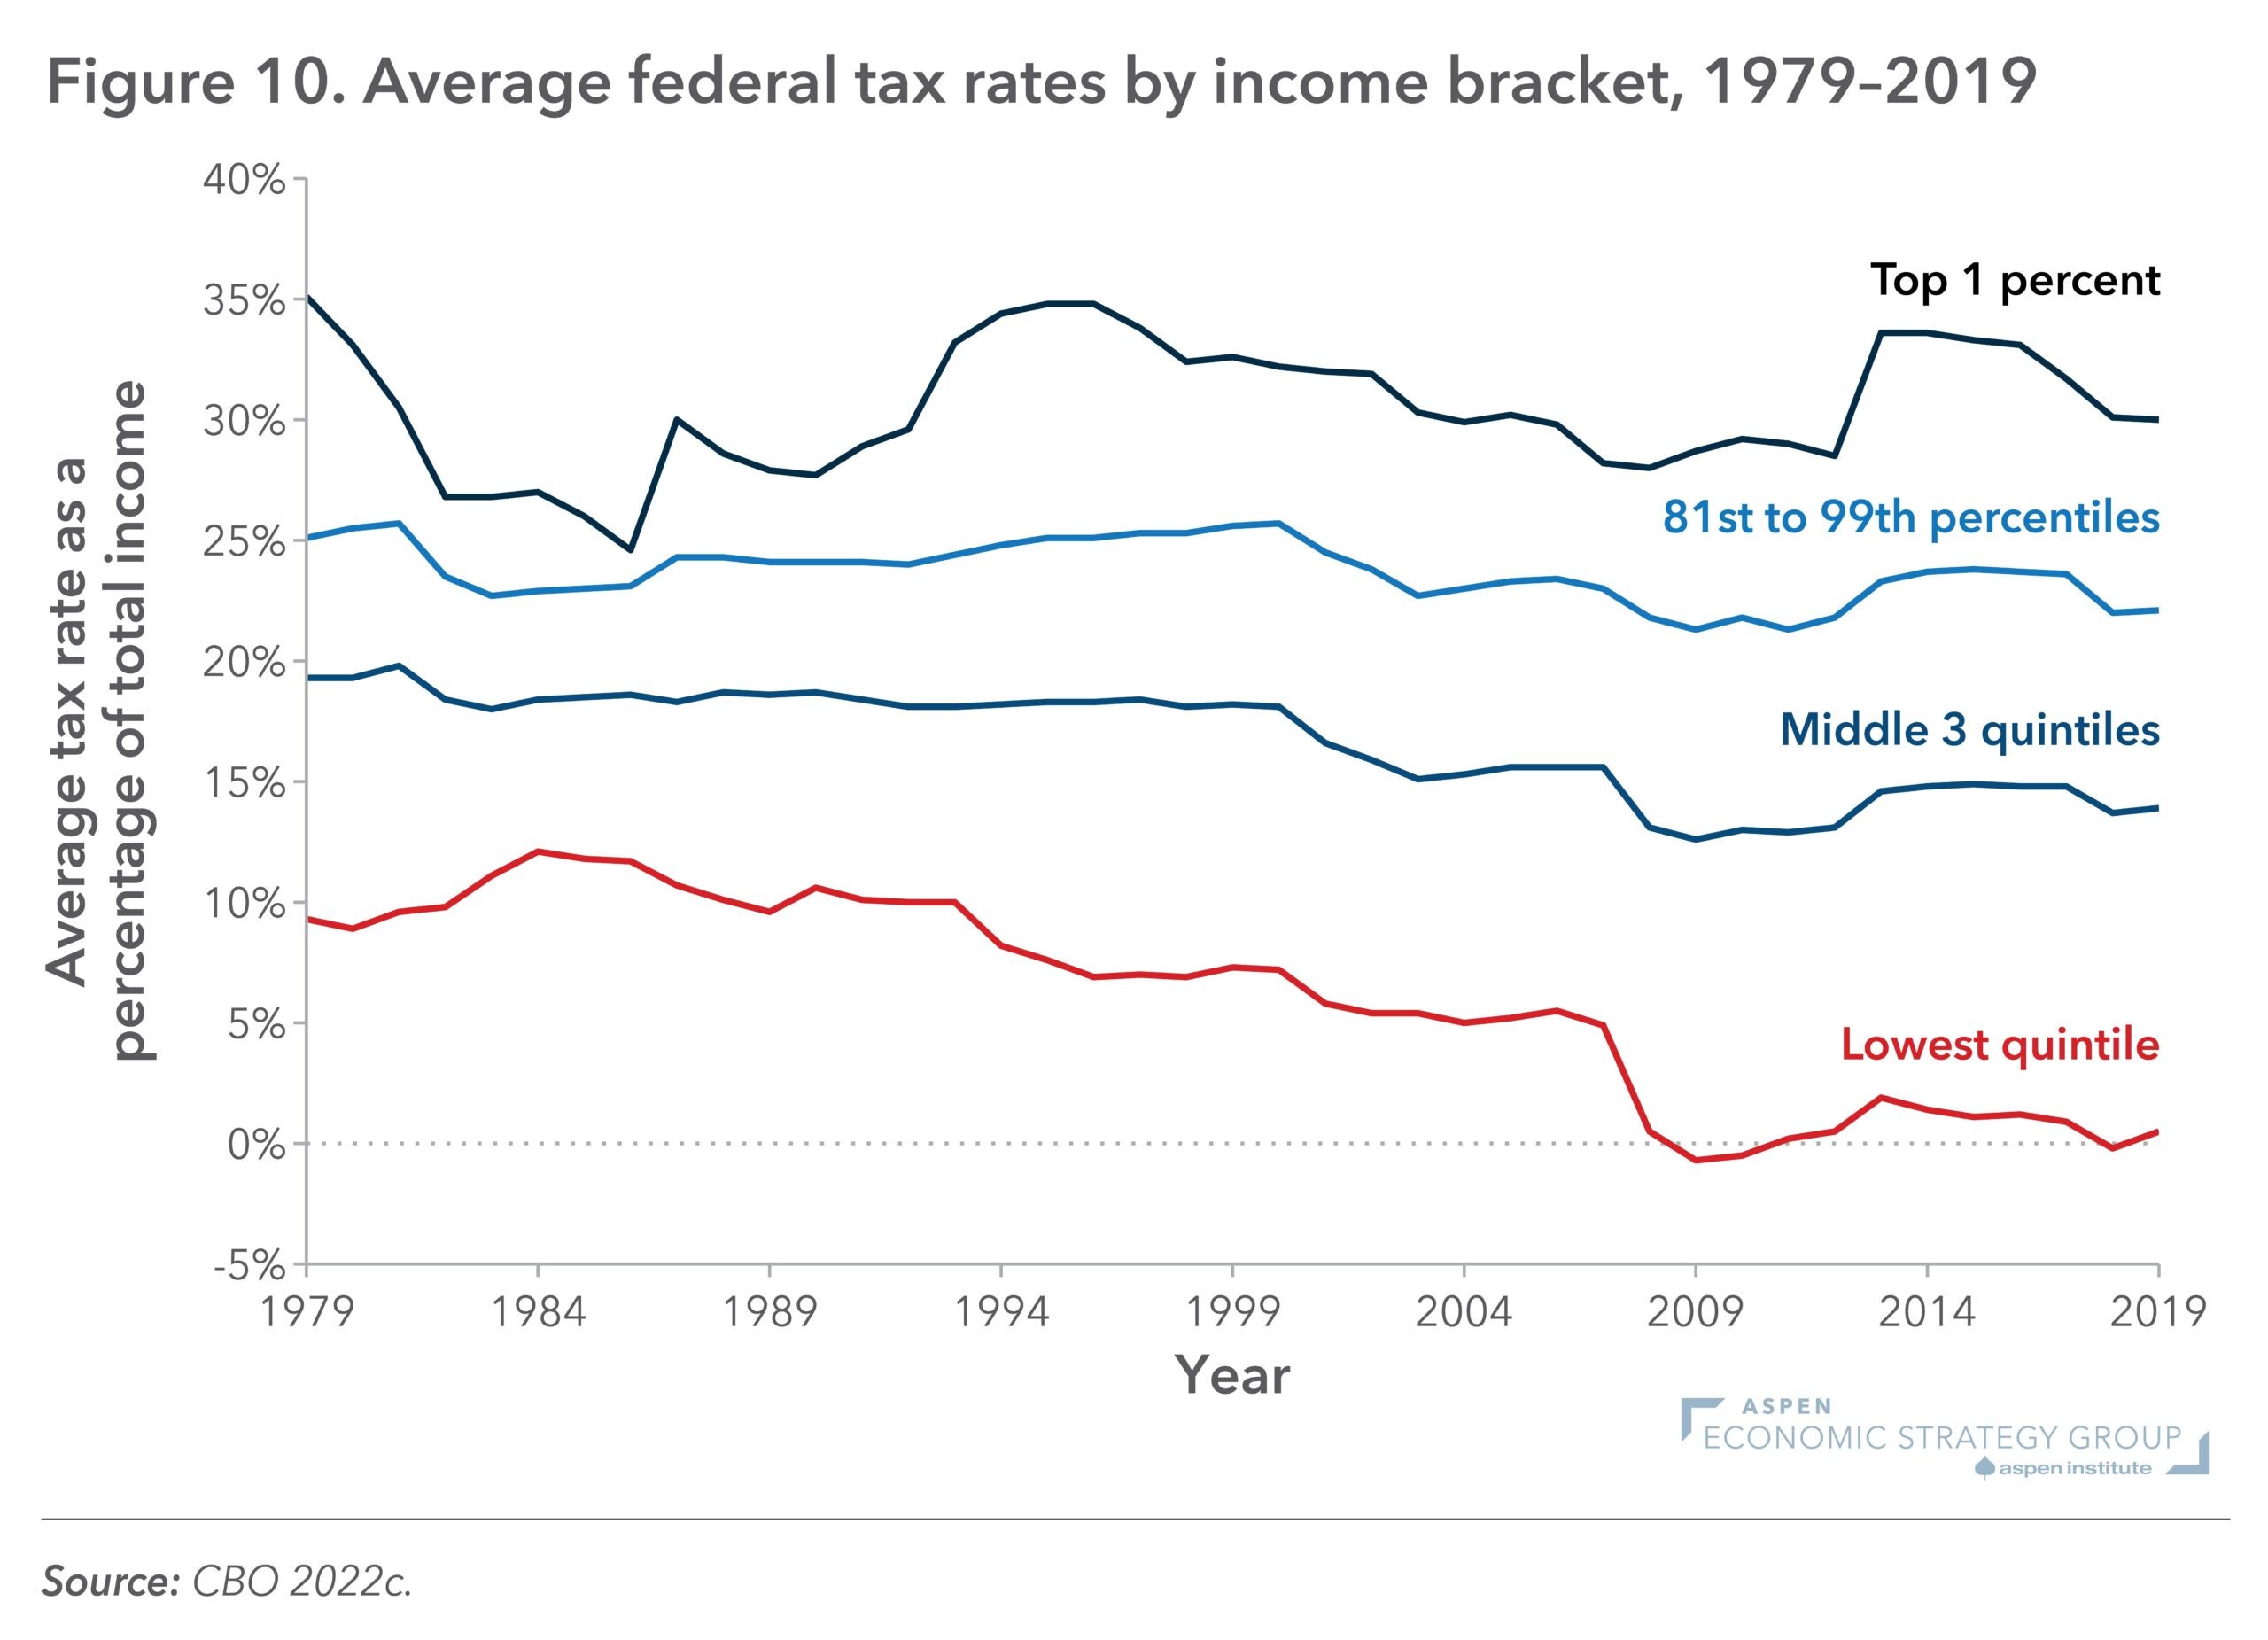
Figure 11: The Median Medicare Part D Plan: Total Cost by Drug
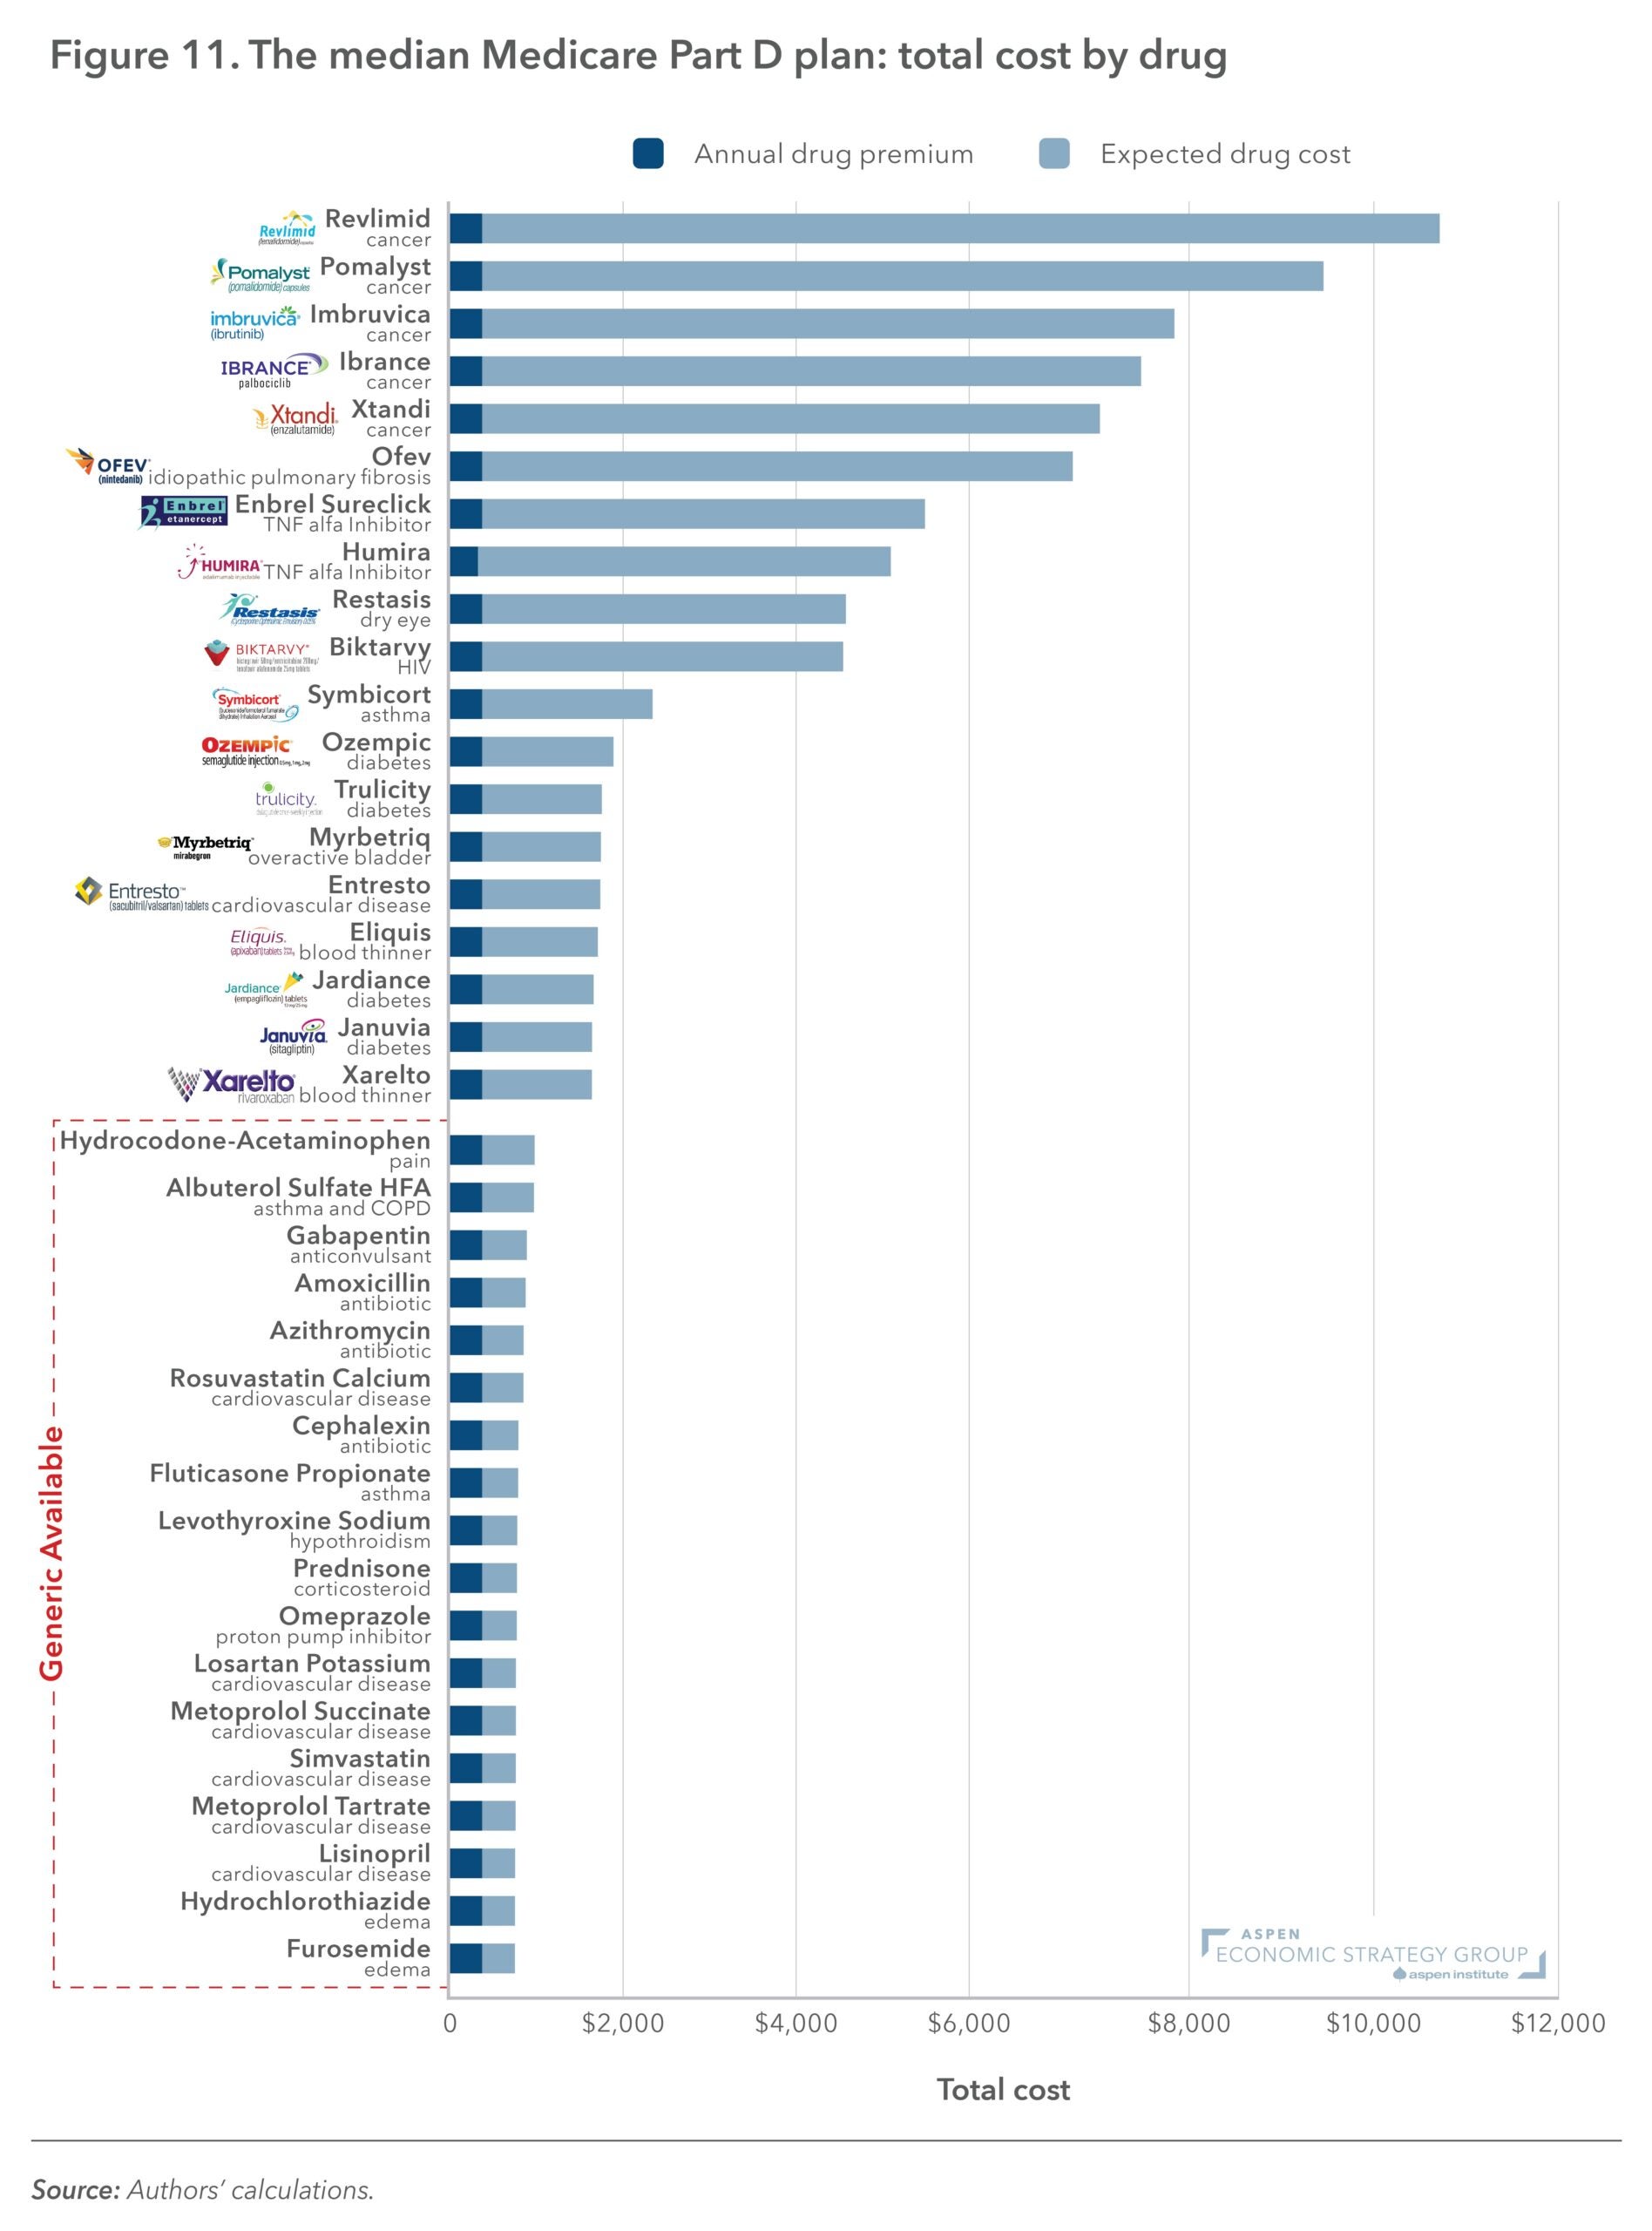
From, “Why Drug Pricing Reform is Complicated: A Primer and Policy Guide to Pharmaceutical Prices in the US,” by Craig Garthwaite and Amanda Starc.
Figure 7: Actual and projected interest rate on 10-year Treasury notes, 1992-2033
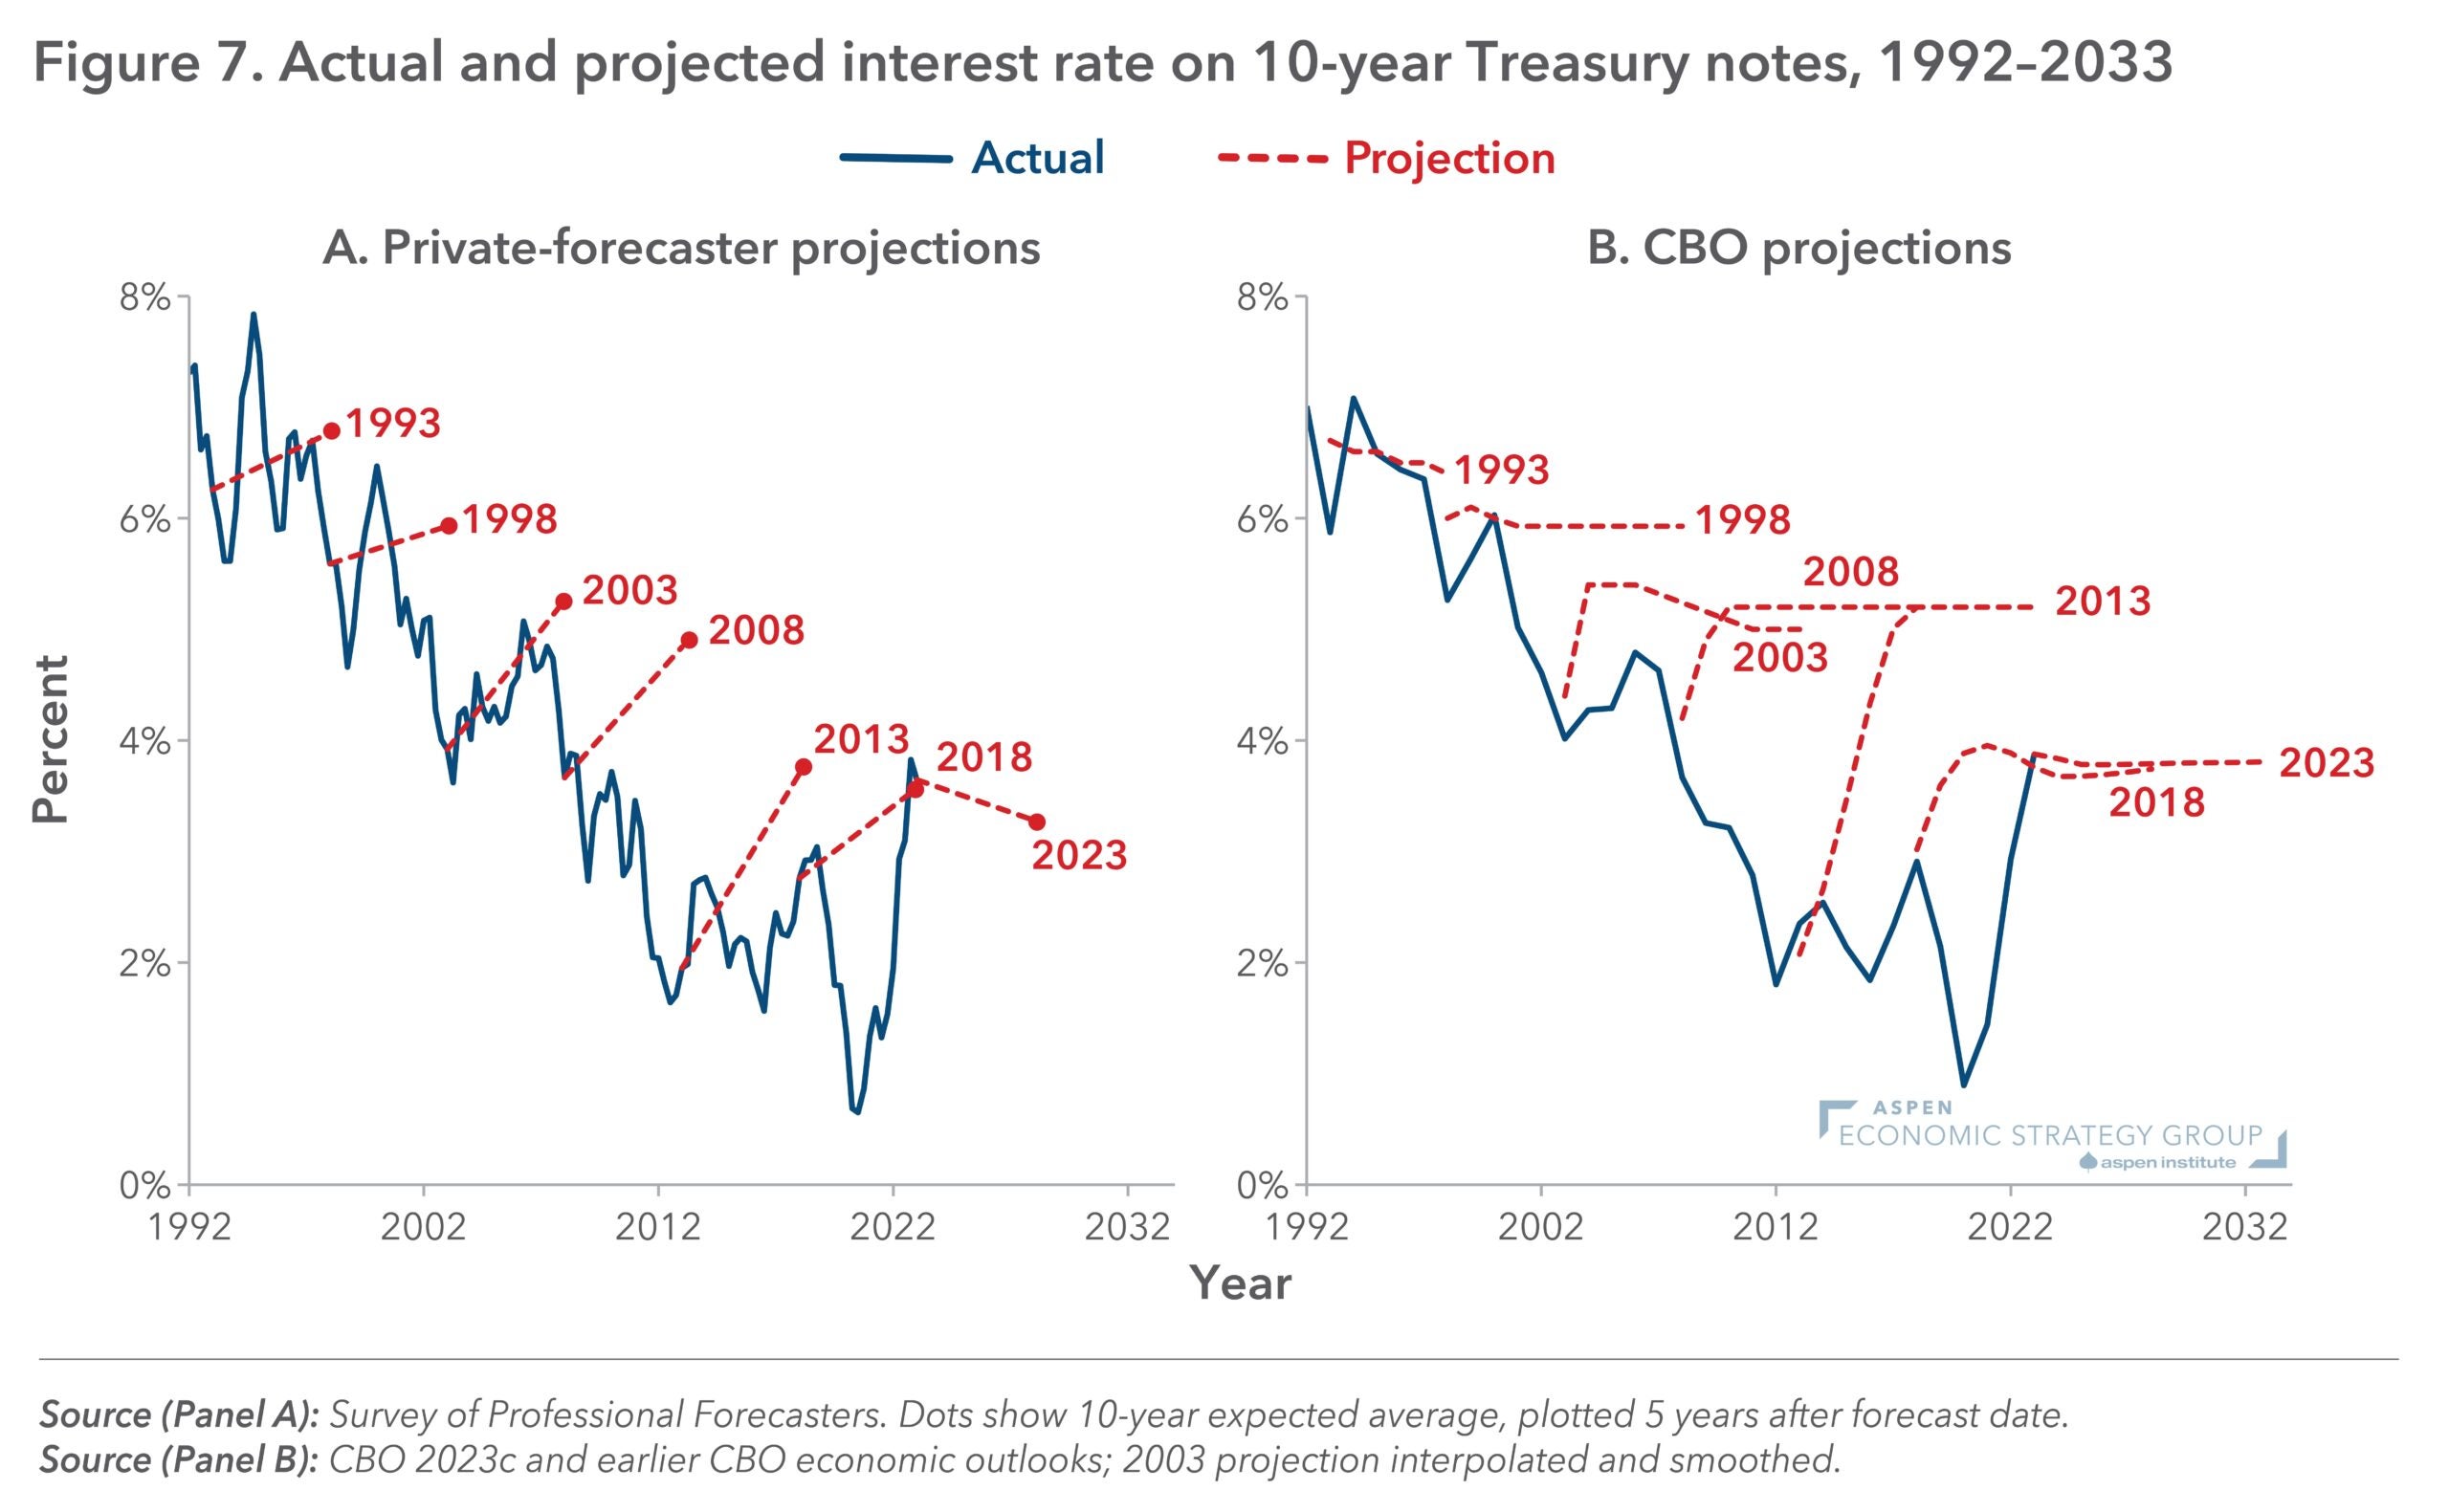
Figure 1: US Medicine Spending Levels and Segmentation by Channel, 2016-2021
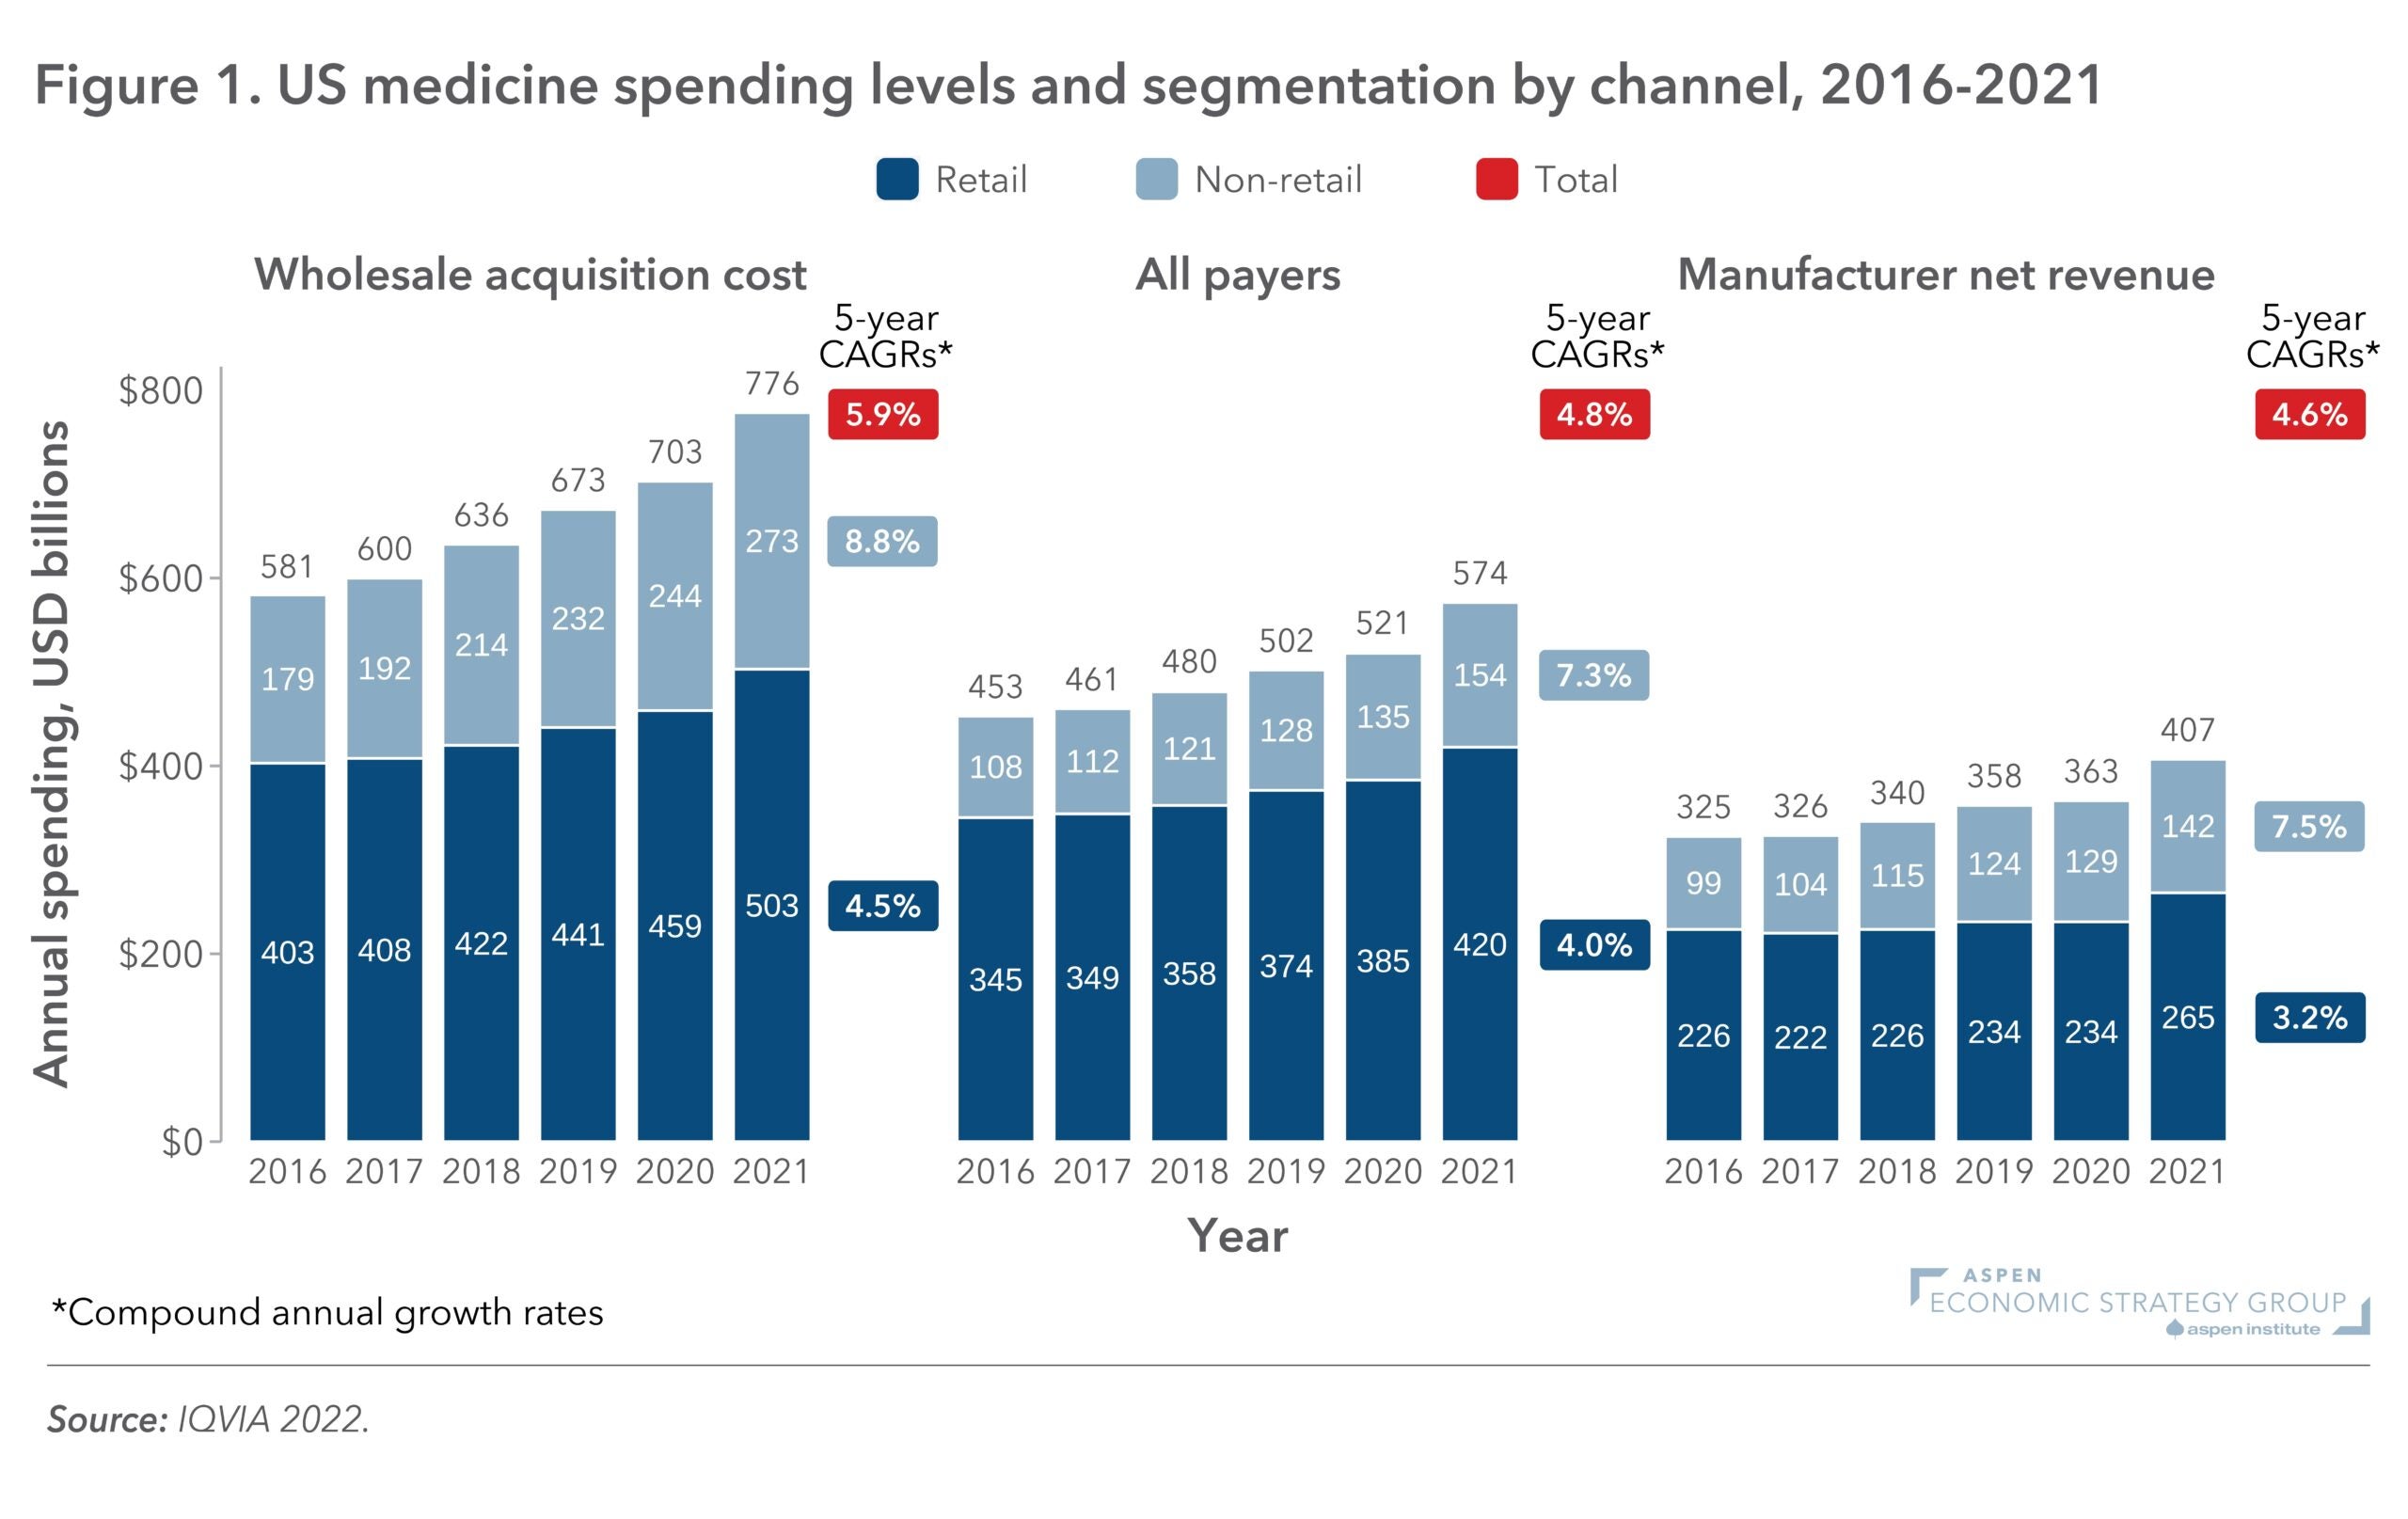
Figure 1: SSA’s projections for the OASDI trust fund: 2004 versus 2023
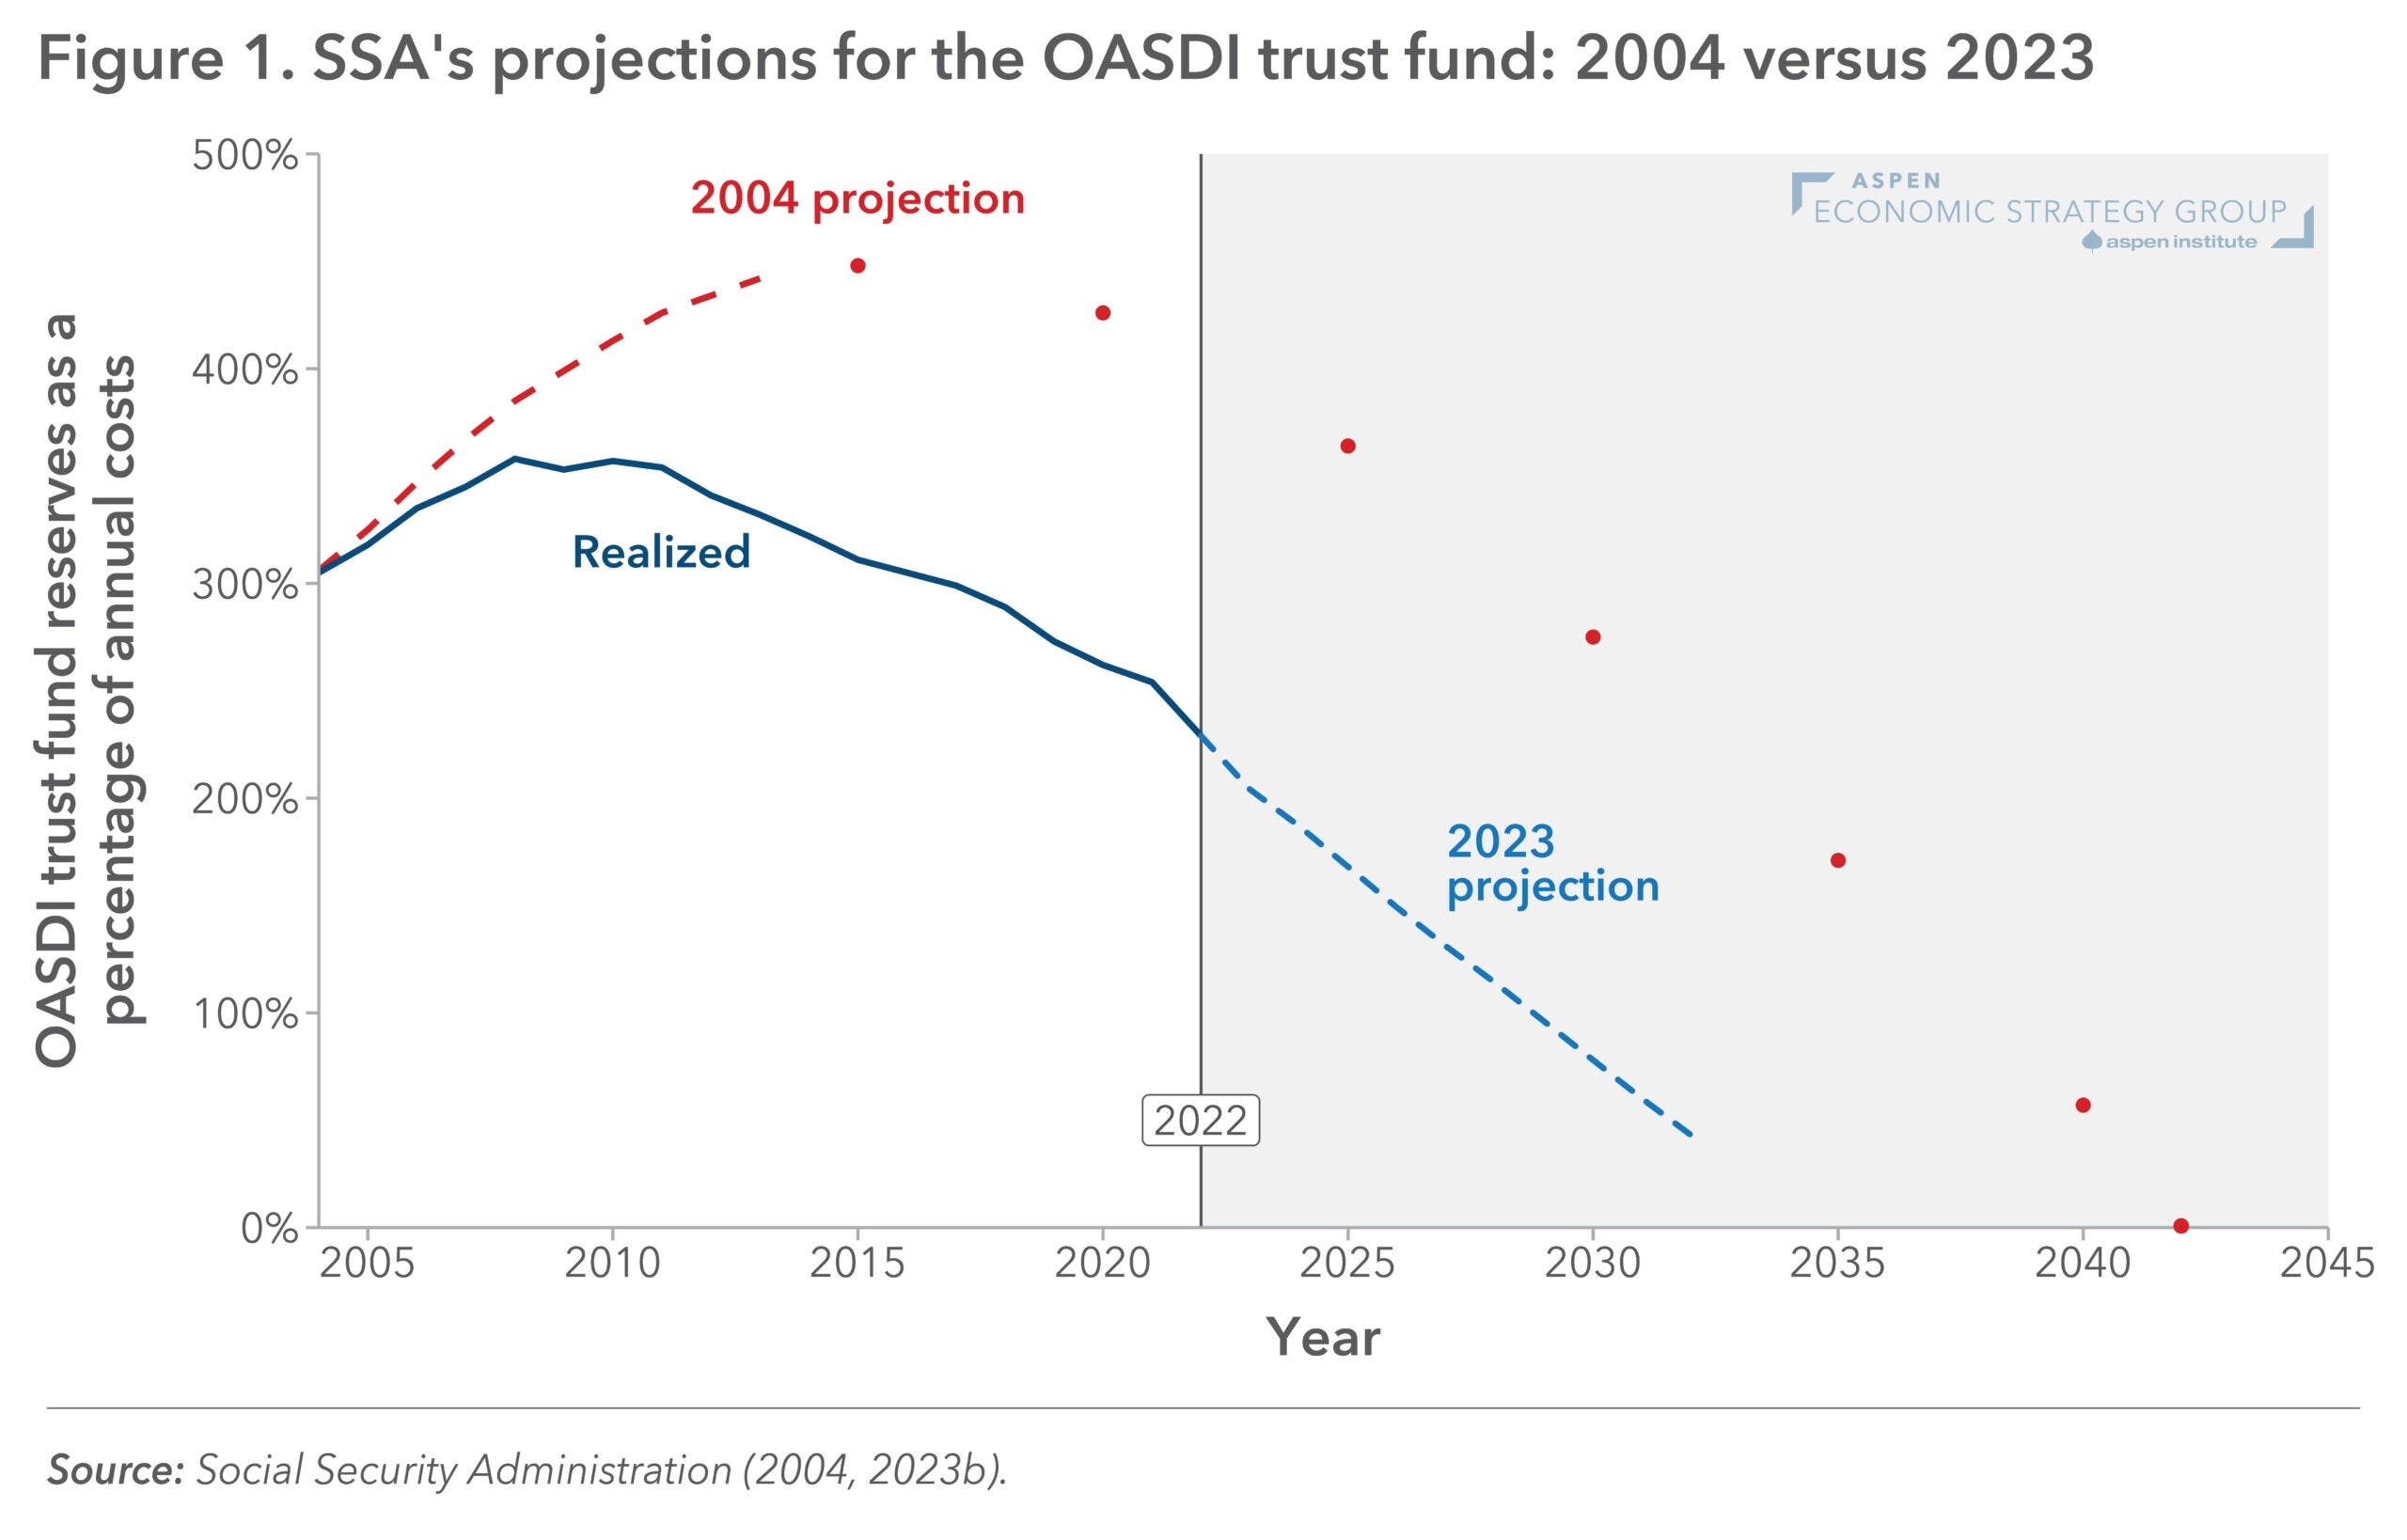
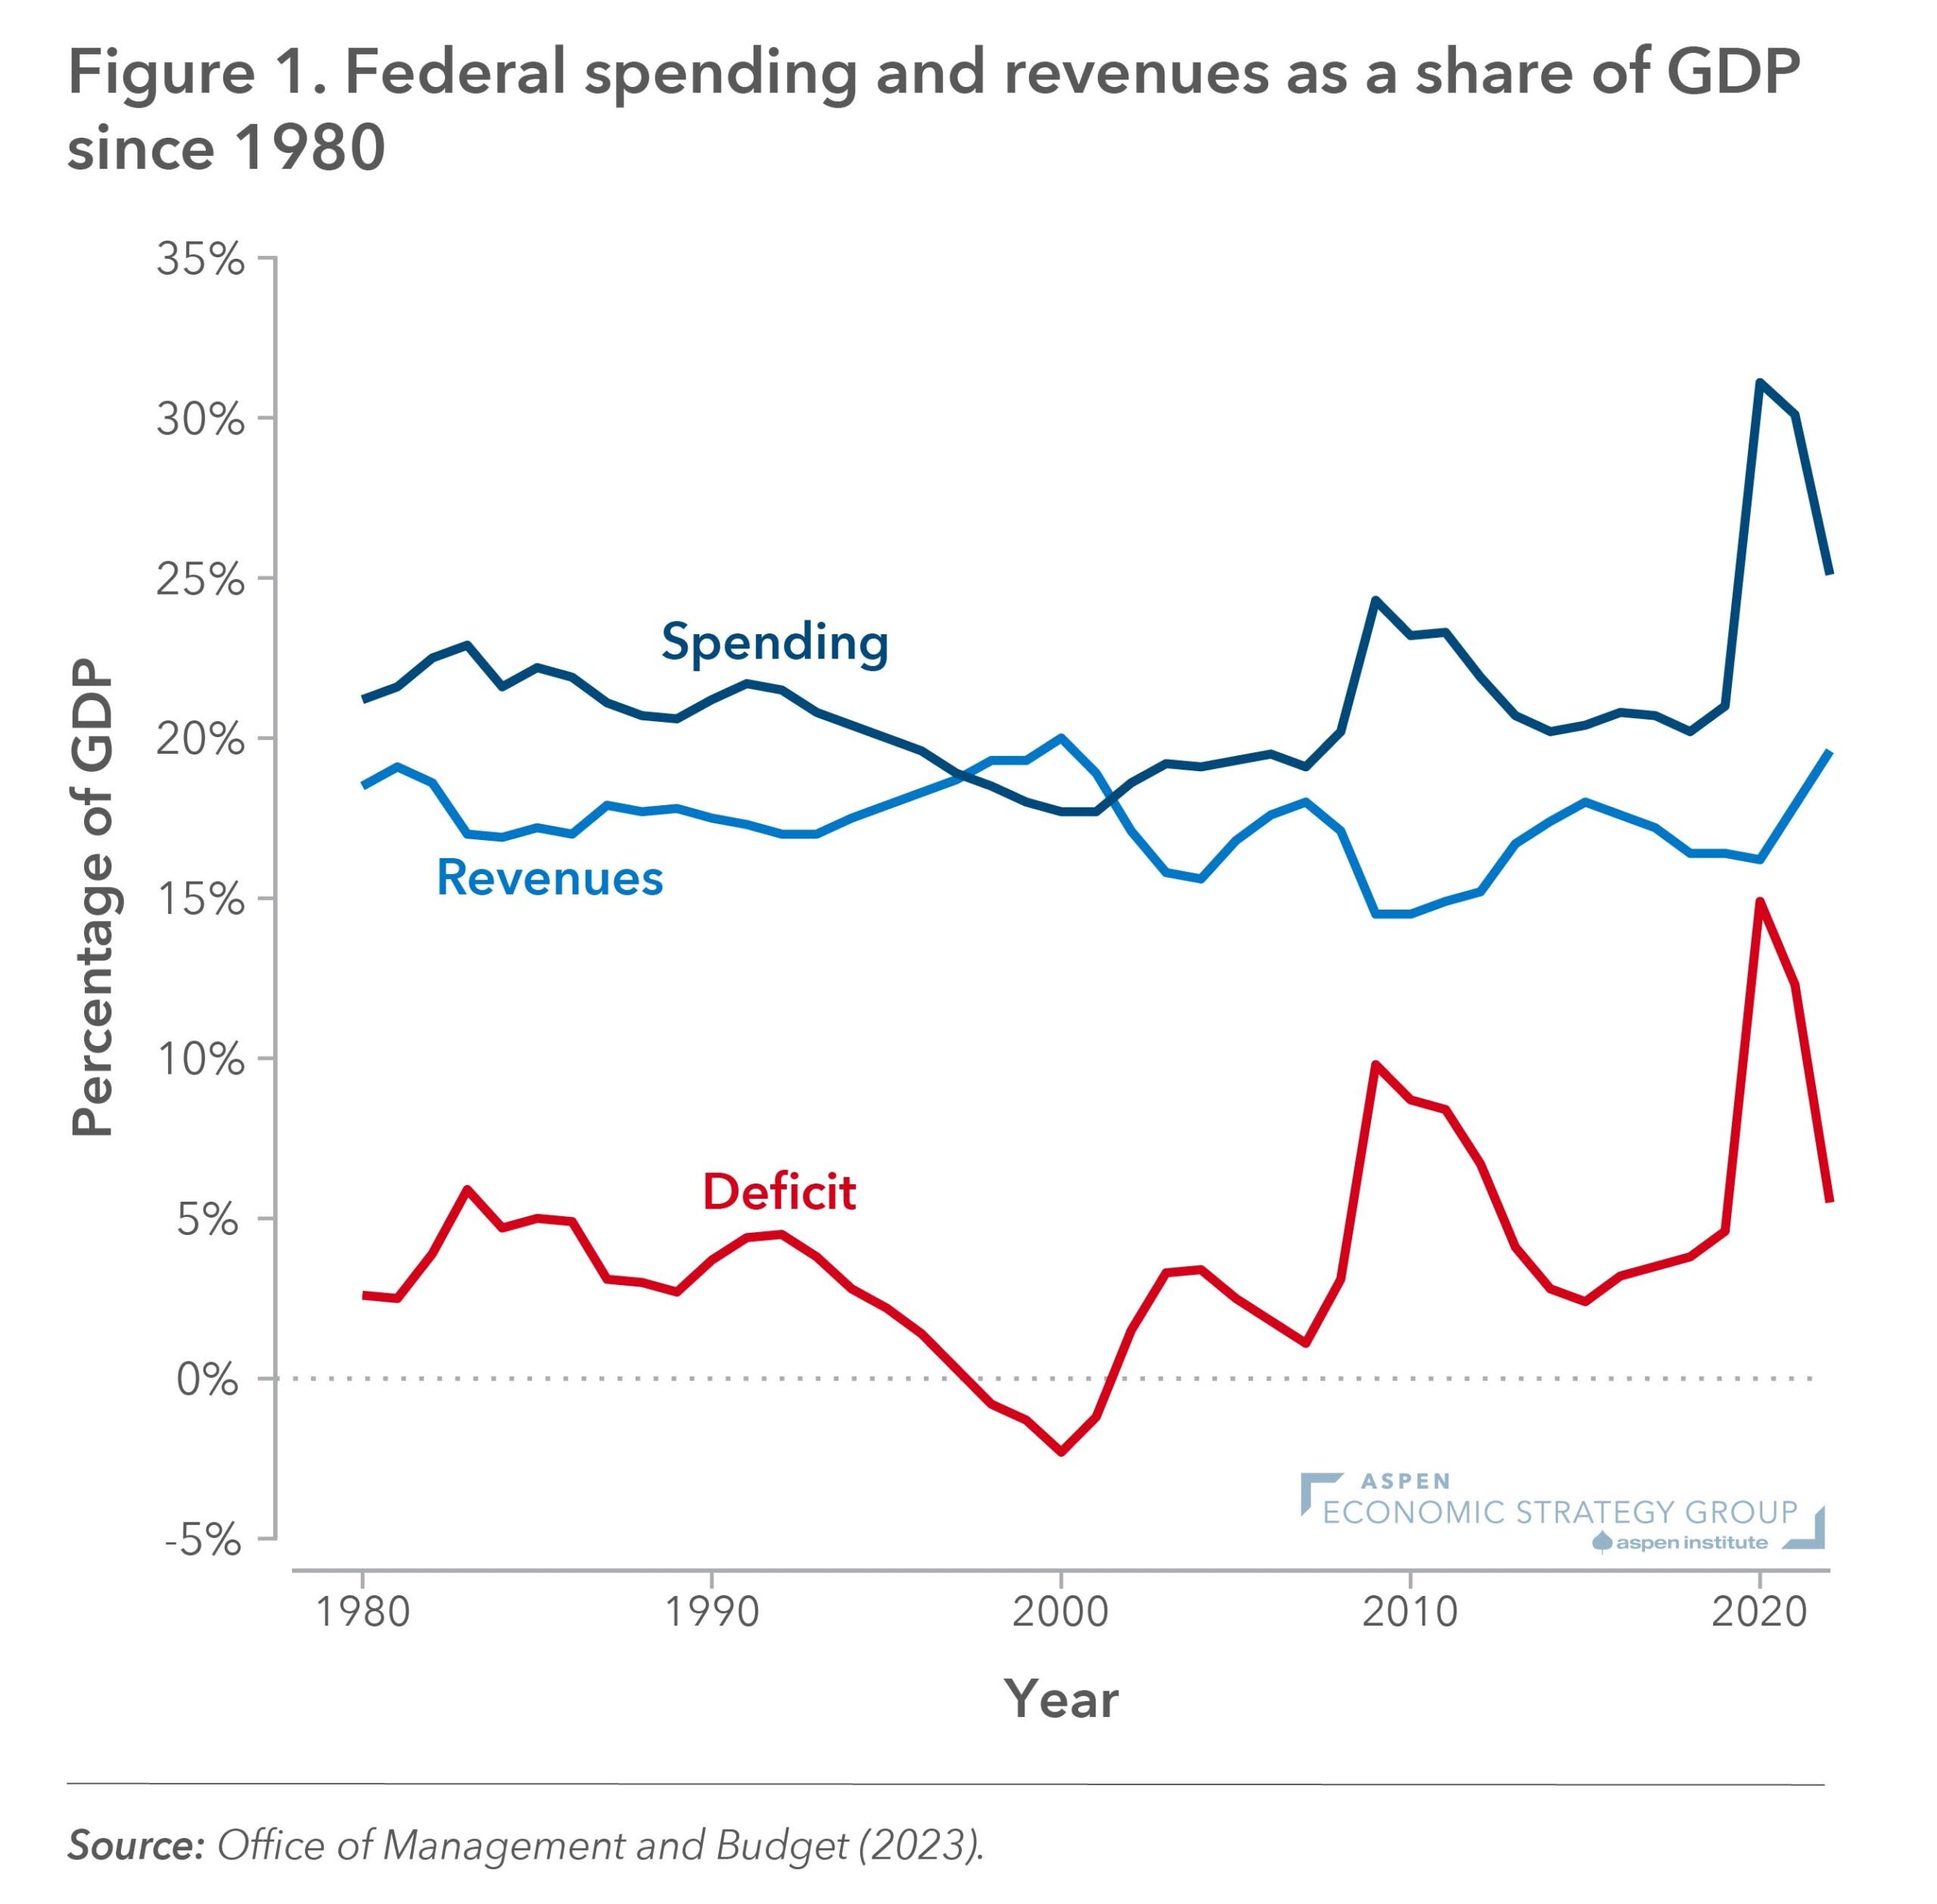
Figure 1: Federal Spending and Revenues as a Share of GDP Since 1980
From, “The Next Business Tax Regime: What Comes After the TCJA,” by Owen Zidar and Eric Zwick
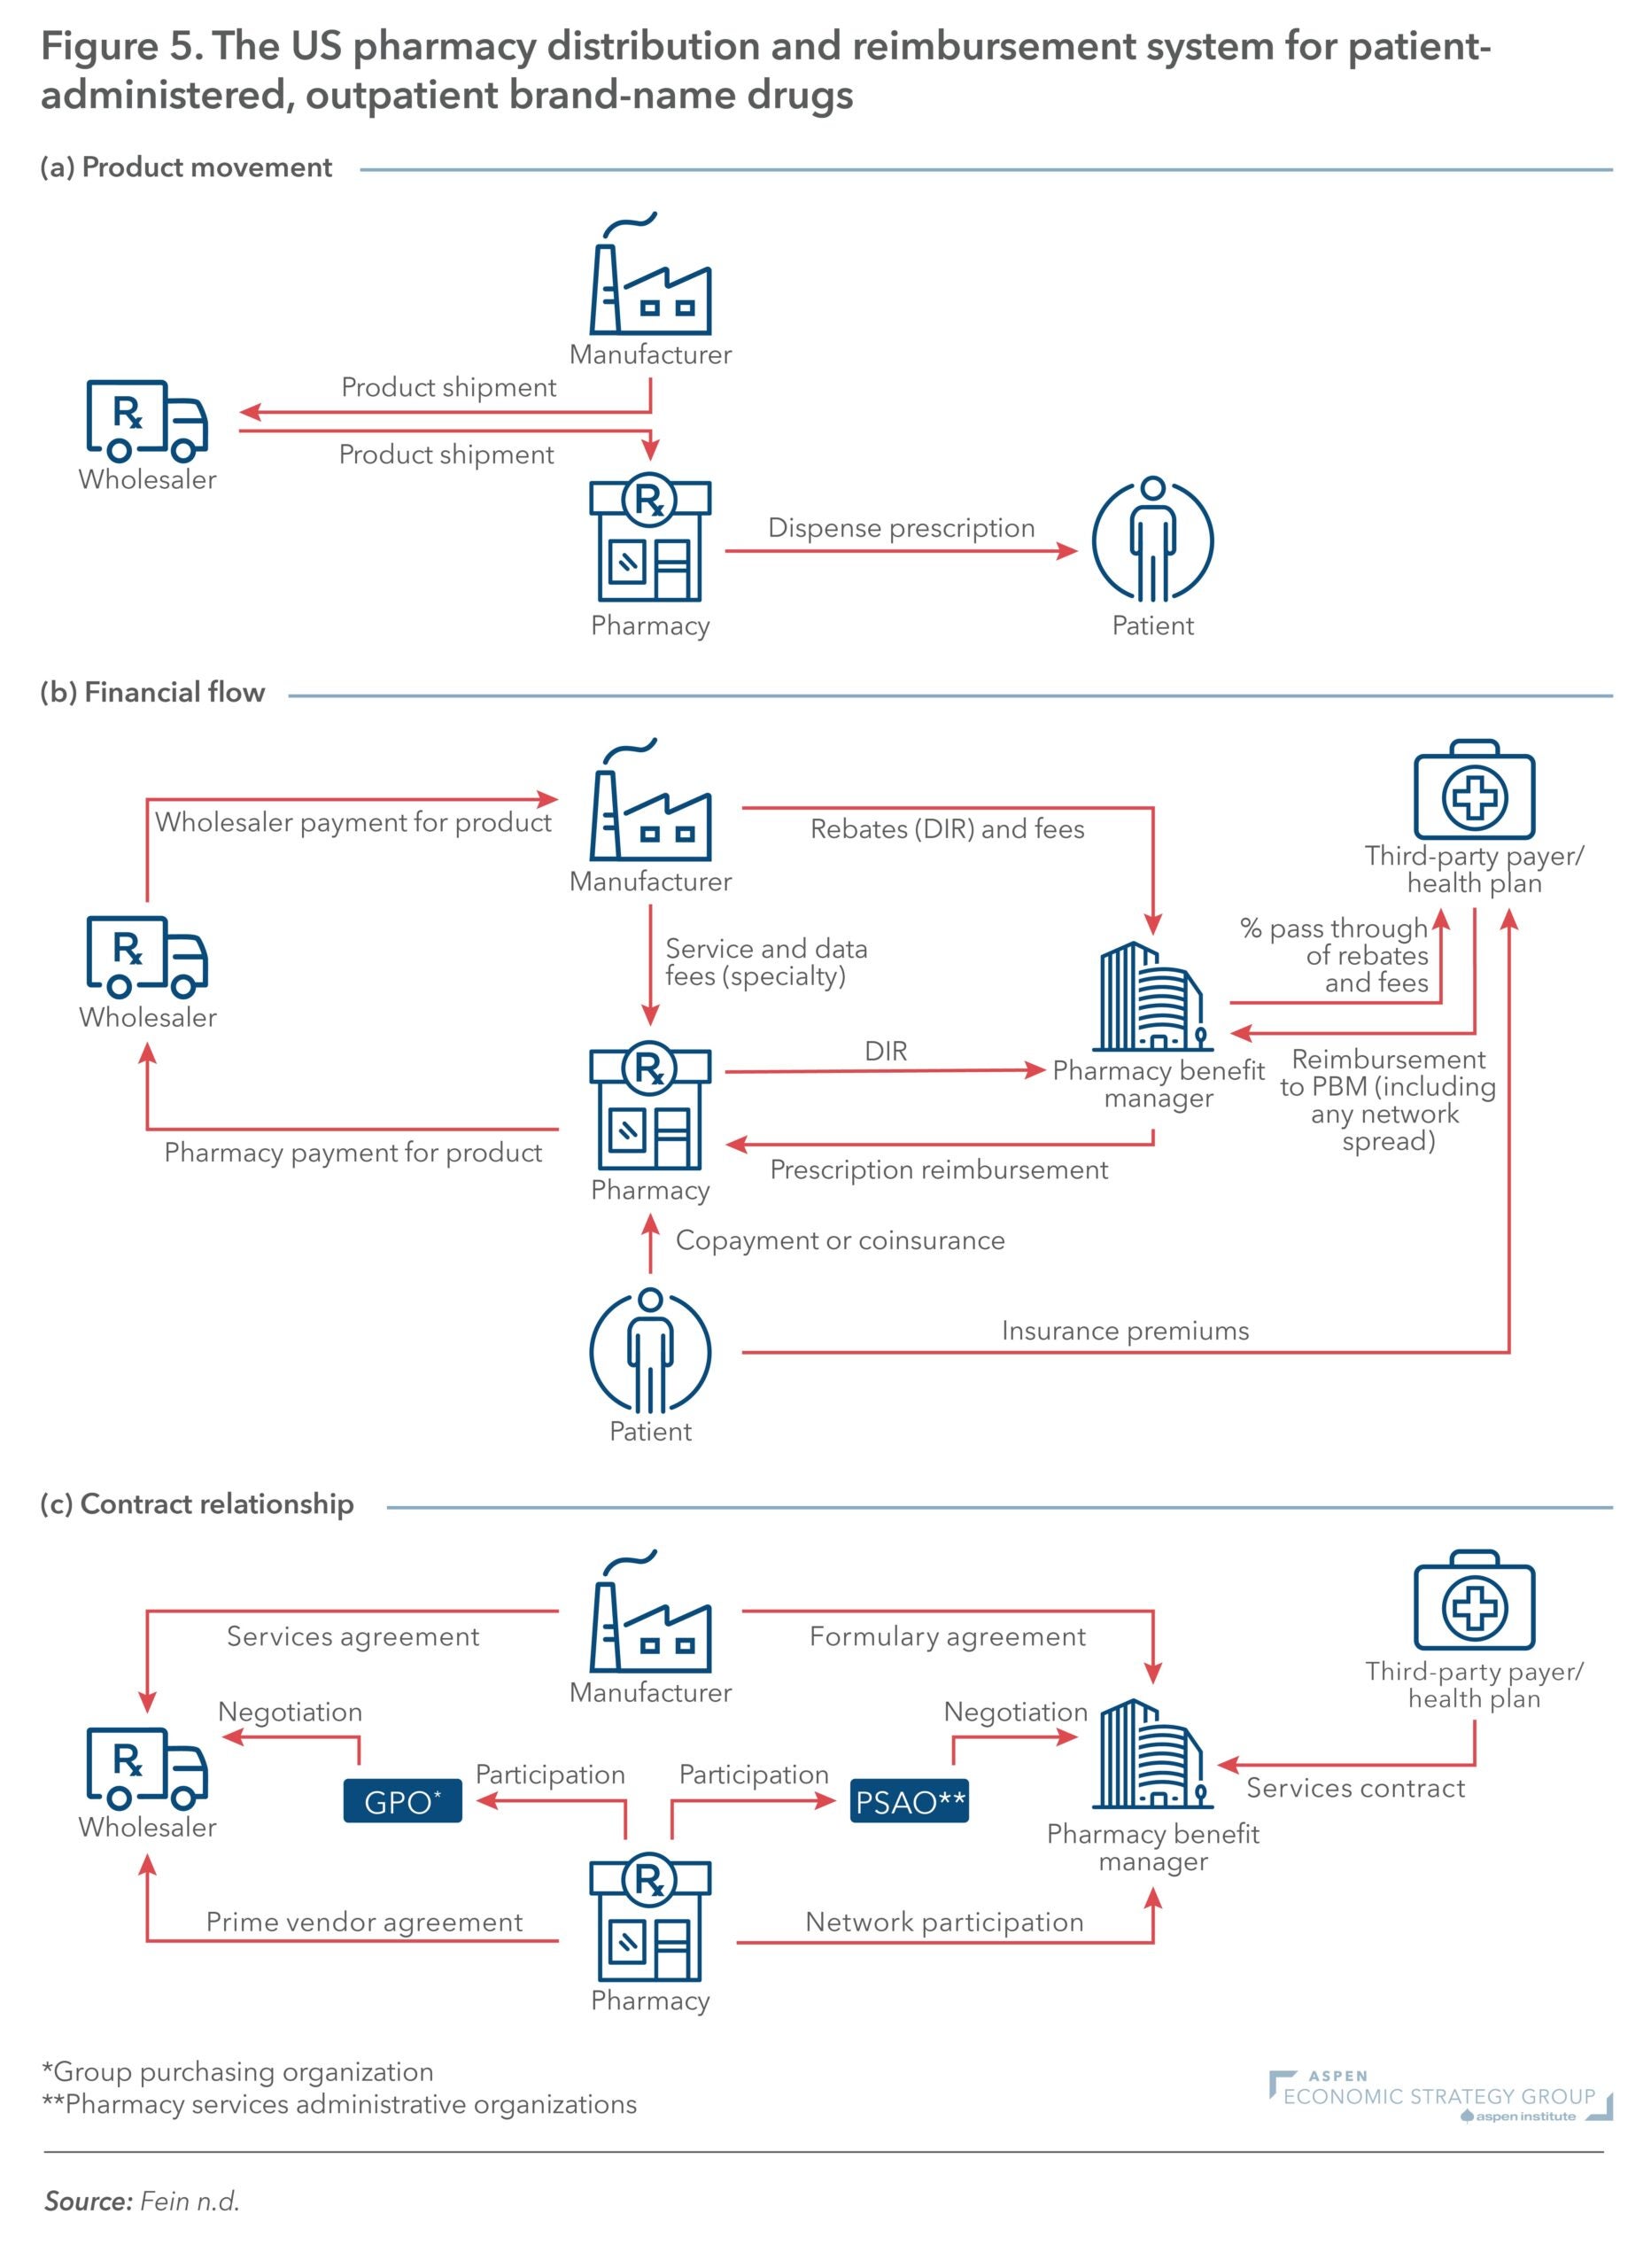
Figure 5: The US Pharmacy Distribution and Reimbursement System for Patient-Administered, Outpatient Brand-Name Drugs