Current Evidence on Household Financial Well-Being

Despite strong economic conditions, survey data reveal substantial economic worry and discontent among Americans. Pew survey data from 2024 indicated that “strengthening the economy” was Americans’ top policy priority, above “defending against terrorism,” “reducing crime,” and “dealing with immigration” (Pew 2024). A separate Pew survey from that same year found that only 53 percent of Americans believe that the “American Dream,” defined as the idea that anyone can achieve success in the United States through hard work and determination, is still possible (Borelli 2024).
Advancing broad economic prosperity requires an understanding of the economic well-being of American households, as well as potential contributors to widespread economic malaise. With that goal, this piece highlights current evidence on household financial well-being through six facts and accompanying figures. First, we document trends in earnings and income growth across the wage distribution as well as by educational attainment, gender, and geography. Second, we highlight trends in the costs of two salient household budget items: housing and healthcare.
1. Compared to half a century ago, inflation-adjusted wages have risen across the income distribution.
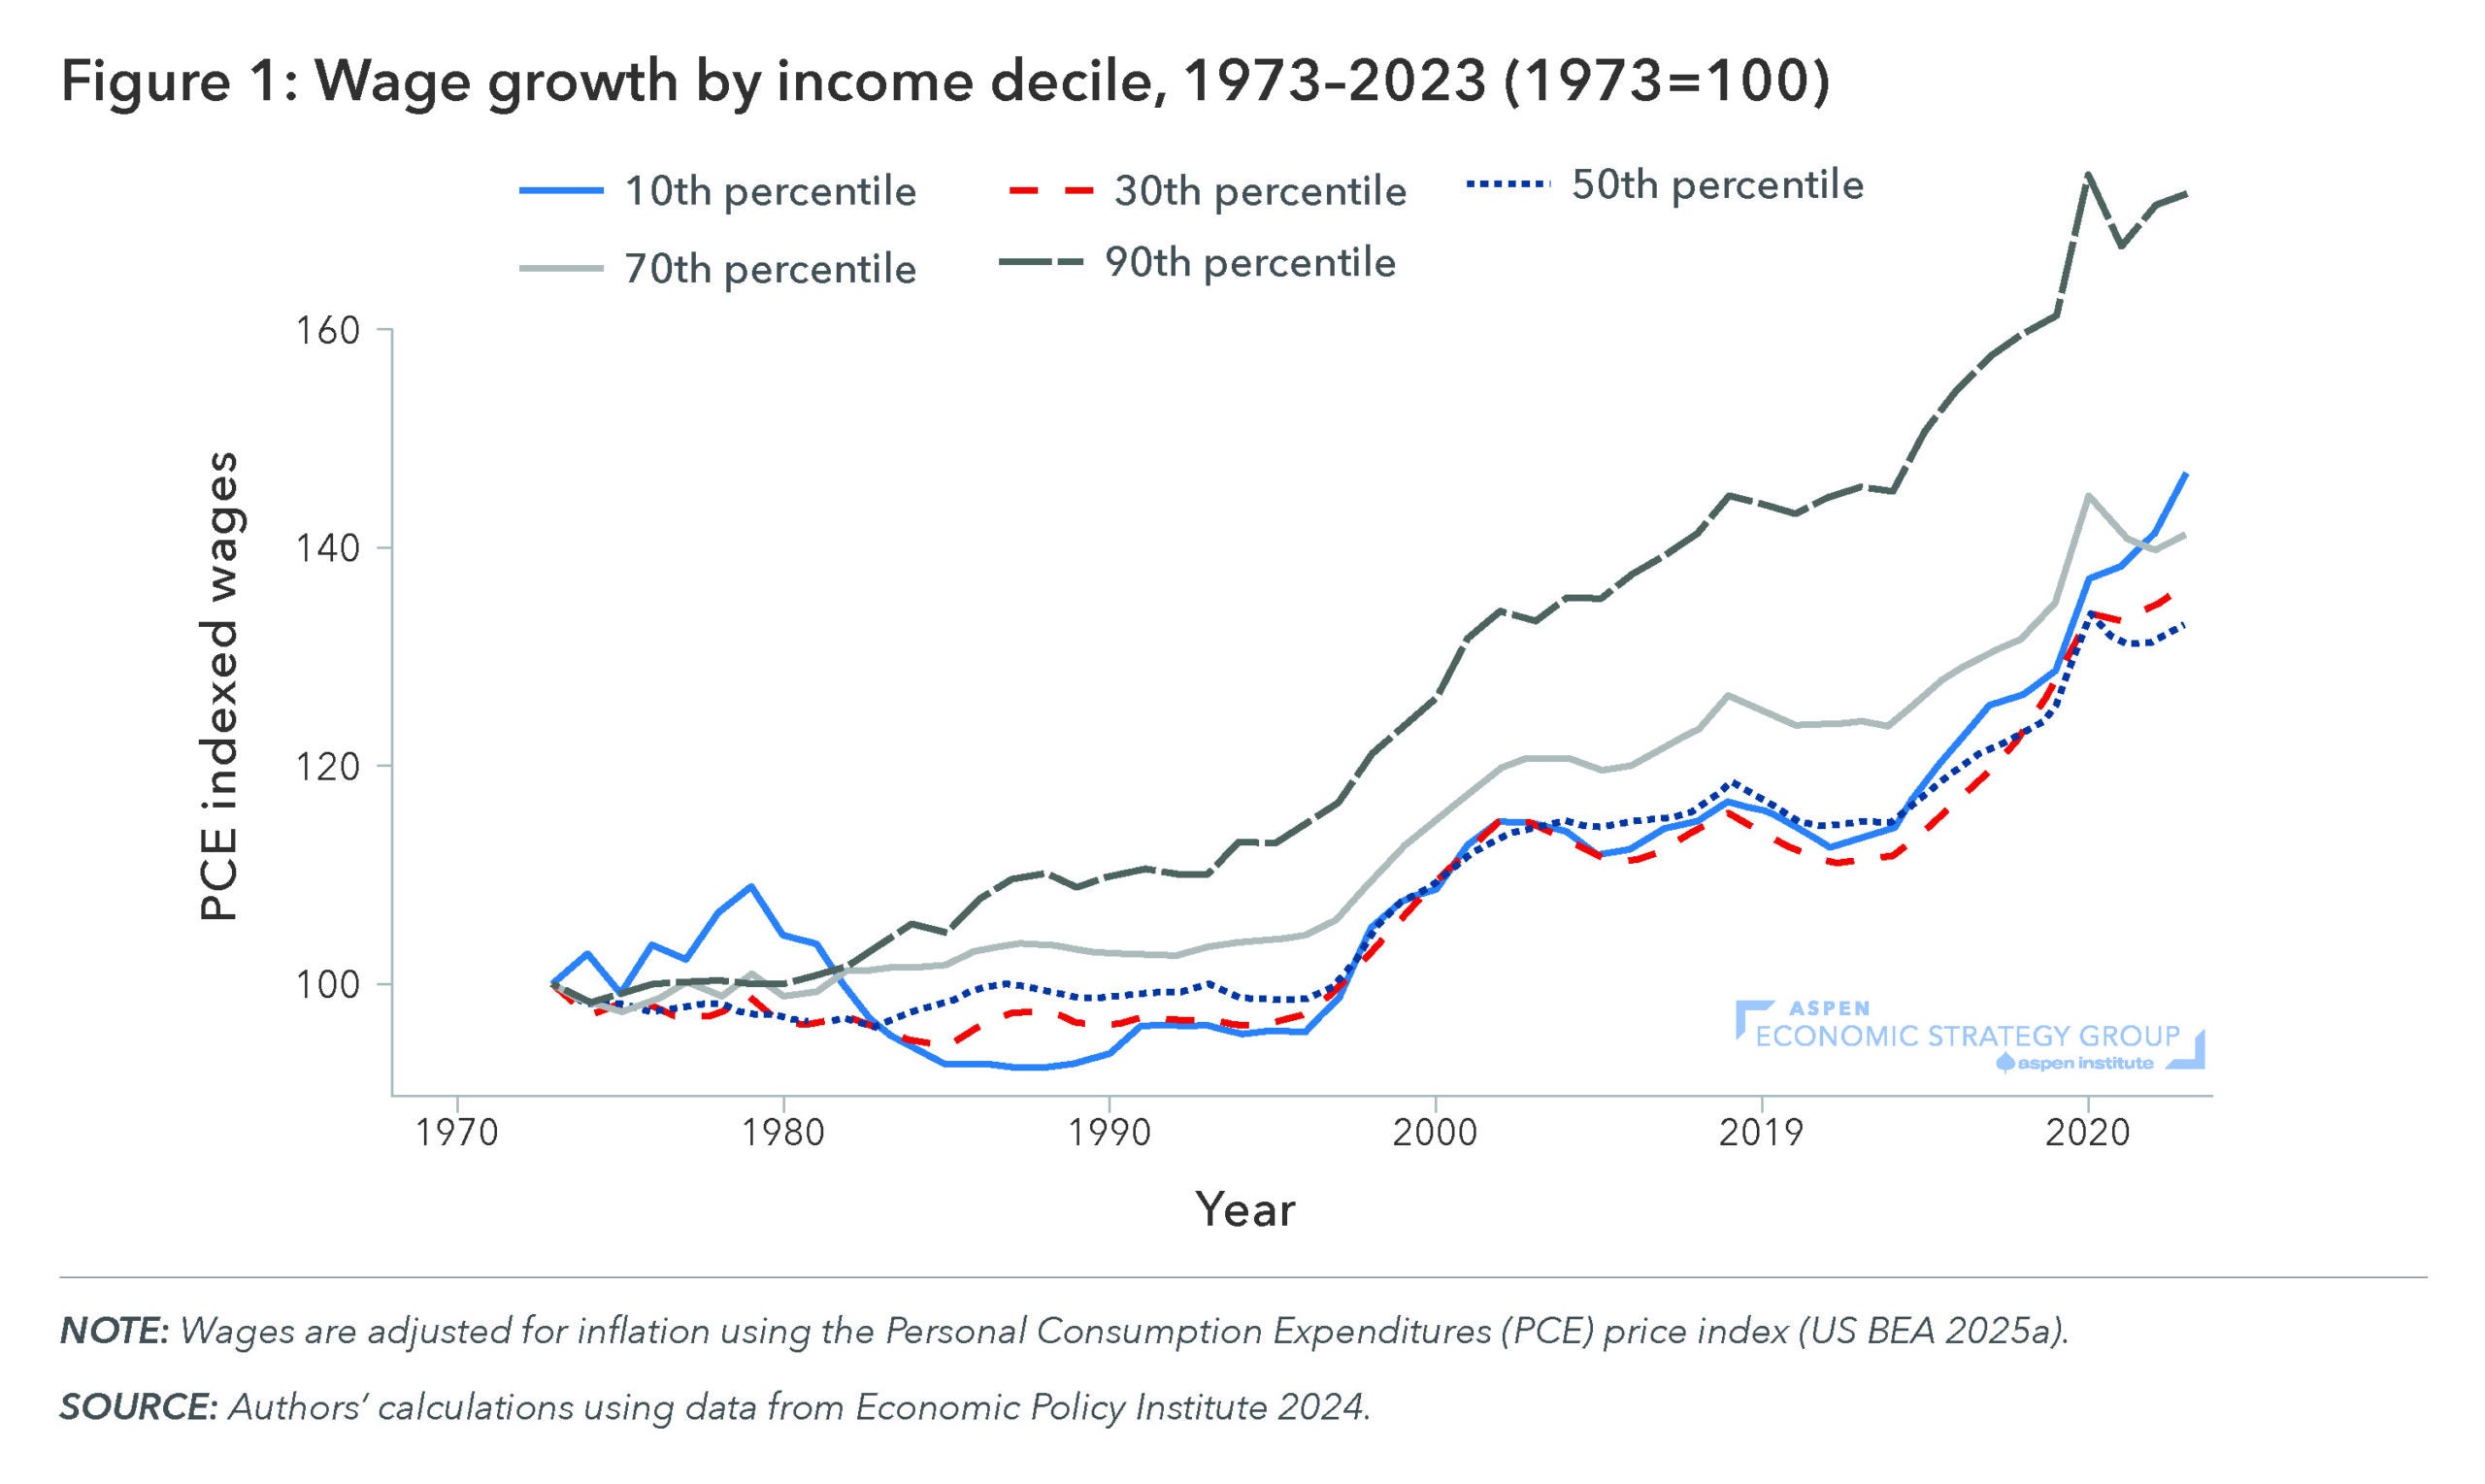
The typical worker in the United States earned more in recent years than at any point over the past half century, after adjusting for the rising cost of living.[1] Figure 1 shows that median hourly wages increased by 33 percent from 1973 to 2023 and that wages increased across each earnings decile over that time. To be sure, wage growth has not been uniform across time or across the wage distribution. The lowest earners (the bottom 10 percent), for instance, experienced a sharp decline in real wages from 1979 through 1997. In the subsequent period, from 1997 to 2023, however, real wages have risen 48 percent among the bottom decile of earners—compared to 33 percent for the median worker and 37 percent for the 80th percentile of earners. Thus, the overall story of the American worker is one of substantial wage growth over the past half century and particularly over the past 30 years.
[1] Throughout this paper, we adjust earnings and income data for the rising cost of living using the Personal Consumption Expenditures (PCE) price index. Researchers typically deflate such data using either the PCE or the CPI-U-RS, a version of the Consumer Price Index for all Urban Consumers (CPI-U) that incorporates improvements made to CPI calculation methods over time (BLS 2025). We prefer the PCE price index as it is a chain-type price index, meaning it incorporates consumers’ substitution behaviors as the relative prices of goods change (BLS 2011).
2. Over the past four decades, household income has risen across the income distribution, reflecting both rising earnings and a more generous tax-and-transfer system.
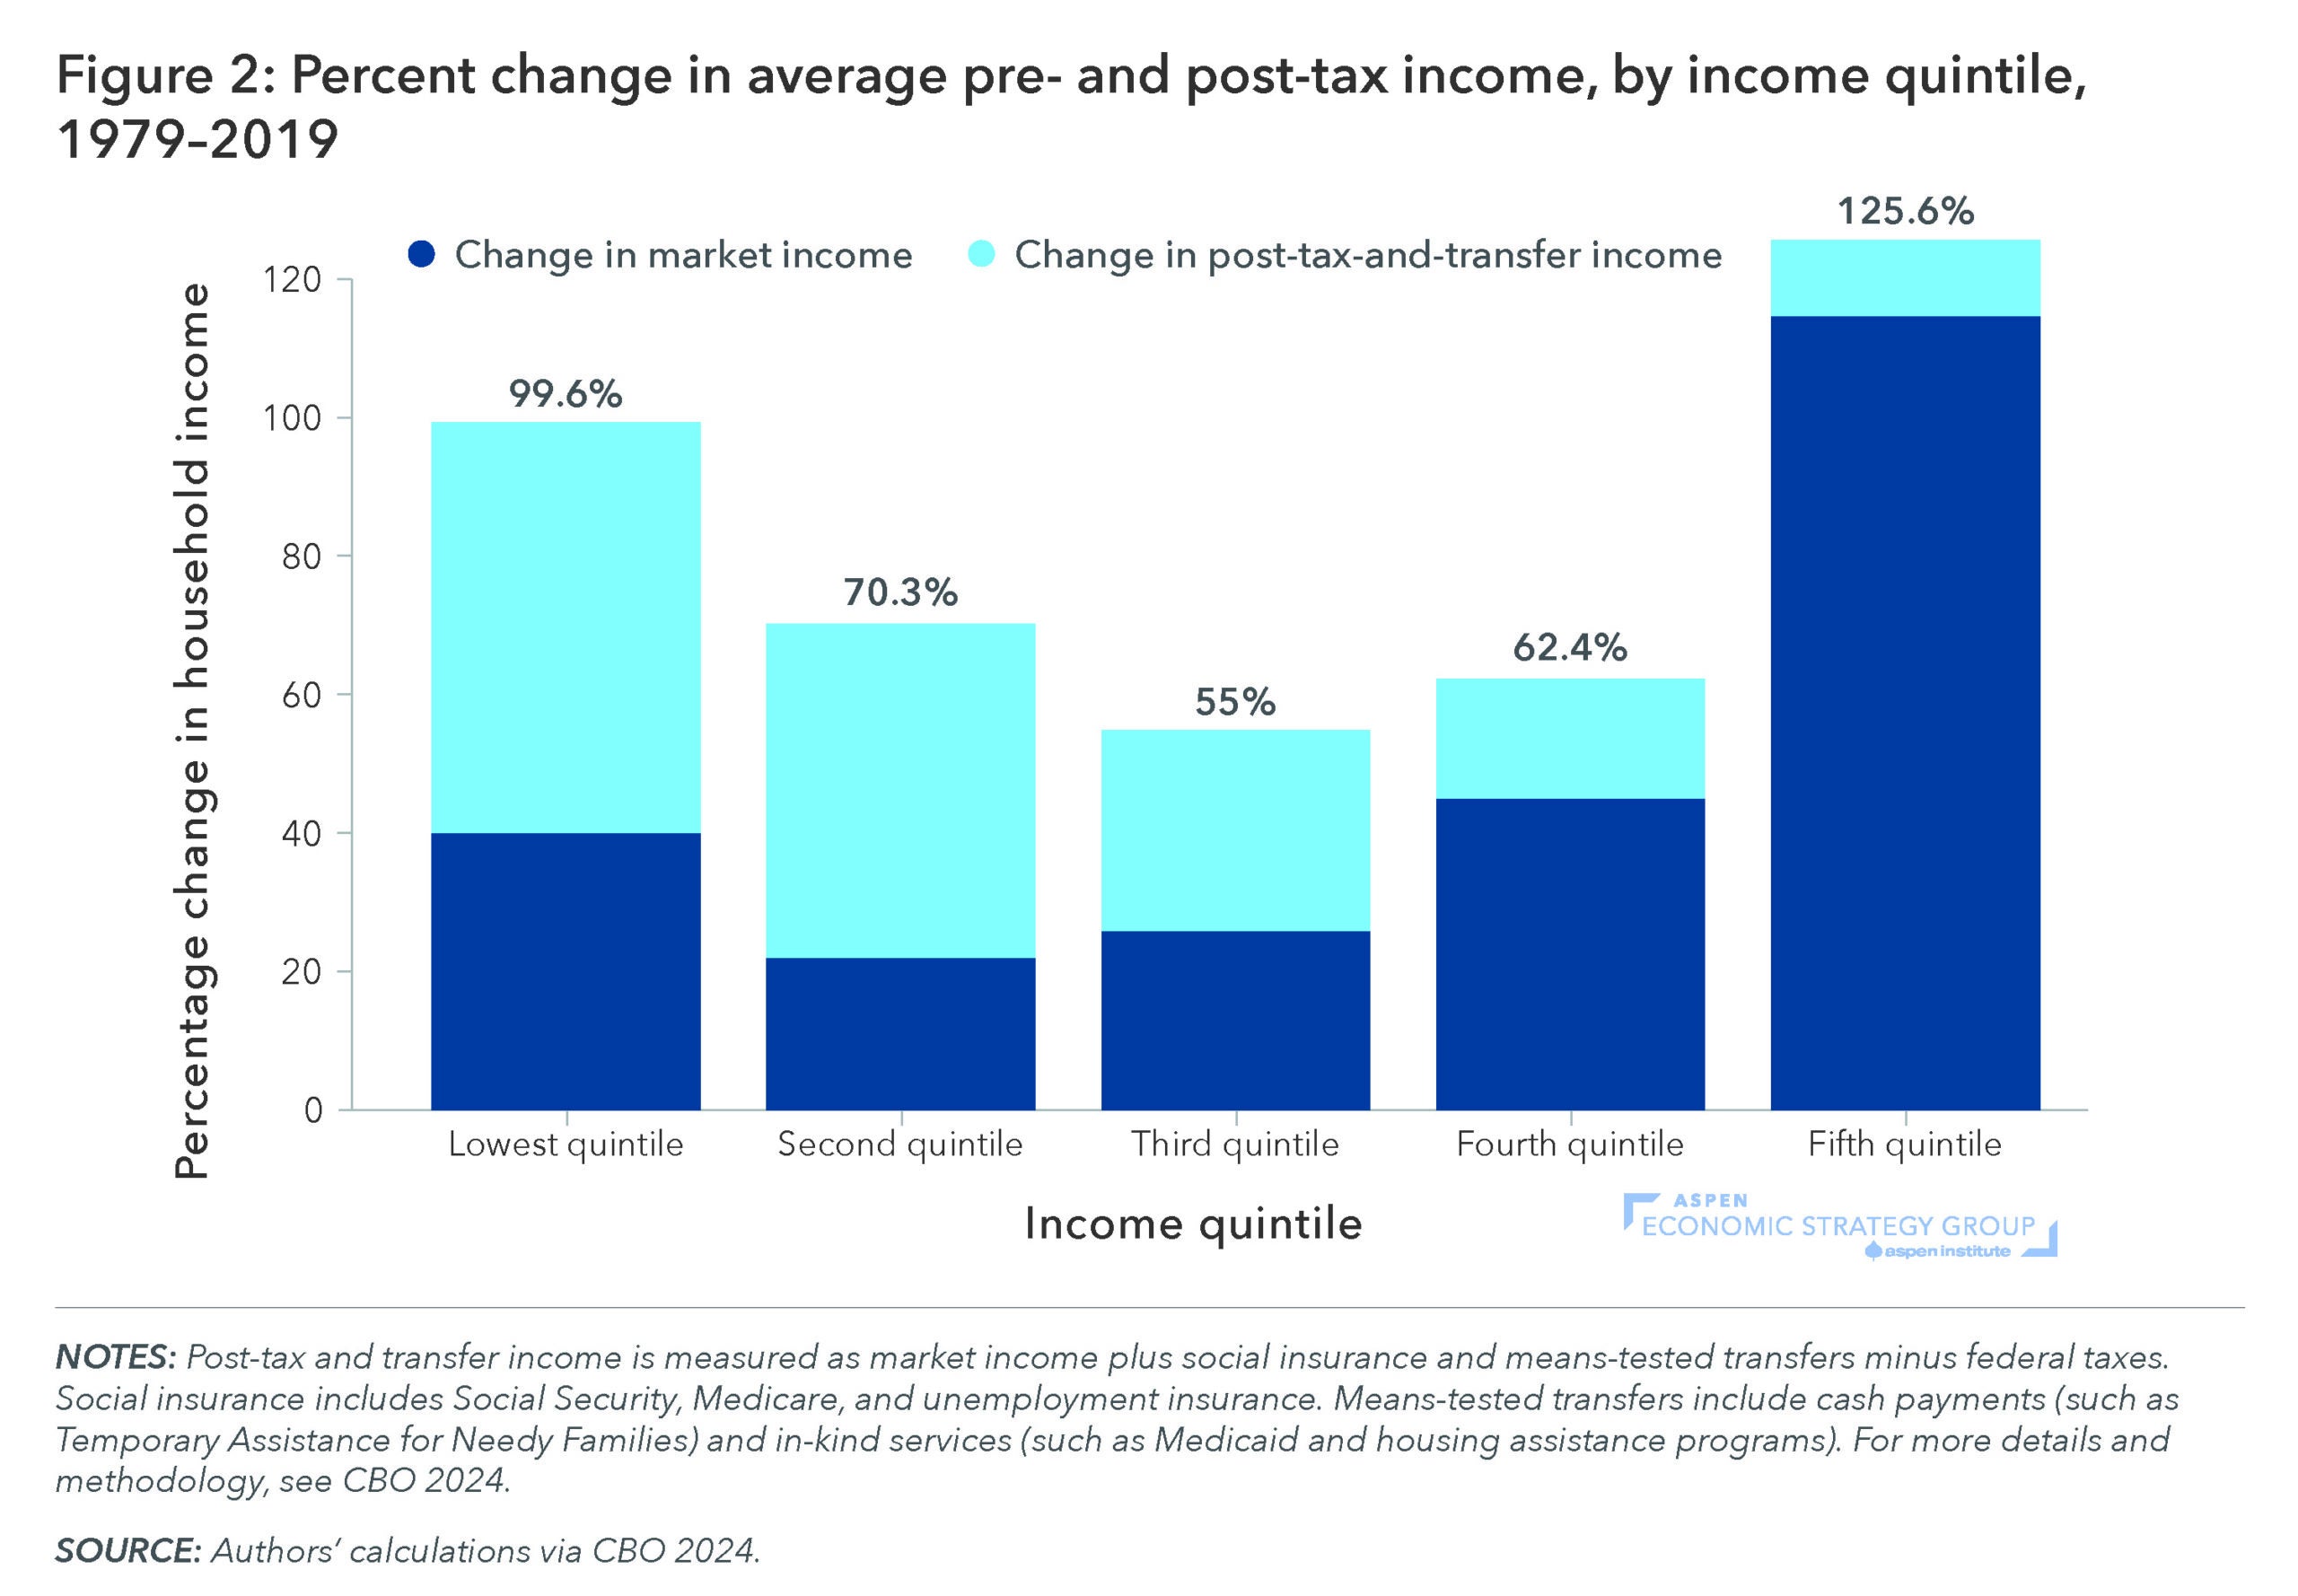
While fact 1 concerns long-term trends in individual worker wages, examining trends in household income helps to shed light on how total resources have changed, taking into account changes in household structure and the tax-and-transfer system. Figure 2 plots changes in household income, showing both market income and total income, by income quintile. “Market income” consists of wages, along with additional labor income (such as employers’ contributions for health insurance premiums), business income, and capital gains (CBO 2024). For all quintiles, both market income and household income increased between 1979 and 2019. For the lowest quintile of households, market income rose by 40 percent. Post-tax and transfer income of this group increased by 100 percent. As outlined by Kearney and Sullivan (2025), changes to the US tax-and-transfer system over this time, such as expansions to the Earned Income Tax Credit, have played a large role in raising the resources of low-income households.
3. Labor market outcomes have been marked by an increased return to education and a decline in inflation-adjusted wages for men without college degrees.
Despite rising wages across the income distribution and broad growth in household income, certain groups have fared better than others over the past five decades. Indeed, breaking apart wage data by gender and education highlights two key economic trends. First, there has been a consistent rise in the return to education from 1973 to 2024. Both men and women with a college degree or higher, especially those with advanced degrees, have experienced the strongest real wage growth: From 1973 to 2024, wages for men and women with advanced degrees have risen 38.4 and 32.9 percent respectively; wages for men and women with college degrees have risen 16.9 and 27.6 percent, respectively. Second, in contrast, men without college degrees have fared poorly in the labor market. Over this time, real wages declined 15.5 percent for men with high school degrees and 7.8 percent for men without high school degrees.
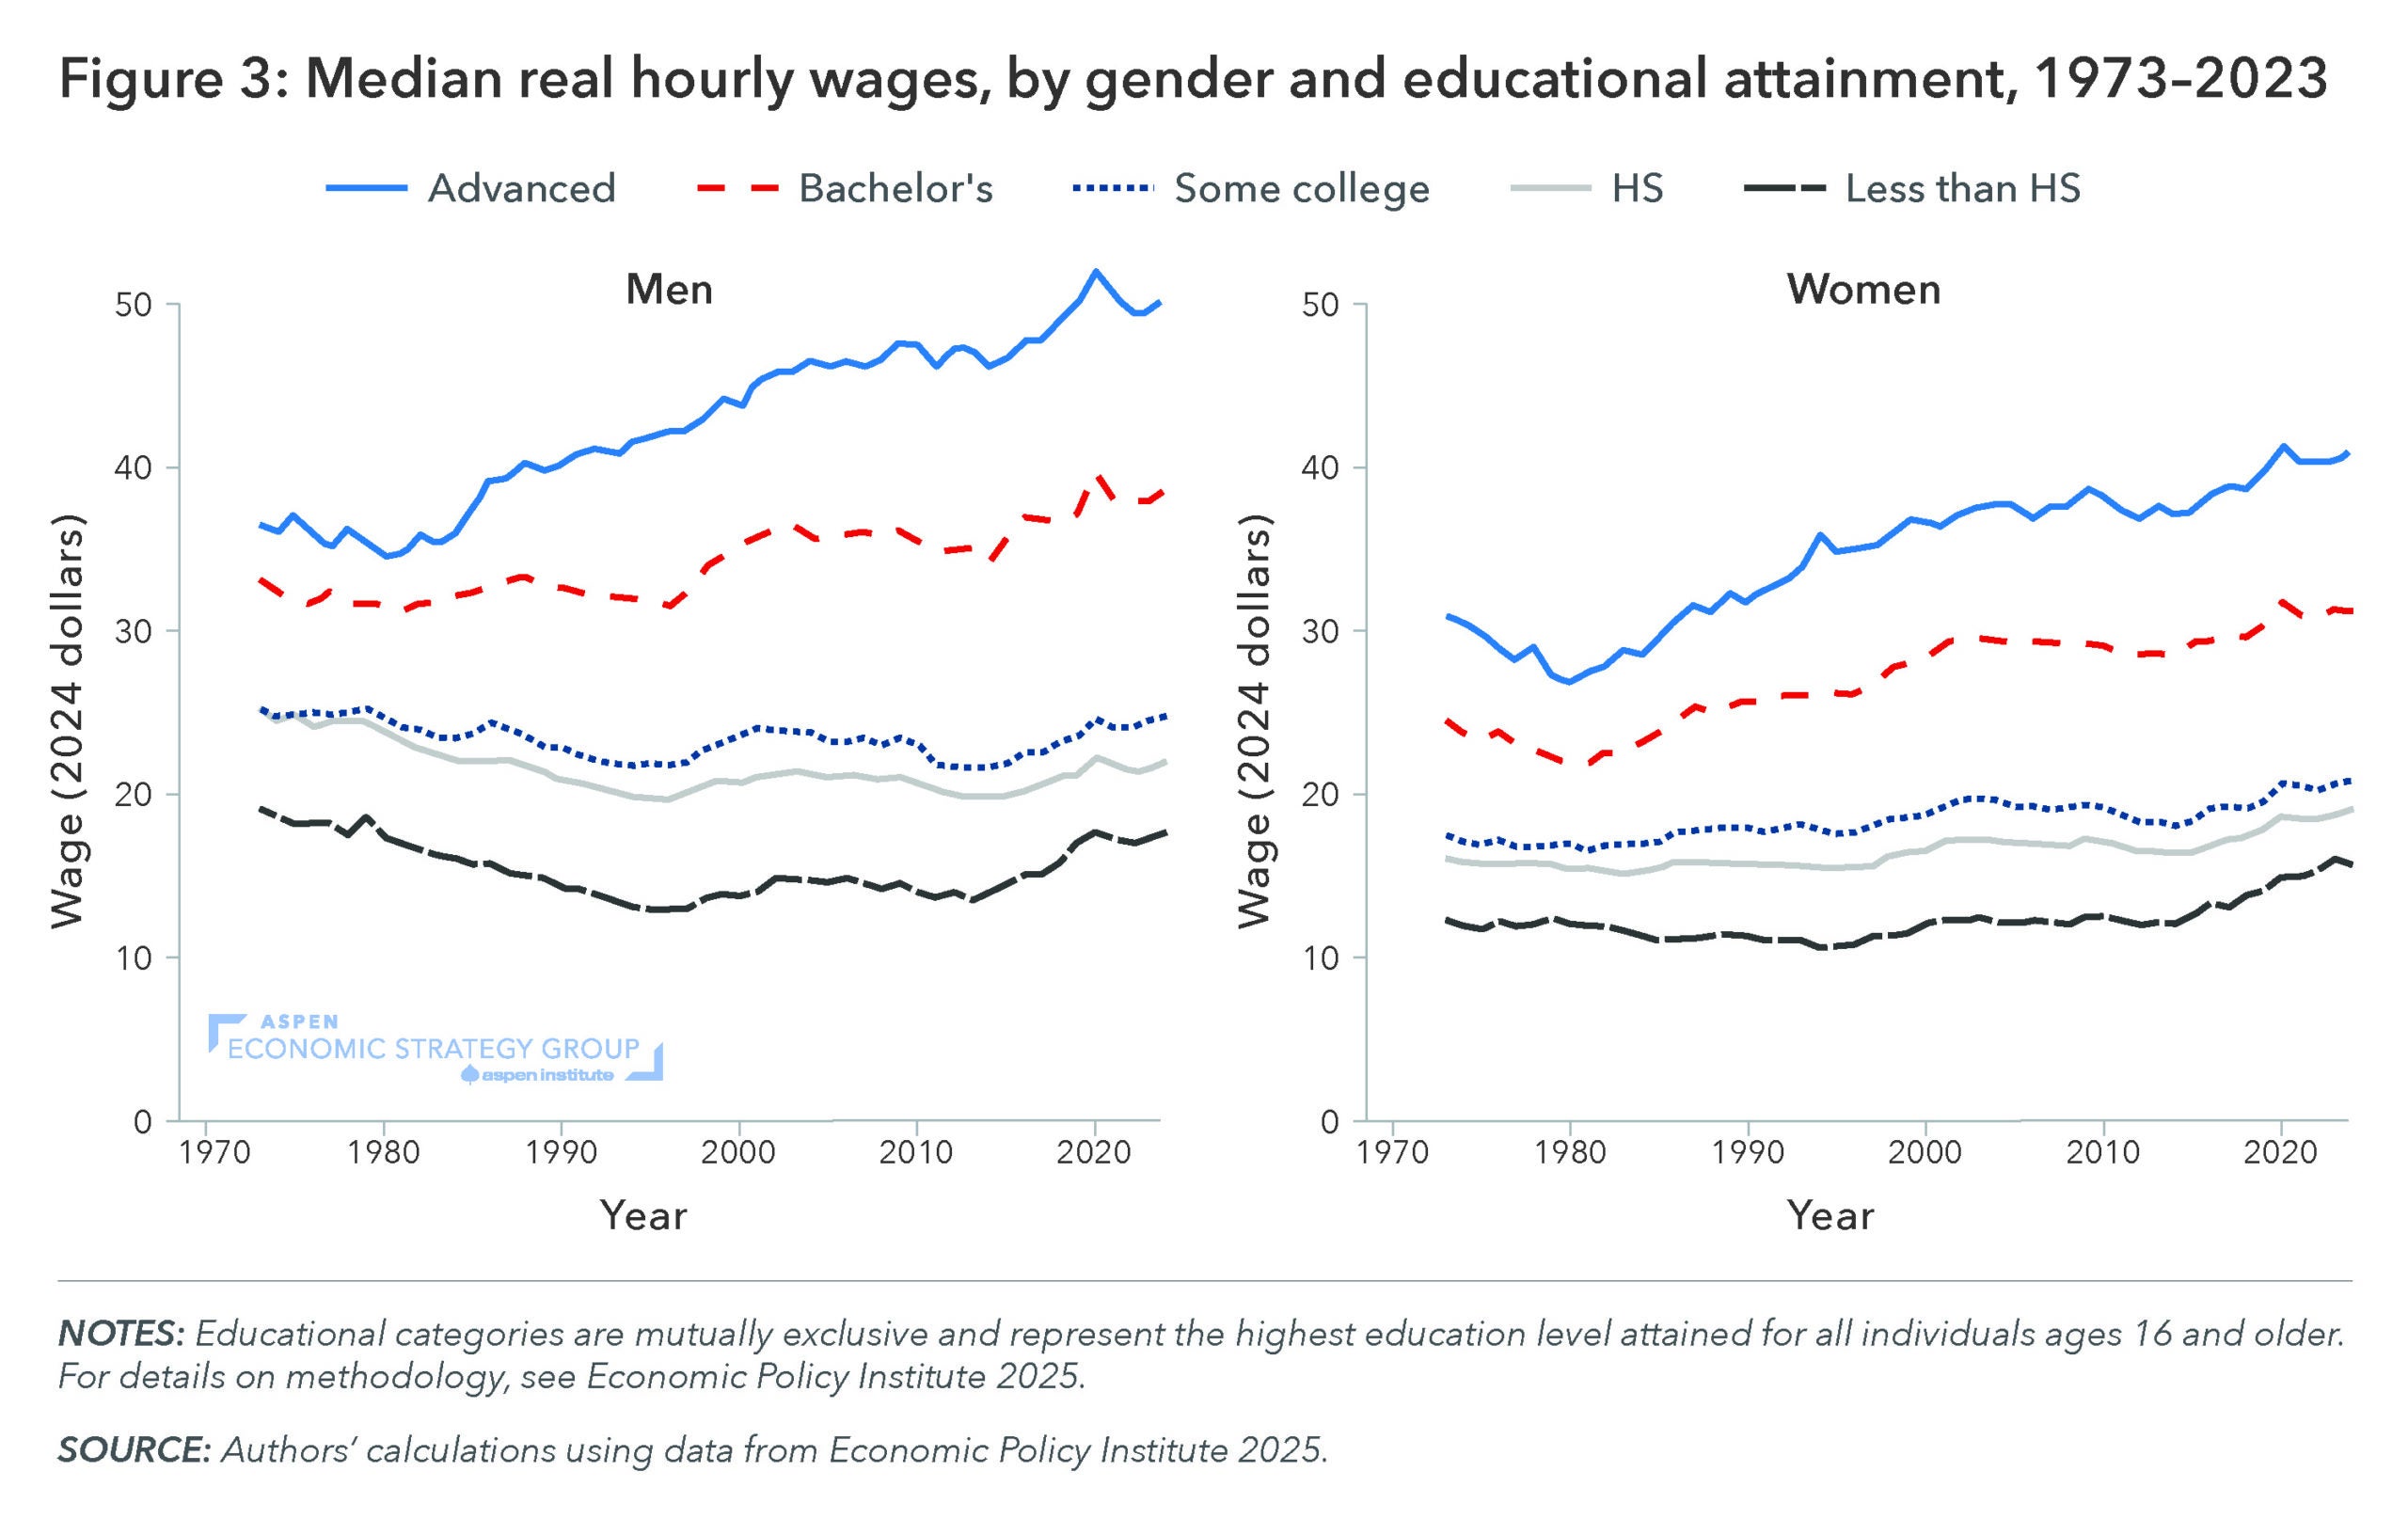
The twin trends of widening inequality in wages by education groups and the decline in earnings among men without college degrees are largely a product of developments in prior decades, including automation and globalization. Advances in technology that began in the 1980s sparked a polarization in the labor market that increased the returns to education and shifted workers without college degrees into low-wage jobs (Katz and Autor 1999). Men without college degrees saw wages stagnate in the first decade of the 2000s, as those who had been working manufacturing jobs that were eliminated due to rising global competition then moved into service-sector jobs (Autor et al. 2016). In the past decade, however, labor-market polarization has given way to general skill upgrading in the labor market, as Deming et al. (2024) describes, and real wages have risen across all education levels, including for men with less than a college degree.
4. Geographic income inequality has widened since 1980.
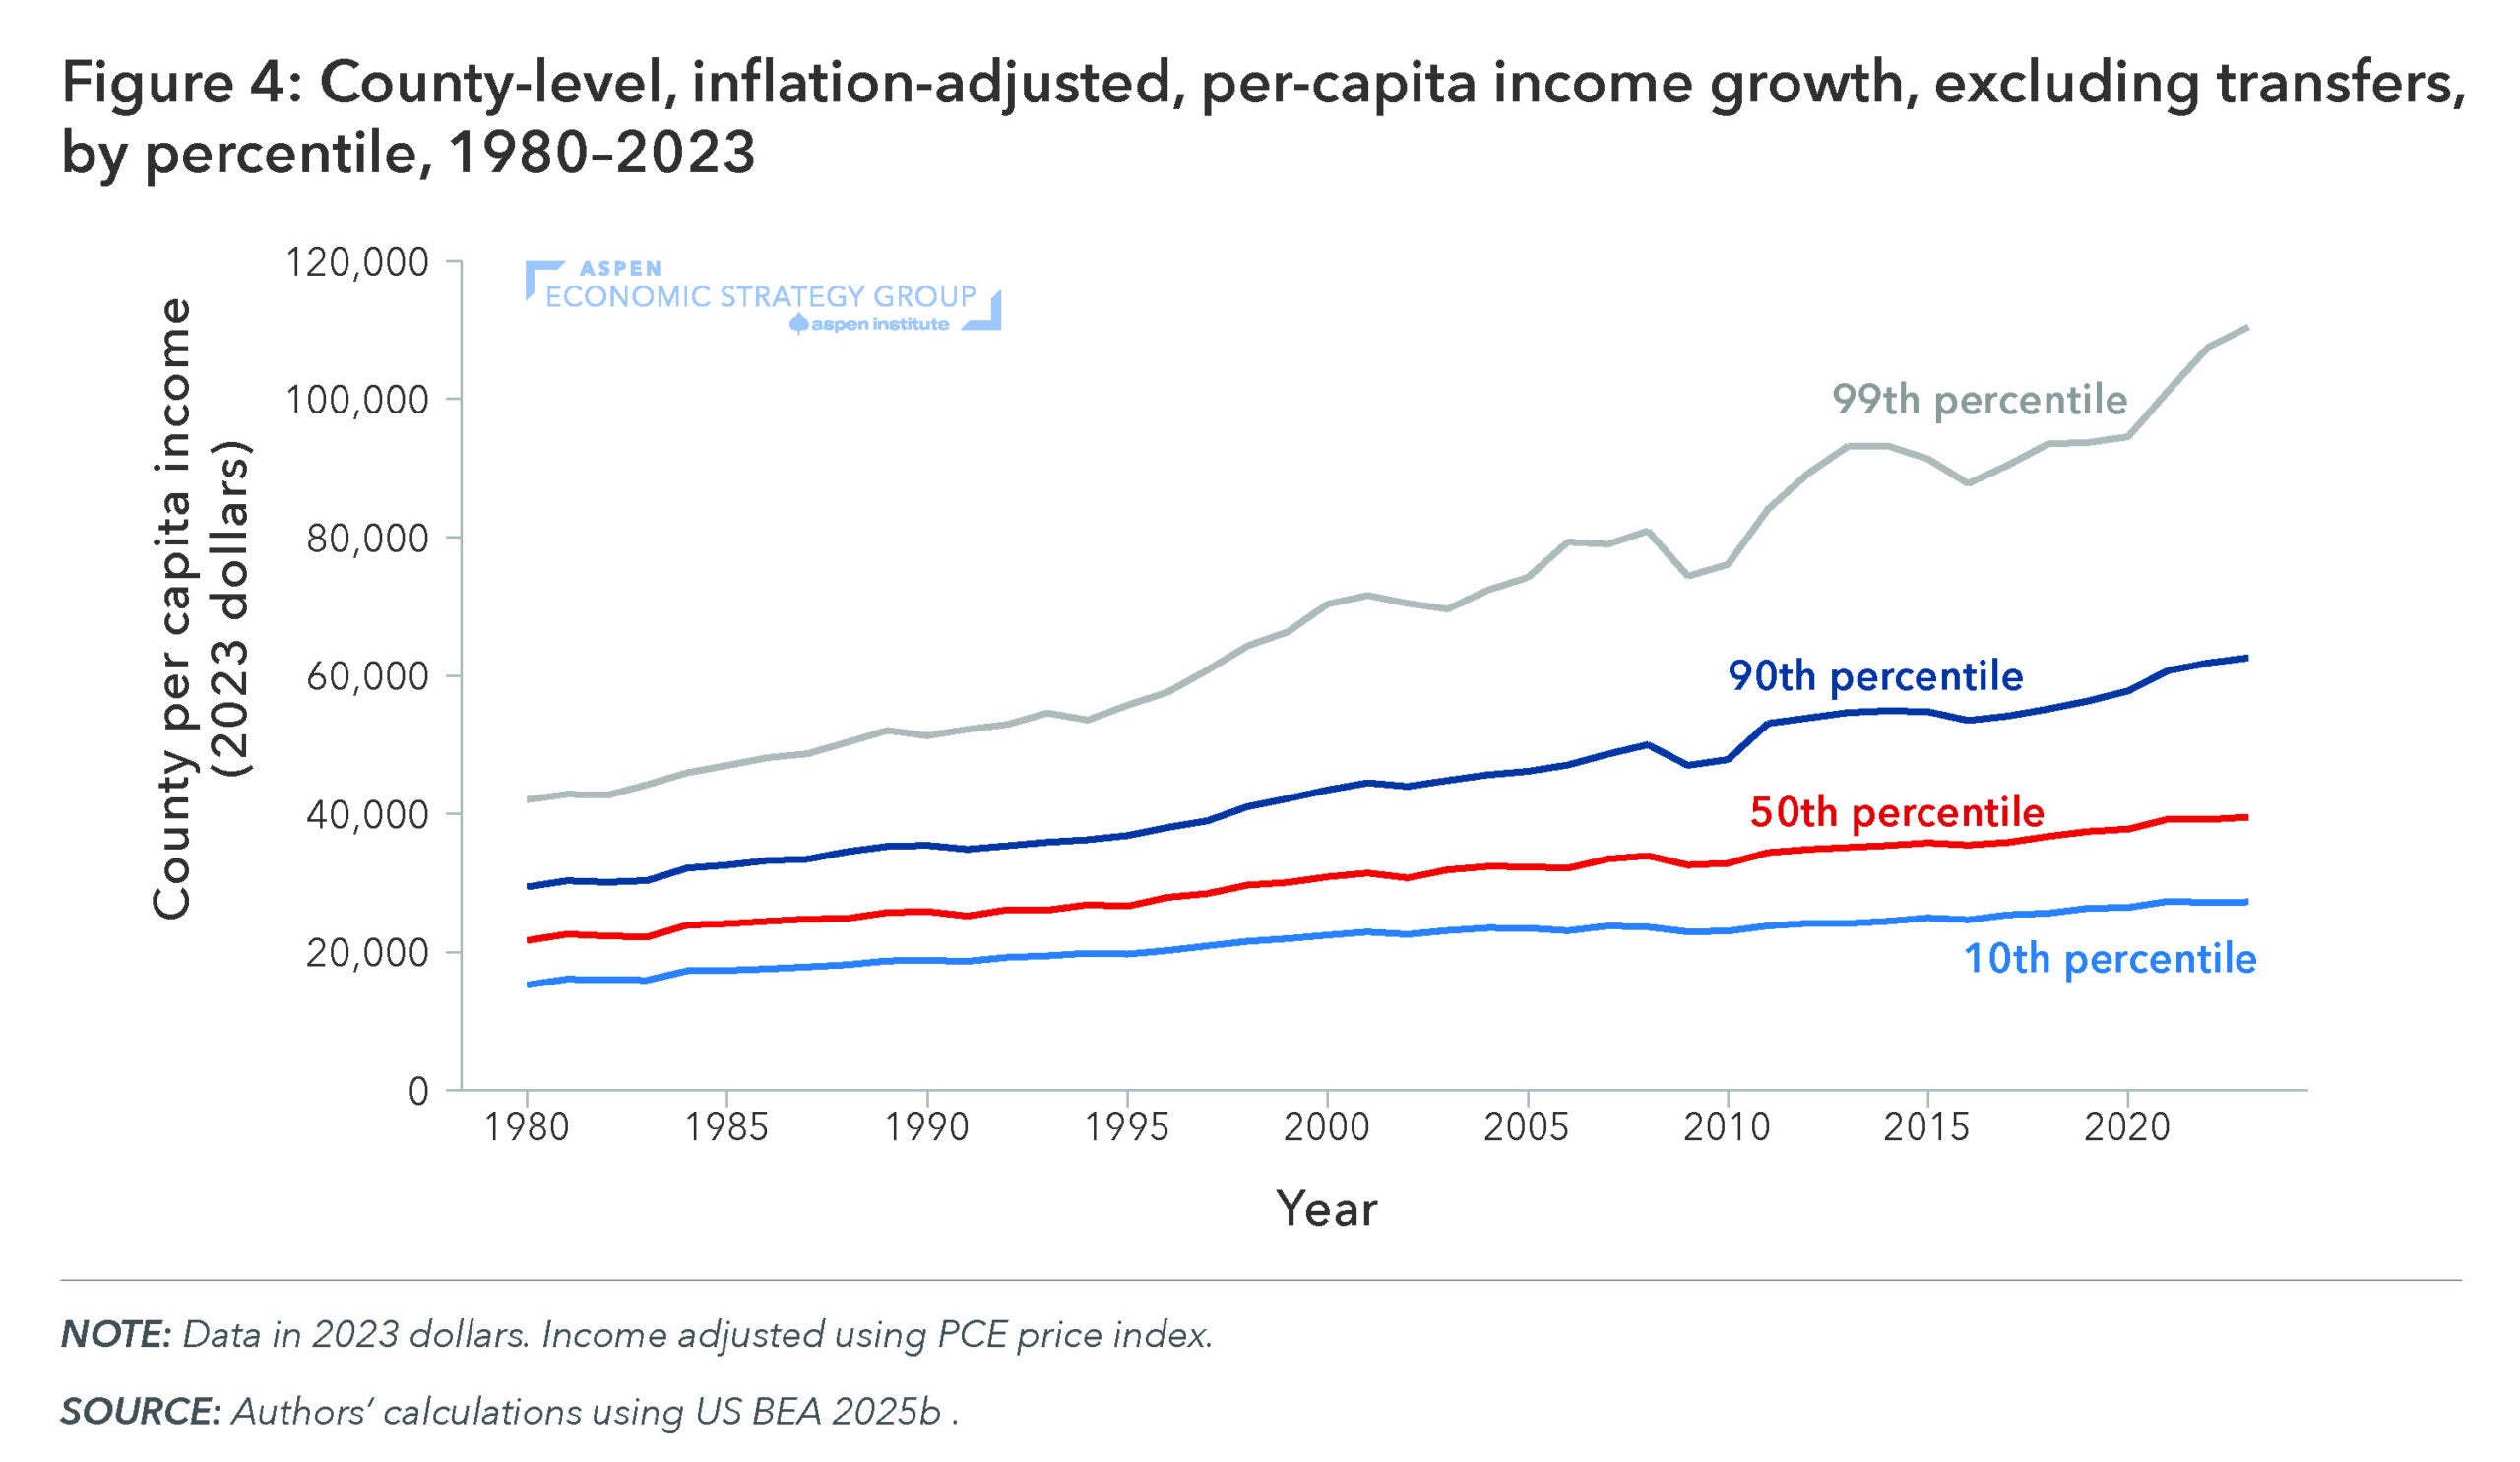
The dynamics described above tie directly into differences in economic growth that have emerged across geographies over this time. Figure 4 shows that from 1980 to 2023, per-capita real income (excluding government transfers) for the top 1 percent of counties rose by 165 percent, compared to 84 percent for the median county.
This divergence across cities reflects the dynamics of both labor markets and housing markets. The increased concentration of “knowledge workers” in cities fostered further growth, creating what Enrico Moretti (2004; 2012) has called the “Great Divergence” between highly educated, high-income, high-growth cities that attracted these workers and the areas that did not. Furthermore, as David Autor (2020) detailed, over this period, cities experienced a decline of middle-paying production or clerical jobs that a worker without a college degree might have once found there. From 1980 to 2015, the “urban wage premium” for workers with a college degree or greater rose by 50 percent, driven by the rise of high-paying professional and managerial jobs in cities.
At the same time, inelastic housing supply in these “superstar” cities caused house prices to rise to the point that living in such cities has become unaffordable for many low-wage service-sector workers (Gyorko, Mayer, and Sinai 2013). These developments have cut off a key mechanism of regional income convergence and individual economic mobility—a mechanism of which America’s cities have historically served as a trademark (Glaeser et al. 2005; Glaeser 2011; Ganong and Shoag 2017).
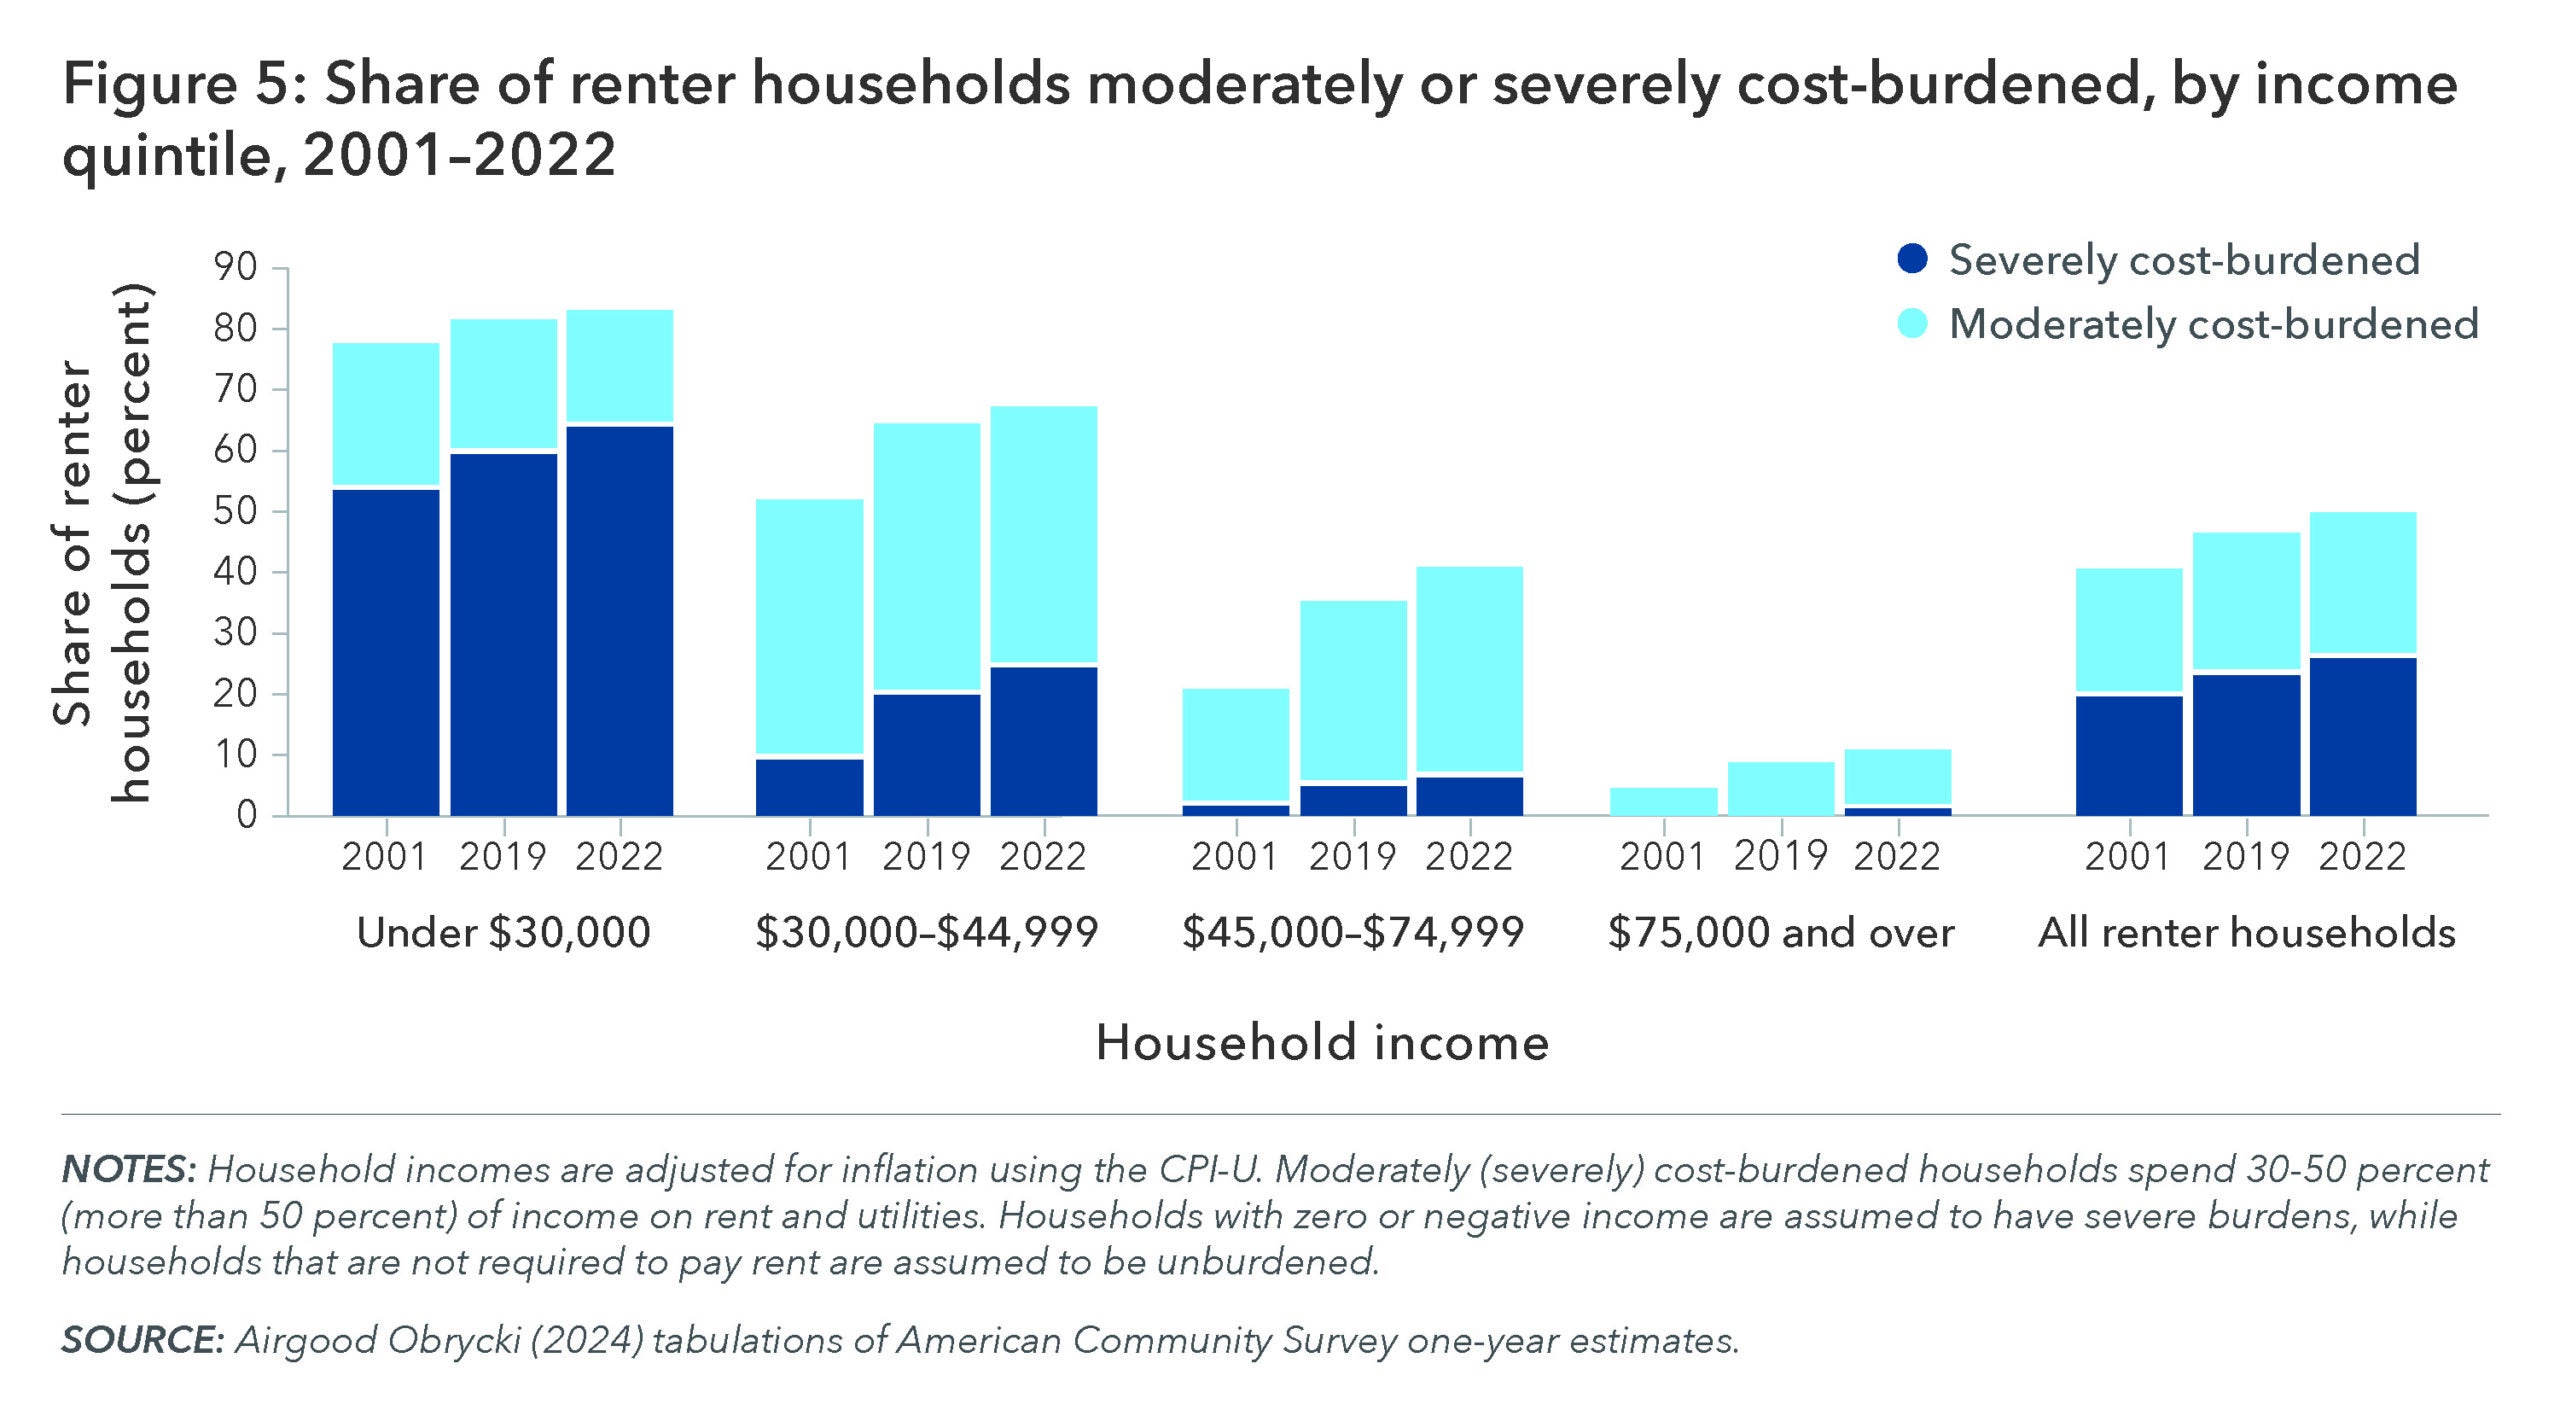
5. Rising housing costs have strained the budgets of many low-income Americans, making renting more burdensome and homeownership increasingly unattainable.
To be sure, rising housing costs are a concern not only in large cities but across the country, as Keys and Reina (2025) detail. Rent is consuming a larger share of household budgets, rising home prices are making home buying unaffordable, and for recent homebuyers, high mortgage rates mean that mortgage payments consume a significantly higher share of monthly budgets than they did for prior cohorts.
Figure 5 shows that roughly half of US renters are now classified as rent-burdened, meaning they spend 30 percent or more of their income on housing (US Census Bureau 2024). This burden is the largest for low-income households. In 2022, 83 percent of renters with incomes below $30,000 spent at least 30 percent of their income on rent. The largest increases over time have been seen for middle-income renters: The share of households making between $45,000 and $75,000 who spent at least 30 percent of their income on rent has nearly doubled since 2001, reaching 45 percent in 2022 (Airgood-Obrycki 2024).
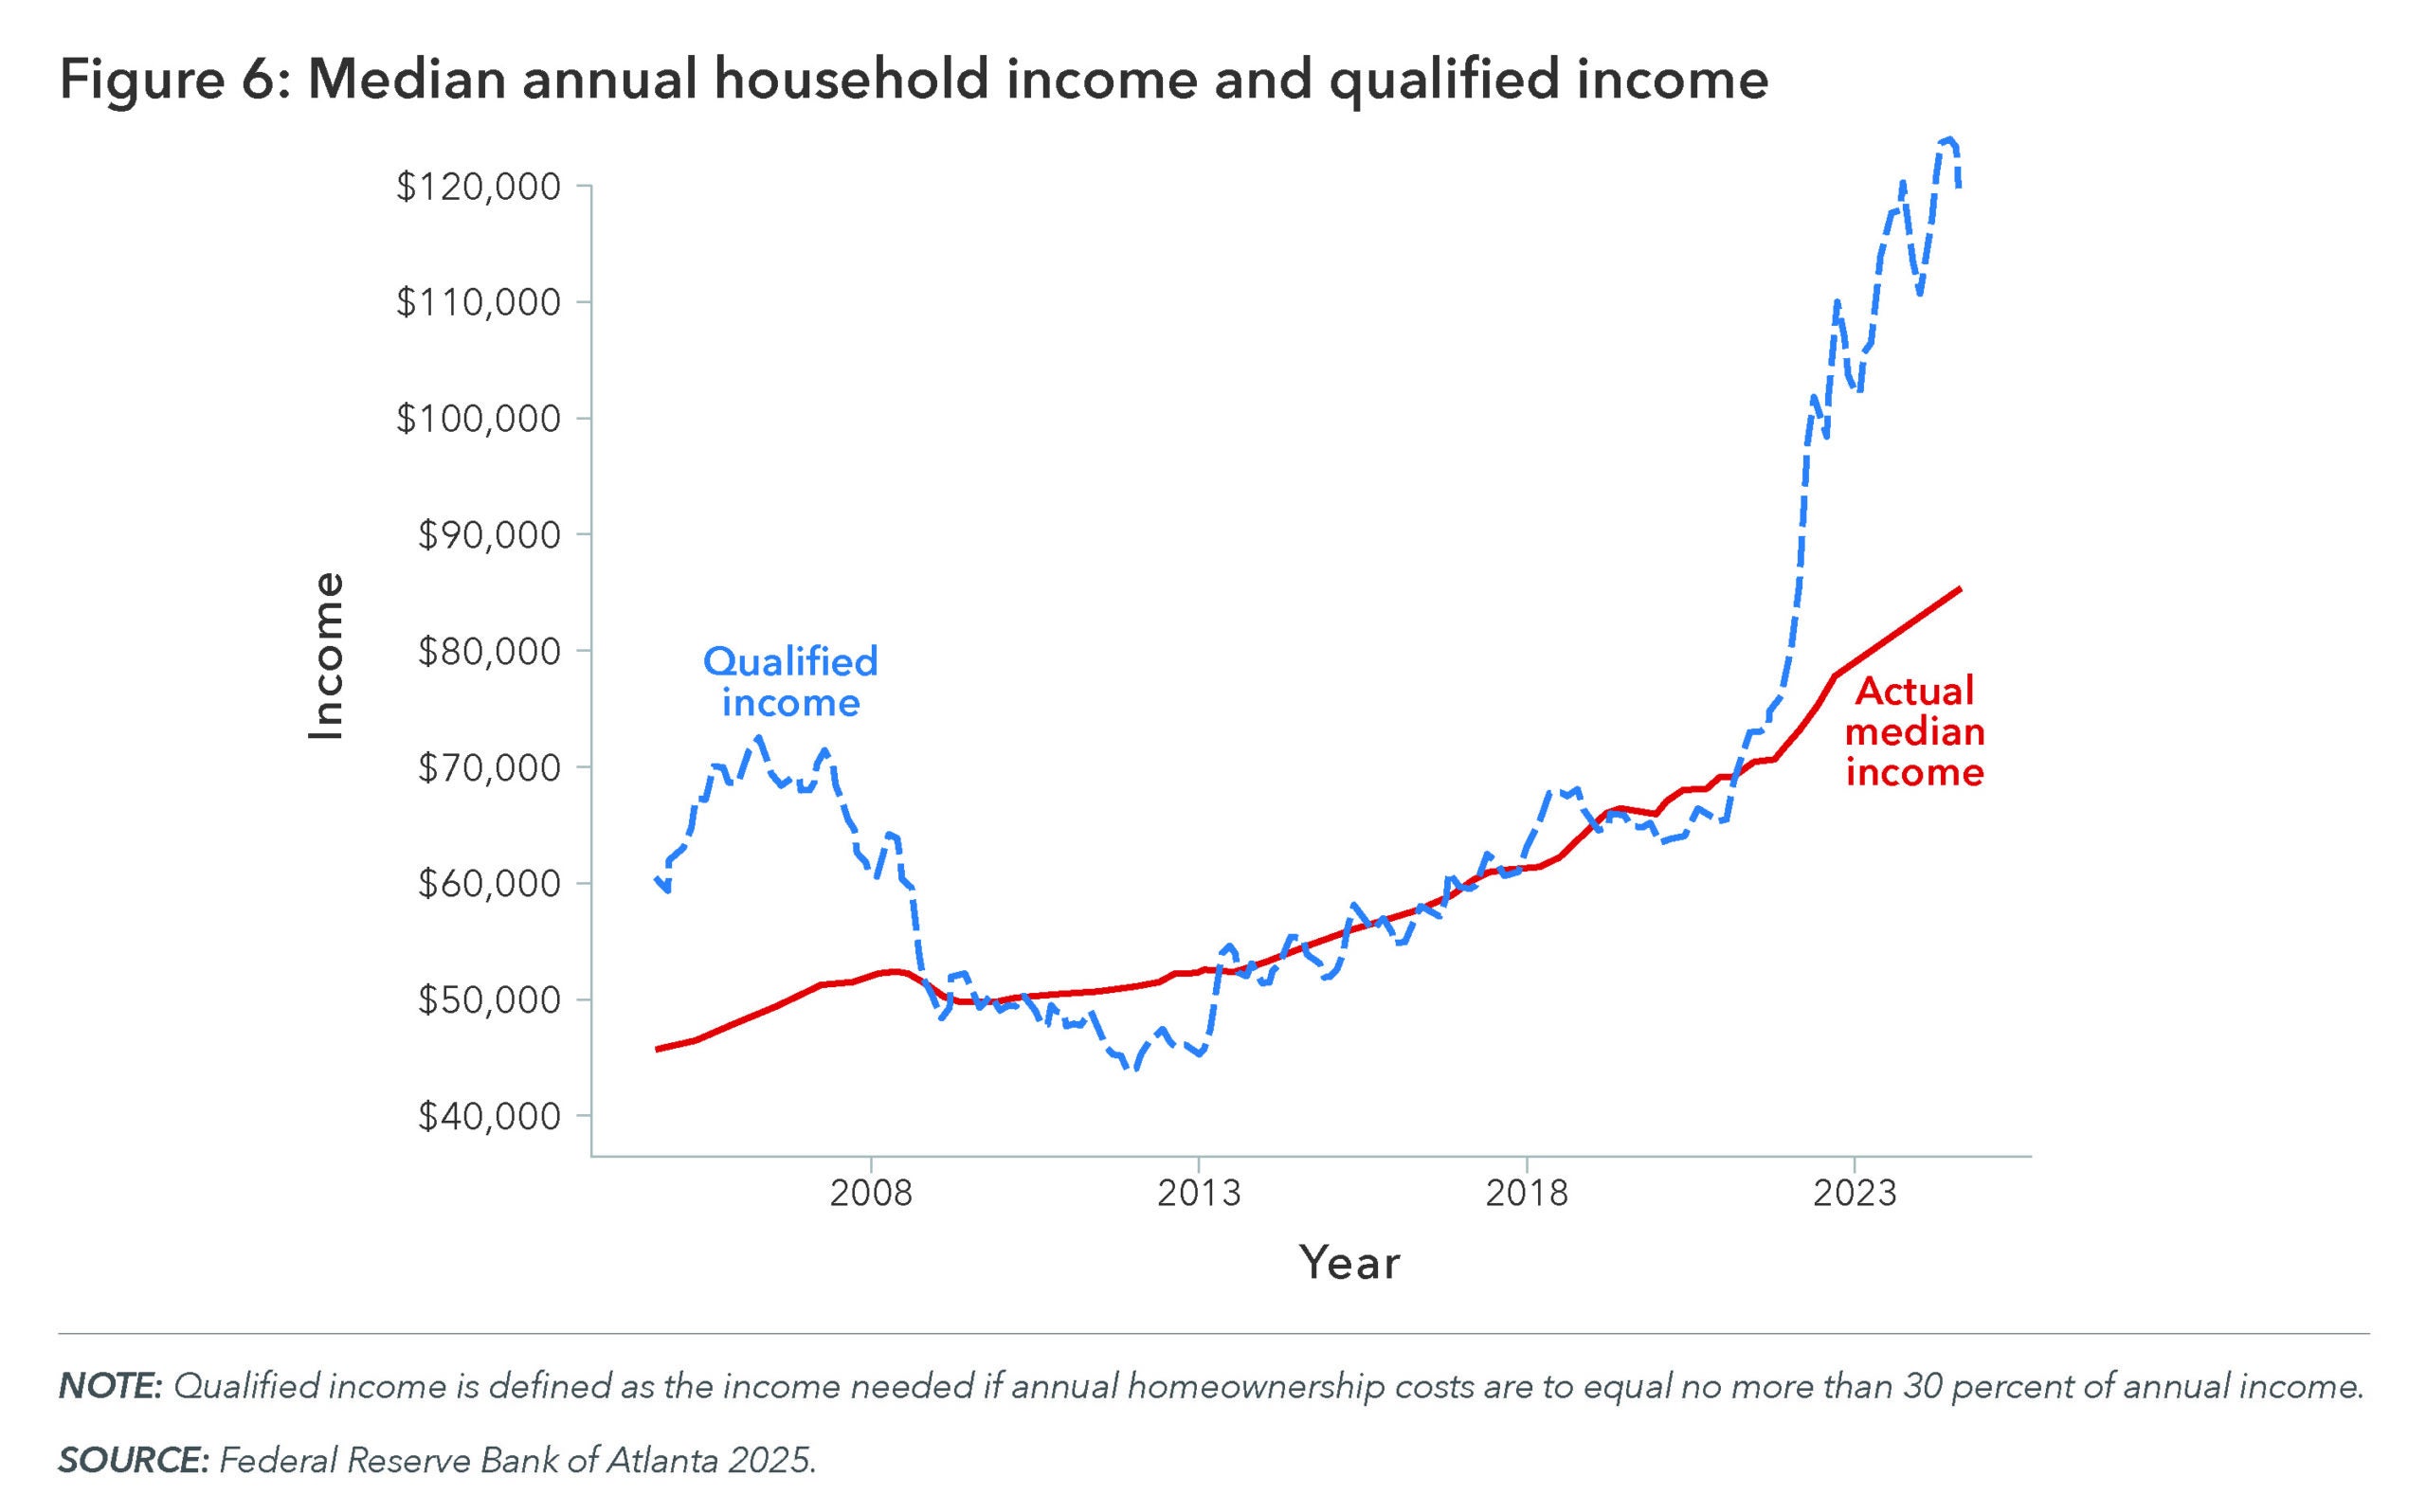
Likewise, high interest rates, tight lending standards, and constrained supply have made homeownership increasingly unaffordable for the typical American. Figure 6 shows the Federal Reserve Bank of Atlanta’s estimate of the income needed if annual homeownership costs are to equal no more than 30 percent of annual income and plots it against the actual median income. From 2008 to 2019, that “qualified income” matched the median annual income. But from 2020 through 2023, the qualified income has risen to 1.5 times the median annual income.
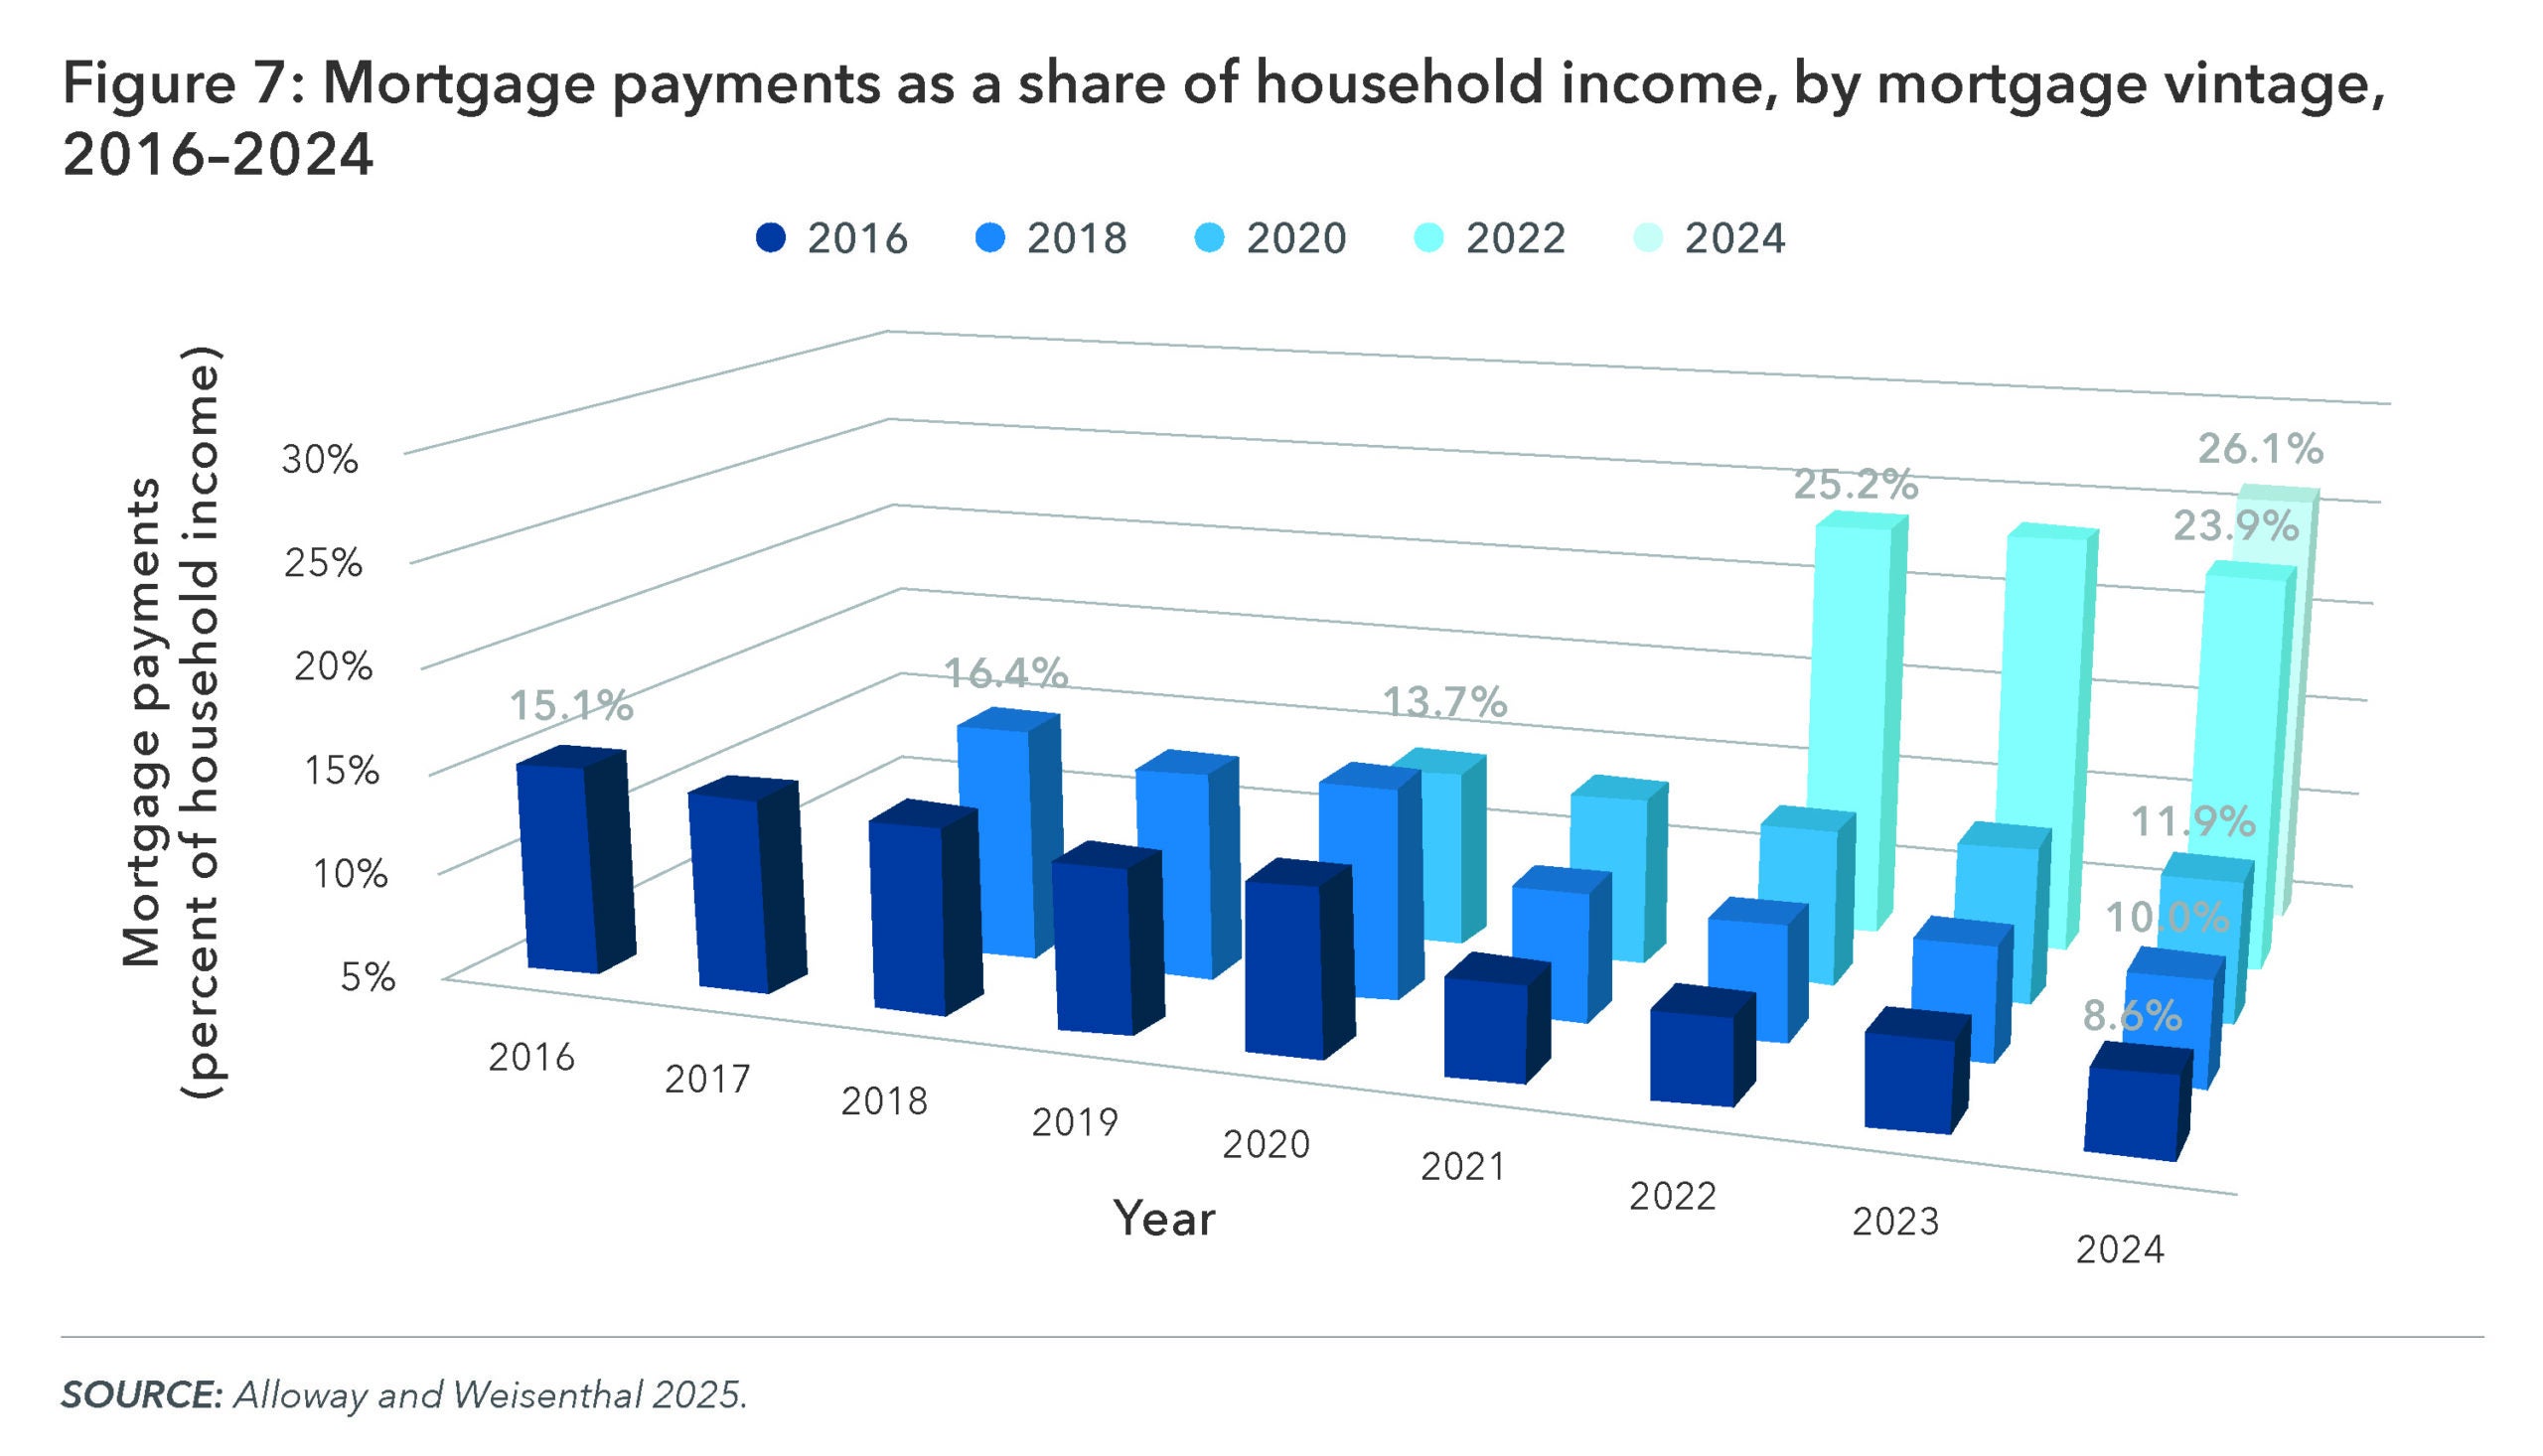
Finally, for homebuyers able to obtain a mortgage since the pandemic, housing costs take up a substantially higher share of income compared to costs for homebuyers pre-pandemic, as shown in figure 7 below. For a buyer who obtained a mortgage in 2016, those payments consumed on average 15 percent of income in the first year; for a buyer in 2024, first-year mortgage payments made up 26 percent.
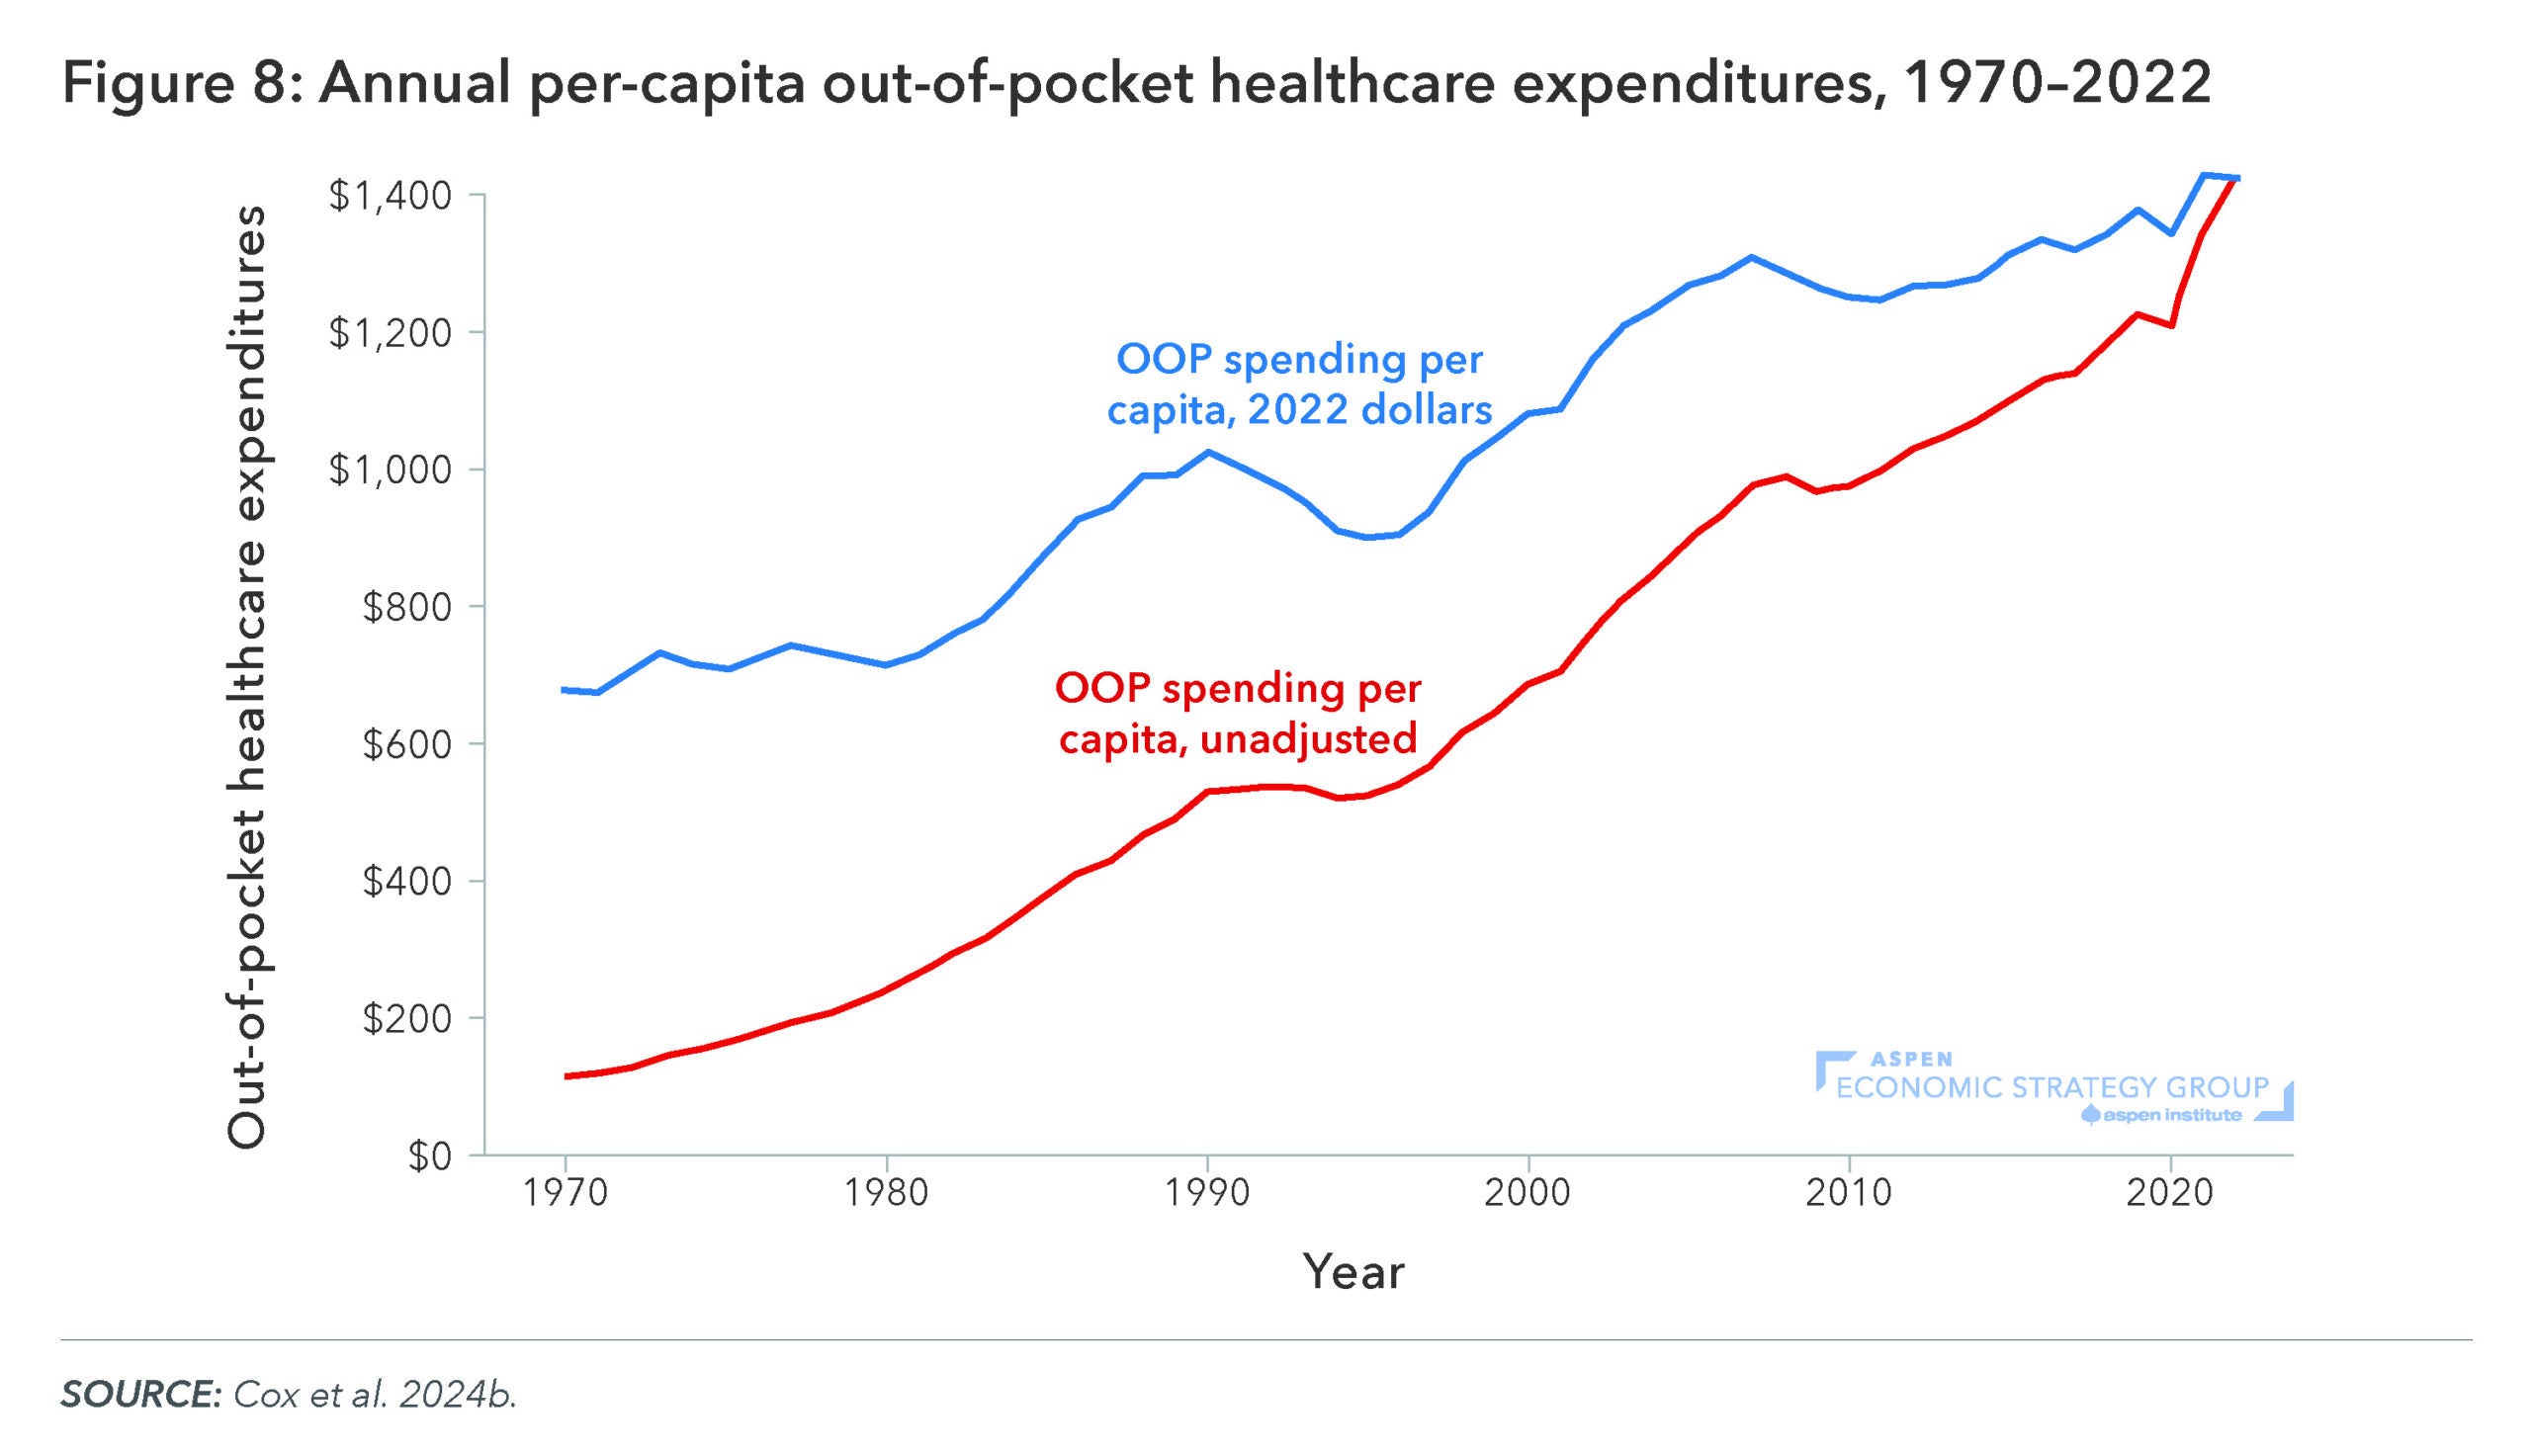
6. Healthcare costs are outpacing inflation.
Housing is not the only household necessity that has become increasingly expensive. Healthcare costs in the United States have risen steadily over the past several decades. Americans face high and rising out-of-pocket costs, which more than doubled from $677 per person (inflation-adjusted) in 1970 to $1,425 in 2022, as shown in figure 8. Importantly, out-of-pocket expenditures do not include spending on health insurance premiums, which have also risen substantially. In 1999, an average worker contributed $1,564 in premiums for family health insurance (not including the employer’s contribution); by 2024, that cost had more than quadrupled to $6,393 (KFF 2024).
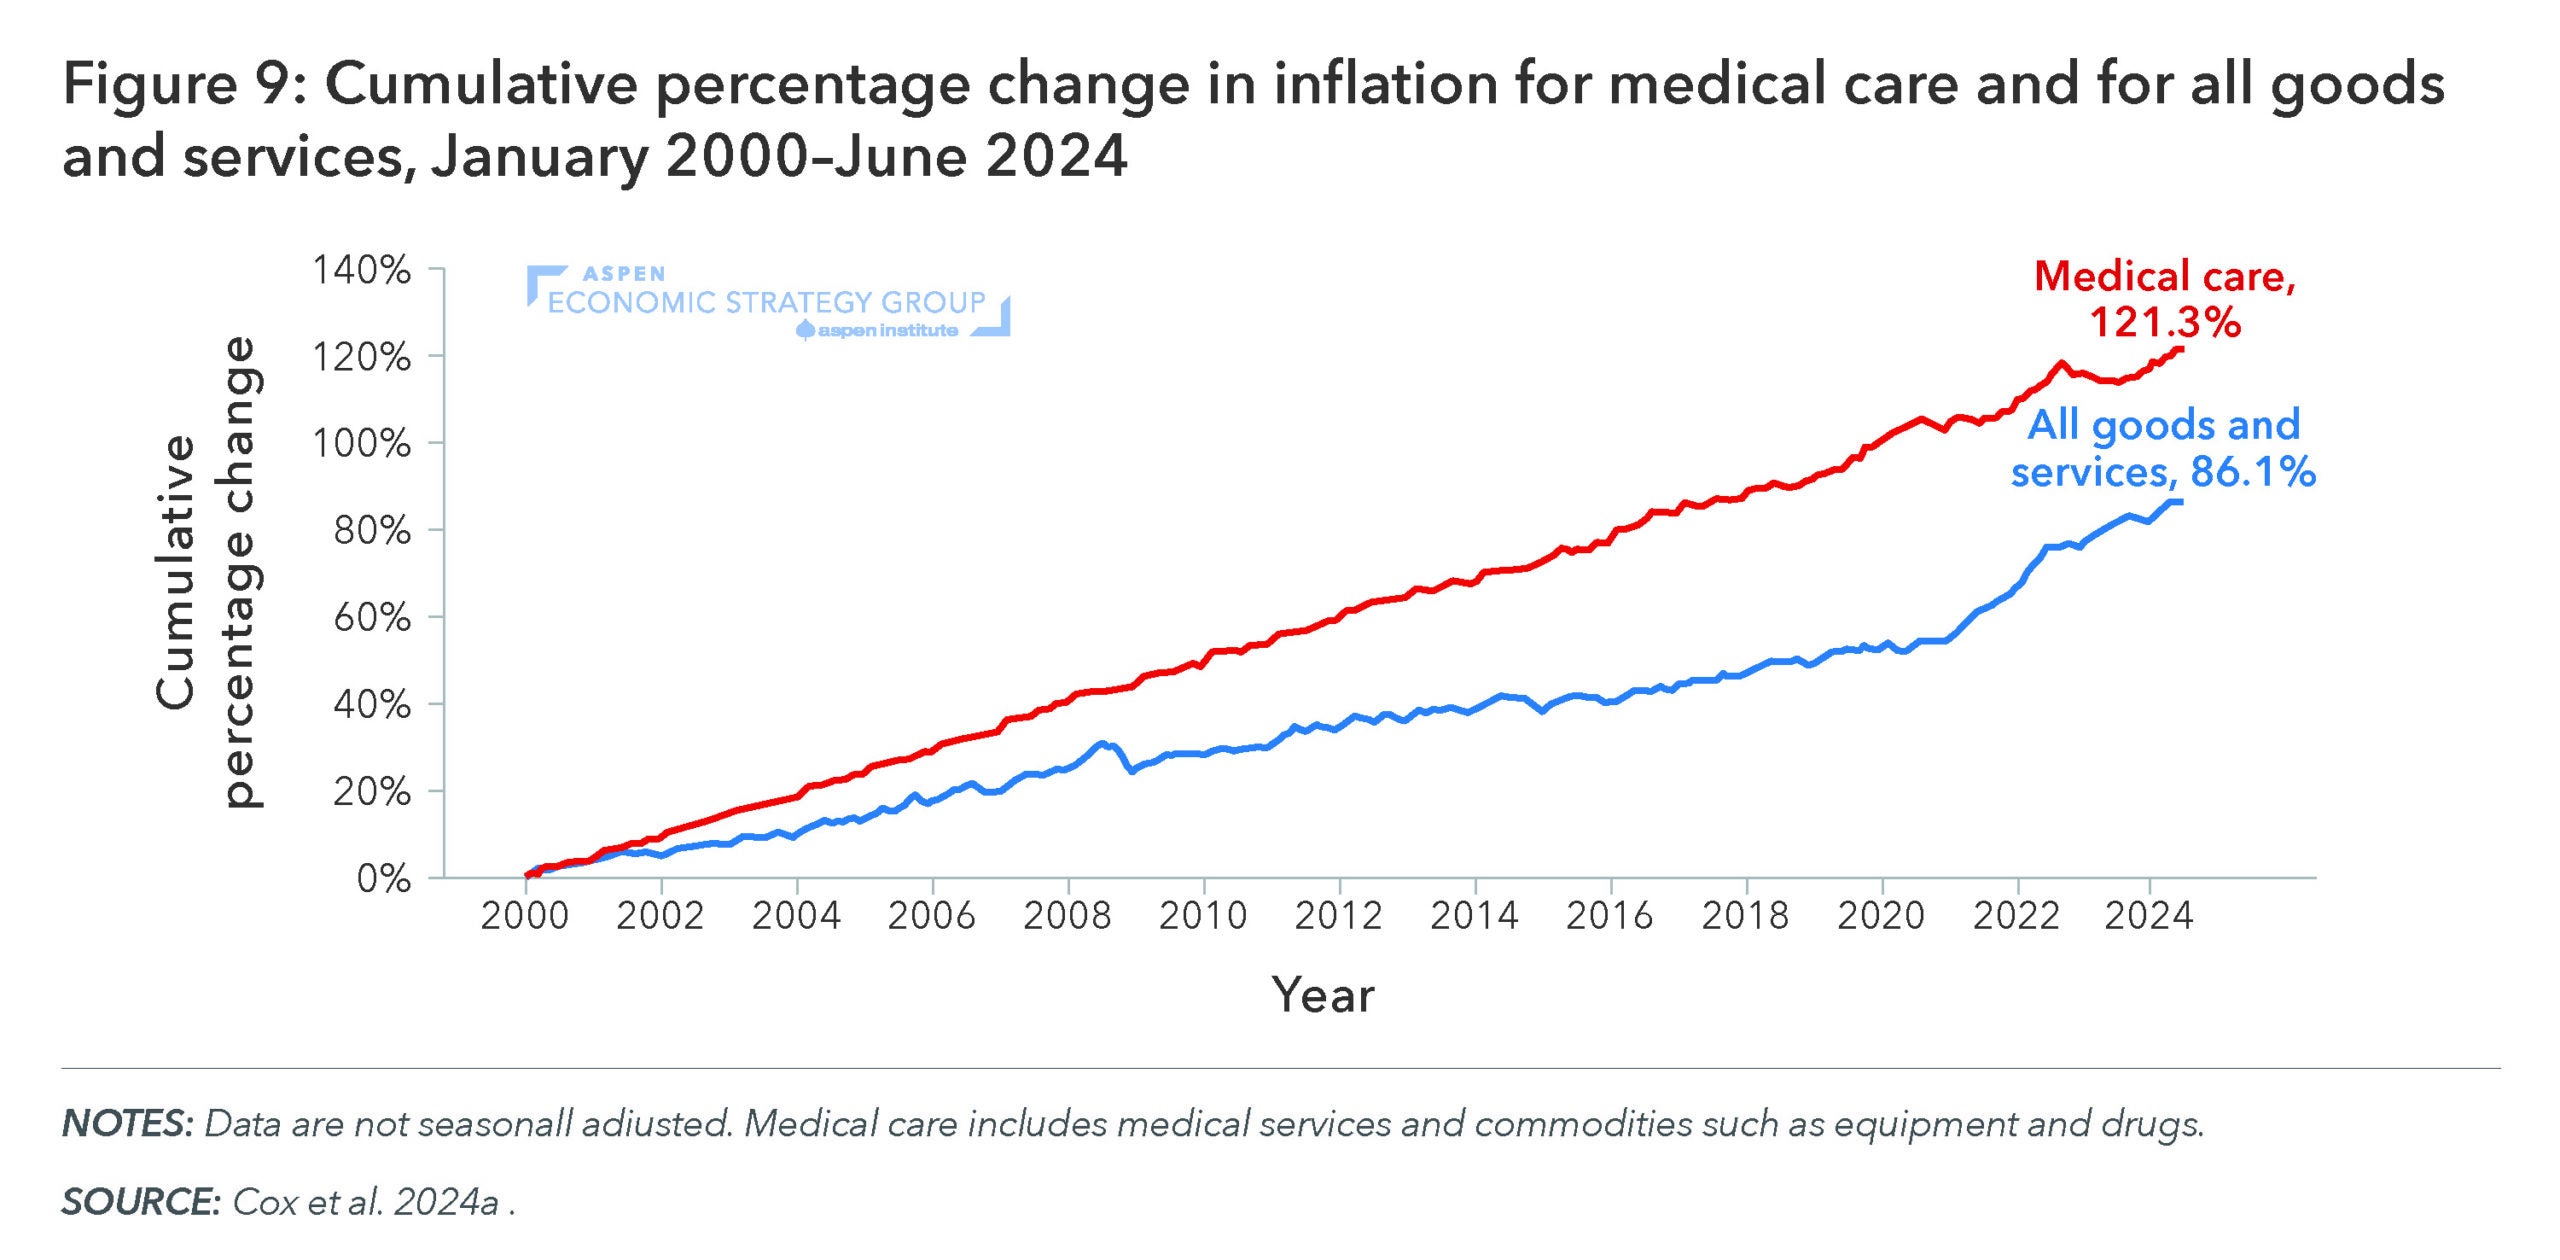
Research has found that healthcare costs are rising largely because prices—that is, the amount individuals pay for goods and services like pharmaceutical drugs, physician care, and hospital stays—have risen, as opposed to families consuming more healthcare and prices staying the same (Anderson et al. 2019). Figure 9 shows that while the overall consumer price index has risen 86 percent since 2000, the index for medical care has risen 121 percent.
While part of the rise in prices has been attributed to forces like hospital consolidation, high prices are also a result of valuable innovations that have led to new (and more expensive) drugs and treatments (Cooper et al. 2019). As Garthwaite and Starc (2023) lay out, high prices themselves serve as an incentive for firms to make costly investments in innovation, which increases access to new drugs and treatments in the future. In this way, reforms should focus on driving value in today’s healthcare system—by (for example) improving transparency and competition at several points in the pharmaceutical drug supply chain, rather than strictly by lowering prices.
Conclusion
Advancing widespread prosperity today requires a clear understanding of the current state, and historical evolution, of household economic well-being. Contrary to popular claims, American workers across the wage distribution are materially better off now than they were in 1979. Wage growth has exceeded the increased cost of living even for the bottom 10 percent of workers—indeed, the story of wage stagnation is largely one that ended in the mid-1990s. The rise in household income has been even greater due to the increased generosity of the tax-and-transfer system.
However, automation and globalization have widened the gap in wage growth between those with college degrees or greater, who have seen faster-than-average wage growth, and non-college workers, particularly men with high school degrees or less. These highly educated workers clustered in a small set of high-tech cities, and as housing supply failed to keep up with demand, such cities became too expensive for low-wage workers—driving a trend of widening geographic income inequality and cutting off mechanisms of economic mobility. Indeed, housing costs are increasingly straining renters’ and many homeowners’ budgets across the country. Along with housing, healthcare costs are a salient household expense that has outpaced overall price growth in recent decades.
Suggested Citation: Grant, Ella., and Pardue, Luke., 2025. “Current Evidence on Household Financial Well-Being.” In Advancing America’s Prosperity, edited by Melissa S. Kearney and Luke Pardue. Washington, DC: Aspen Institute. http://dx.doi.org/10.2139/ssrn.6506498.